
Day 1 of 30 days of Data Analytics with Projects Series
Welcome back peeps. Happy to share that we have just finished —
Finished Series —
60 Days of Data Science and Machine Learning with projects Series
Projects Videos —
All the projects, data structures, SQL, algorithms, system design, Data Science and ML , Data Analytics, Data Engineering, , Implemented Data Science and ML projects, Implemented Data Engineering Projects, Implemented Deep Learning Projects, Implemented Machine Learning Ops Projects, Implemented Time Series Analysis and Forecasting Projects, Implemented Applied Machine Learning Projects, Implemented Tensorflow and Keras Projects, Implemented PyTorch Projects, Implemented Scikit Learn Projects, Implemented Big Data Projects, Implemented Cloud Machine Learning Projects, Implemented Neural Networks Projects, Implemented OpenCV Projects,Complete ML Research Papers Summarized, Implemented Data Analytics projects, Implemented Data Visualization Projects, Implemented Data Mining Projects, Implemented Natural Leaning Processing Projects, MLOps and Deep Learning, Applied Machine Learning with Projects Series, PyTorch with Projects Series, Tensorflow and Keras with Projects Series, Scikit Learn Series with Projects, Time Series Analysis and Forecasting with Projects Series, ML System Design Case Studies Series videos will be published on our youtube channel ( just launched).
Subscribe today!
We are now starting a new series — 30 days of Data Analytics with Projects. This series would run in parallel with—
Ongoing Series —
For Data Analytics Projects —
What’s covered till now —
Day 1 : Data Analytics basics and kickstart of Data analytics with projects series
Day 3 : Data Analytics Ecosystem — Data Life Cycle, Data Analysis complete process ( most important things)
Day 5 : Statistics
Day 6 : Basic and Advanced SQL
Day 8 : Pandas and Numpy
Day 9 : Data Manipulation
Day 10 : Data Visualization — Part 1
Day 11 : Project 1 : Data Visualization — Part 2
Day 12 : Data Visualization — Part 3
Day 13: Tableau — Part 1
Day 14: Tableau — Part 2
Day 15: Tableau — Part 3
Day 16 : Data Analysis Project 2
Day 17 : Data Analysis Project 3
Day 18: Data Analysis Project 4
Day 20 : Data Analysis Project 6 — Part 1
Day 21 : Data Analysis Project 7
Day 23: Data Analytics Project 9
Day 24: Data Analytics Project 10
Day 25: Data Analytics Project 11
Day 26: Power BI
Day 27: Performance Metrics
Day 28: Regression
Day 29: Regression
Day 30: Classification
Take Complete Hands On Tableau Course : Link
What is Data Analytics?
In layman terms, Data Analytics is about three things —
Business + Data + Statistics = Data Driven Decision Making
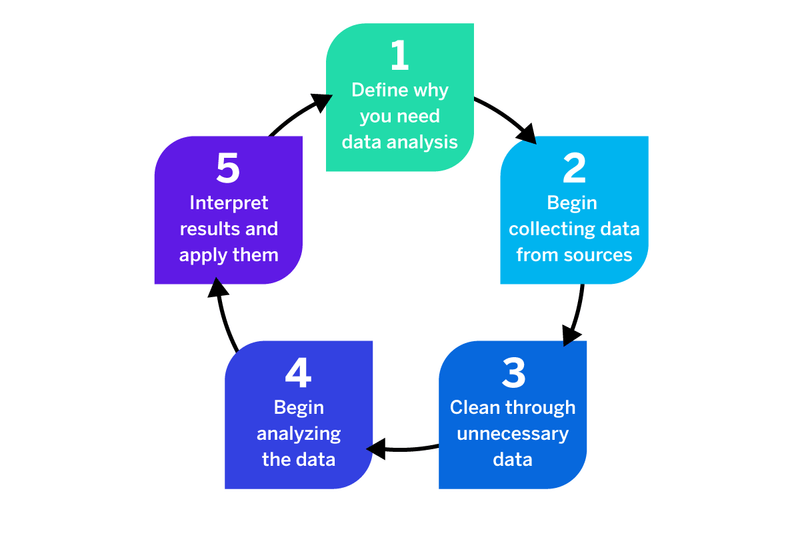
Data Analytics is a process in which data is collected/extracted into raw format, cleaned and processed and then utilized to make data driven business decisions using data visualizations and Statistics.
The most important question one should ask as a data analyst is — How to get better analysis?
Goal
Let’s set a clear objective.
The goal is to develop an intuition and understand (in the depth) the practical side of Data Analysis and build projects.
I have created a GitHub repo for this series where we will be maintaining our code.
Tools
We will be using Google Colabs, Jupyter Notebooks and Tableau( based on our requirement).
Let’s talk about what are we going to cover in this series —
Let me be very straightforward. Data Analytics is a vast field and to be able to cover everything isn’t the aim of this series; instead, it will be more hands on than digging down the theory rabbit hole.
We will be covering —
1. Business Understanding
2. Data Analytics Ecosystem
3. Probability
4. Statistics
5. Basic and Advanced SQL
Set Theory Operations, Stored Procedures and CASE statements in SQL
Subqueries, Group by, order by and Having clauses in SQL and Analytical Functions
BigQuery Basics, SELECT, FROM, WHERE and Date and Extract in BigQuery
Common Expression Table, UNNEST Clause, SQL vs NoSQL Databases
Data Collection and Data Cleaning
9. Data Manipulation
10. Data Visualization
Data Visualization using Matplotlib and Seaborn with project
13. Tableau
Create trend lines and understand the relevant statistical metrics such as p-value and R-squared
Create Histogram, Bullet Chart, Bubbles Chart, Funnel Charts, Advanced Charts
Projects
Data Analysis Project 6 — Part 1
Categorical and Numerical Features
14. Data Preparation
15. Data Modeling
16. Data Evaluation
17. Statistical Analysis
18. Regression analysis
19. Least squares and inference
20. Regression models
21. Big Data Analytics
21. Classification Trees
22. Projects
That’s it for now. Day 2 :
Let me know if you have questions in the comment section below. Subscribe/ Follow, Like/Clap as it would encourage me to write more in my free time
Stay Tuned!!
Read More —
11 most important System Design Base Concepts
6. Networking, How Browsers work, Content Network Delivery ( CDN)
13. System Design Template — How to solve any System Design Question
System Design Case Studies — In Depth
Design Instagram
Design Netflix
Design Reddit
Design Amazon
Design Messenger App
Design Twitter
Design URL Shortener
Design Dropbox
Design Youtube
Design API Rate Limiter
Design Web Crawler
Design Amazon Prime Video
Design Facebook’s Newsfeed
Design Yelp
Design Uber
Design Tinder
Design Tiktok
Design Whatsapp
Most Popular System Design Questions
Mega Compilation : Solved System Design Case studies
Complete Data Structures and Algorithm Series
Some of the other best Series —
30 days of Data Structures and Algorithms and System Design Simplified
Data Science and Machine Learning Research ( papers) Simplified **
100 days : Your Data Science and Machine Learning Degree Series with projects
Complete Data Visualization and Pre-processing Series with projects
Exceptional Github Repos — Part 1
Exceptional Github Repos — Part 2
Tech Newsletter —
If you are interested, you can join my newsletter through which I send tech interview tips, techniques, patterns, hacks — Software Development, ML, Data Science, Startups and Technology projects to more than 30K readers. You can subscribe to Tech Brew :
For Python Projects —
For complete 60 days of Data Science and ML : Day 1 — Day 60 : Quick Recap of 60 days of Data Science and ML
Follow for more updates. Stay tuned and keep coding!
For other projects, tune to —
Build Machine Learning Pipelines( With Code)
Recurrent Neural Network with Keras
Clustering Geolocation Data in Python using DBSCAN and K-Means
Facial Expression Recognition using Keras
Hyperparameter Tuning with Keras Tuner
Custom Layers in Keras


