
Day 3 of 30 days of Data Analytics with Projects Series
Welcome back peeps. Weekend is going great and I’m happy to share that we have just finished —
Finished Series —
60 Days of Data Science and Machine Learning with projects Series
Projects Videos —
All the projects, data structures, SQL, algorithms, system design, Data Science and ML , Data Analytics, Data Engineering, , Implemented Data Science and ML projects, Implemented Data Engineering Projects, Implemented Deep Learning Projects, Implemented Machine Learning Ops Projects, Implemented Time Series Analysis and Forecasting Projects, Implemented Applied Machine Learning Projects, Implemented Tensorflow and Keras Projects, Implemented PyTorch Projects, Implemented Scikit Learn Projects, Implemented Big Data Projects, Implemented Cloud Machine Learning Projects, Implemented Neural Networks Projects, Implemented OpenCV Projects,Complete ML Research Papers Summarized, Implemented Data Analytics projects, Implemented Data Visualization Projects, Implemented Data Mining Projects, Implemented Natural Leaning Processing Projects, MLOps and Deep Learning, Applied Machine Learning with Projects Series, PyTorch with Projects Series, Tensorflow and Keras with Projects Series, Scikit Learn Series with Projects, Time Series Analysis and Forecasting with Projects Series, ML System Design Case Studies Series videos will be published on our youtube channel ( just launched).
Subscribe today!
We are now starting a new series — 30 days of Data Analytics with Projects. This series would run in parallel with —
Ongoing Series —
What’s covered till now —
Day 1 : Data Analytics basics and kickstart of Data analytics with projects series
Day 3 : Data Analytics Ecosystem — Data Life Cycle, Data Analysis complete process ( most important things)
In this post we will cover Data Analytics Ecosystem —
Data Life Cycle
Data Analysis complete process ( most important things)
Let’s dive in!
The Data Life Cycle refers to the stages that data goes through from its creation to its eventual archiving or deletion.
The stages of the data life cycle typically include:
- Data Creation: This is the stage where data is initially collected, generated, or acquired.
- Data Entry and Validation: This is the stage where the data is entered into the system and checked for accuracy and completeness.
- Data Storage: This is the stage where the data is stored in a database or other type of storage system.
- Data Processing: This is the stage where the data is processed, analyzed, and transformed into meaningful information.
- Data Output and Distribution: This is the stage where the processed data is presented to users in the form of reports, dashboards, or other types of outputs.
- Data Archiving and Backup: This is the stage where the data is backed up and archived for long-term retention.
- Data Retention and Destruction: This is the stage where data is retained for a specified period of time and then securely destroyed when it is no longer needed.
Code Implementation for each stage —
import pandas as pd
import sqlite3

# Data Creation
data = pd.DataFrame({
    'ID': [1, 2, 3],
    'Name': ['John', 'Jane', 'Mark'],
    'Age': [25, 30, 35]
})

# Data Entry and Validation
data['Email'] = ['[email protected]', '[email protected]', '[email protected]']
data = data[['ID', 'Name', 'Email', 'Age']]  # Reorder columns if needed
data_valid = data.dropna()  # Check and remove any rows with missing values

# Data Storage
conn = sqlite3.connect('data.db')
data_valid.to_sql('customer_data', conn, if_exists='replace', index=False)
conn.close()

# Data Processing
conn = sqlite3.connect('data.db')
query = 'SELECT * FROM customer_data WHERE Age > 25'
processed_data = pd.read_sql_query(query, conn)
conn.close()

# Data Output and Distribution
processed_data.to_csv('output.csv', index=False)
processed_data.to_excel('output.xlsx', index=False)

# Data Archiving and Backup
import shutil
shutil.copy('data.db', 'data_backup.db')

# Data Retention and Destruction
# Delete the data.db file when it is no longer needed
import os
os.remove('data.db')
Code explanation —
Data Creation: We create a sample dataframe using pandas with columns for ID, Name, Age, and Email.
Data Entry and Validation: We add an “Email” column to the dataframe and reorder the columns if necessary. We then perform data validation by removing any rows with missing values.
Data Storage: We establish a connection to an SQLite database and store the validated data in a table called “customer_data”.
Data Processing: We connect to the SQLite database again and execute a SQL query to select only the rows where the age is greater than 25. The result is stored in the “processed_data” dataframe.
Data Output and Distribution: We save the processed data as a CSV file and an Excel file for distribution to users.
Data Archiving and Backup: We create a backup copy of the database file by copying it to another file named “data_backup.db”.
Data Retention and Destruction: Finally, we delete the database file “data.db” when it is no longer needed.
The Data Analysis process is composed of several steps:
- Define the problem or question: Identify the problem or question that needs to be answered, and define the objectives of the analysis.
- Collect the data: Collect the data needed to answer the problem or question.
- Clean and Prepare the data: Clean and prepare the data for analysis, this includes removing duplicate, missing values, outliers, etc.
- Explore the data: Explore the data to understand the characteristics and patterns of the data.
- Model the data: Develop models to answer the problem or question.
- Evaluate the model: Evaluate the model’s performance and accuracy.
- Communicate the results: Communicate the results of the analysis in a clear and concise way to the stakeholders.
- Take action: Based on the results, take the appropriate actions to solve the problem or answer the question.
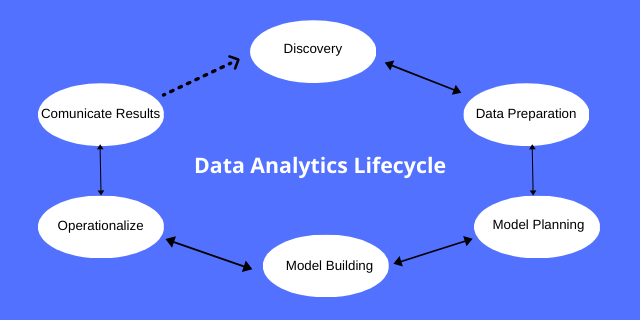
Data Life Cycle
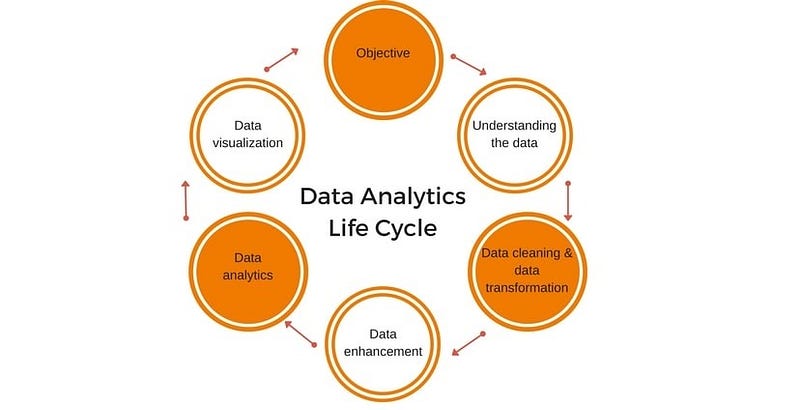
There are 6 steps in the data analytics lifecycle.
Objective — It consists of defining business objectives, gathering required information, Define analysis methods and identify the end result/goal.
# Example code for defining business objectives and analysis methods

business_objective = "Increase customer retention rate by 10% within the next quarter."

required_information = [
    "Customer churn data",
    "Customer engagement metrics",
    "Marketing campaign data",
    # Add more required information as needed
]

analysis_methods = [
    "Predictive modeling",
    "Segmentation analysis",
    "Correlation analysis",
    # Add more analysis methods as needed
]

end_result = "A set of actionable recommendations to improve customer retention."

# Print the defined business objectives, required information, analysis methods, and end result
print(f"Business Objective: {business_objective}")
print("Required Information:")
for info in required_information:
    print(f"- {info}")
print("Analysis Methods:")
for method in analysis_methods:
    print(f"- {method}")
print(f"End Result: {end_result}")
Understanding the data — It consists of raw data collection from sources, analyzing the data requirements, check for right data and its characteristics.
# Example code for understanding the data

# Assume data collection from various sources and analysis of data requirements have been done

# Check data characteristics
data = pd.read_csv('data.csv')  # Assuming data is collected from a CSV file
print("Data Characteristics:")
print(data.head())  # Print the first few rows of the data
print(data.info())  # Print the information about the data (e.g., data types, missing values)
Prepare the data — It consists of cleaning, formatting , manipulating and blending the data.
# Example code for data preparation

# Assume data cleaning, formatting, manipulation, and blending steps have been performed

# Clean the data
cleaned_data = data.dropna()  # Drop rows with missing values

# Format and manipulate the data
cleaned_data['Date'] = pd.to_datetime(cleaned_data['Date'])  # Convert 'Date' column to datetime format
cleaned_data['Sales'] = cleaned_data['Sales'].astype(float)  # Convert 'Sales' column to float data type

# Blend the data
blended_data = cleaned_data.merge(another_dataset, on='CustomerID', how='inner')  # Perform data blending with another dataset

# Print the prepared data
print(blended_data.head())
Exploratory Data Analysis — It consists of developing the methodology, determine the important variables and features and build visualizations and prepare the model.
# Example code for exploratory data analysis

# Assume the methodology development, variable selection, visualization, and model preparation steps have been performed

# Develop the methodology
methodology = "Perform customer segmentation using RFM analysis and build a predictive churn model."

# Determine important variables and features
important_variables = ['Recency', 'Frequency', 'Monetary']

# Build visualizations
plt.scatter(blended_data['Recency'], blended_data['Monetary'])
plt.xlabel('Recency')
plt.ylabel('Monetary')
plt.title('Recency vs Monetary')
plt.show()

# Prepare the model
X = blended_data[important_variables]
y = blended_data['Churn']
model = RandomForestClassifier()
model.fit(X, y)
Modeling and validation — It consists of building the models, assess the models, evaluate the results, review the validation results.
# Assume model building, assessment, result evaluation, and validation steps have been performed

# Build the model
X_train, X_test, y_train, y_test = train_test_split(X, y, test_size=0.2, random_state=42)
model = RandomForestClassifier()
model.fit(X_train, y_train)

# Assess the model
y_pred = model.predict(X_test)

# Evaluate the results
accuracy = accuracy_score(y_test, y_pred)
precision = precision_score(y_test, y_pred)
recall = recall_score(y_test, y_pred)

# Review the validation results
validation_results = {
    'Accuracy': accuracy,
    'Precision': precision,
    'Recall': recall,
}

# Print the validation results
print("Validation Results:")
for metric, value in validation_results.items():
    print(f"- {metric}: {value}")
Visualize and Communicate — Prepare storyline and dashboard, Communicate the key insights, determine the best analytics that influences the business decision the most, make recommendations.
# Assume the preparation of storyline, dashboard, and communication of insights have been done

# Prepare storyline and dashboard
storyline = "Based on the analysis, the following key insights were identified:"

key_insights = [
    "Customers who have a high recency value and low frequency and monetary values are at a higher risk of churn.",
    "The predictive churn model achieved an accuracy of 85% on the test data.",
    "The most influential variables for churn prediction are Recency, Frequency, and Monetary.",
]

dashboard = {
    'Key Insights': key_insights,
    'Recommendations': "To improve customer retention, targeted marketing campaigns should be launched for customers identified as high-risk based on the churn model.",
    # Add more dashboard components as needed
}

# Print the storyline and dashboard
print(storyline)
print("Key Insights:")
for insight in key_insights:
    print(f"- {insight}")
print("Recommendations:")
print(dashboard['Recommendations'])
Data Analysis complete Process ( Most important things)
While there are many steps and processes there are 3 things that most important ( that you should know) —
- How to extract data from sources and ingest into data pipelines? ( It’s a part of our data engineering series)
- How to clean the data and prepare compelling visualization and storyline/dashboard?
- How to take action once the insights have been communicated?
We covered the different data analysis types in our previous post.
In this series, we will cover all the important steps that you should know and most importantly how to prepare data pipelines, which chart to use when and how to prepare compelling storyboards/dashboards — all through projects.
That’s it for now. Day 4 -
Let me know if you have questions in the comment section below. Subscribe/ Follow, Like/Clap as it would encourage me to write more in my free time
Stay Tuned!!
Read More —
11 most important System Design Base Concepts
6. Networking, How Browsers work, Content Network Delivery ( CDN)
13. System Design Template — How to solve any System Design Question
System Design Case Studies — In Depth
Complete Data Structures and Algorithm Series
Some of the other best Series —
30 days of Data Structures and Algorithms and System Design Simplified
Data Science and Machine Learning Research ( papers) Simplified **
100 days : Your Data Science and Machine Learning Degree Series with projects
Complete Data Visualization and Pre-processing Series with projects
Exceptional Github Repos — Part 1
Exceptional Github Repos — Part 2
Tech Newsletter —
If you are interested, you can join my newsletter through which I send tech interview tips, techniques, patterns, hacks — Software Development, ML, Data Science, Startups and Technology projects to more than 30K readers. You can subscribe to Tech Brew :
For Python Projects —
For complete 60 days of Data Science and ML : Day 1 — Day 60 : Quick Recap of 60 days of Data Science and ML
Follow for more updates. Stay tuned and keep coding!
For other projects, tune to —
Build Machine Learning Pipelines( With Code)
Recurrent Neural Network with Keras
Clustering Geolocation Data in Python using DBSCAN and K-Means
Facial Expression Recognition using Keras
Hyperparameter Tuning with Keras Tuner
Custom Layers in Keras


