
Day 27 of 30 days of Data Analytics with Projects Series — Performance Metrics
Welcome back peep. Hope all’s well. This is Day 27 of 30 days of data analytics where we will be covering Performance Metrics.
- Confusion Matrix
- F1 Score
- Recall
- Precision
- Type I error
- Type II error
- Accuracy
- ROC Curve
- AUC score
What’s covered in 30 days of Data Analytics Series till now —
Day 1 : Data Analytics basics and kickstart of Data analytics with projects series
Day 3 : Data Analytics Ecosystem — Data Life Cycle, Data Analysis complete process ( most important things)
Day 5 : Statistics
Day 6 : Basic and Advanced SQL
Day 8 : Pandas and Numpy
Day 9 : Data Manipulation
Day 10 : Data Visualization — Part 1
Day 11 : Project 1 : Data Visualization — Part 2
Day 12 : Data Visualization — Part 3
Day 13: Tableau — Part 1
Day 14: Tableau — Part 2
Day 15: Tableau — Part 3
Day 16 : Data Analysis Project 2
Day 17 : Data Analysis Project 3
Day 18: Data Analysis Project 4
Day 20 : Data Analysis Project 6
Day 21 : Data Analysis Project 7
Take Complete Hands On Tableau Course : Link
Projects Videos —
All the projects, data structures, SQL, algorithms, system design, Data Science and ML , Data Analytics, Data Engineering, , Implemented Data Science and ML projects, Implemented Data Engineering Projects, Implemented Deep Learning Projects, Implemented Machine Learning Ops Projects, Implemented Time Series Analysis and Forecasting Projects, Implemented Applied Machine Learning Projects, Implemented Tensorflow and Keras Projects, Implemented PyTorch Projects, Implemented Scikit Learn Projects, Implemented Big Data Projects, Implemented Cloud Machine Learning Projects, Implemented Neural Networks Projects, Implemented OpenCV Projects,Complete ML Research Papers Summarized, Implemented Data Analytics projects, Implemented Data Visualization Projects, Implemented Data Mining Projects, Implemented Natural Leaning Processing Projects, MLOps and Deep Learning, Applied Machine Learning with Projects Series, PyTorch with Projects Series, Tensorflow and Keras with Projects Series, Scikit Learn Series with Projects, Time Series Analysis and Forecasting with Projects Series, ML System Design Case Studies Series videos will be published on our youtube channel ( just launched).
Subscribe today!
Tech Newsletter —
If you are interested, you can join my newsletter through which I send tech interview tips, techniques, patterns, hacks — Software Development, ML, Data Science, Startups and Technology projects to more than 30K readers. You can subscribe to Tech Brew :
Let’s get started!
Performance Metrics
Performance metrics for Classification Models can be divided into —
Class Labels
Probabilities
Under Class labels —
- Confusion Matrix
- F1 Score
- Recall
- Precision
- Type I error
- Type II error
- Accuracy
Under Probabilities —
- ROC Curve
- AUC score
Before we jump into further digging, let’s understand some basics —
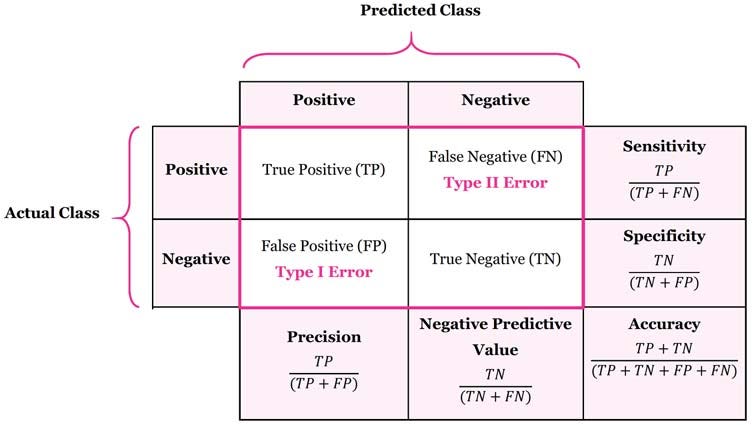
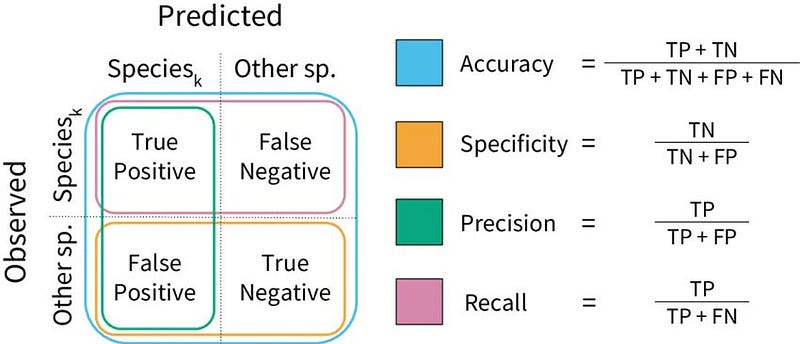
True Positives ( TP)
Those values that are correctly predicted positive values. For example if a bird’s color actual class is yes and the predicted class is also yes.
True Negatives ( TN)
Those values that are correctly predicted negative values. For example if a bird’s color actual class is no and the predicted class is also no .
False Positives ( FP)
Those values that are incorrectly predicted positive values. For example if a bird’s color actual class is no and the predicted class is yes.
False Negatives (FN)
Those values that are incorrectly predicted negative values. For example if a bird’s color actual class is yes and the predicted class is no.
Before I move forward, lets understand some basic terms —
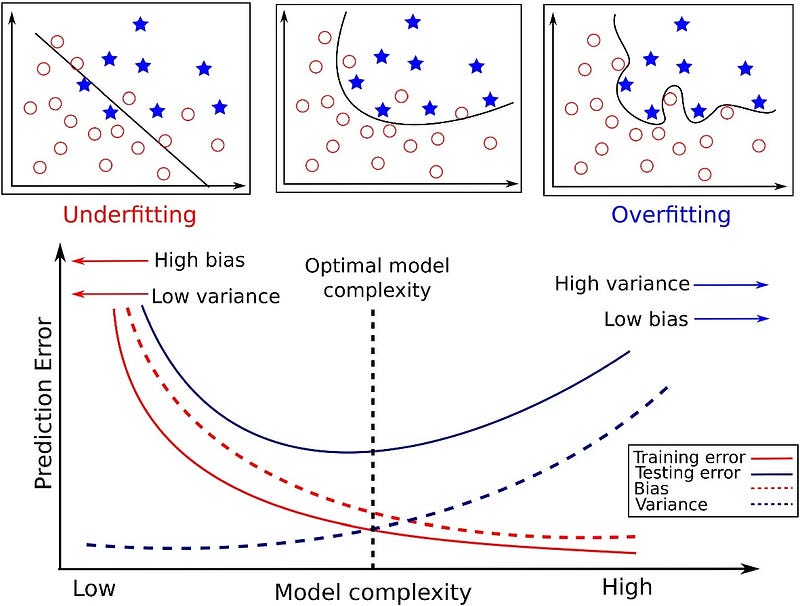
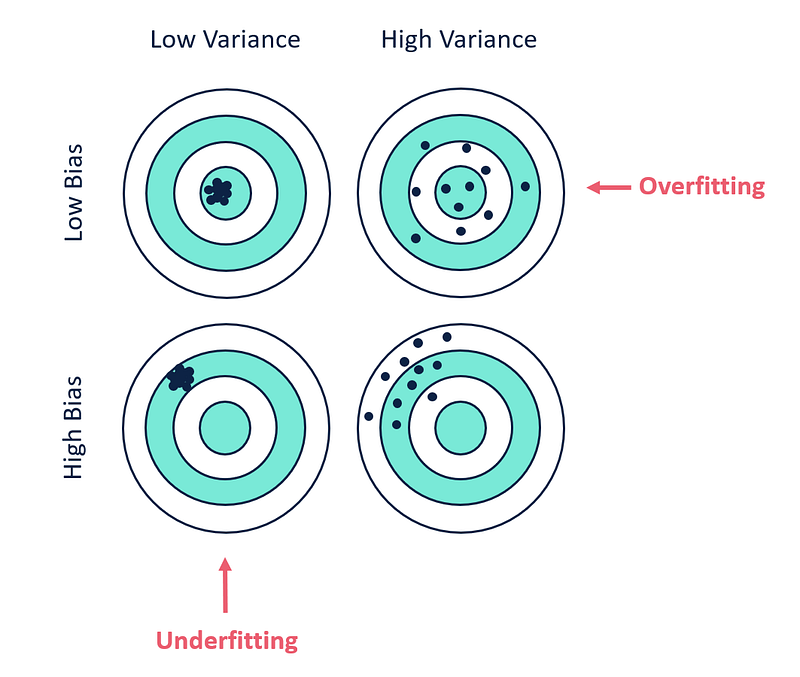
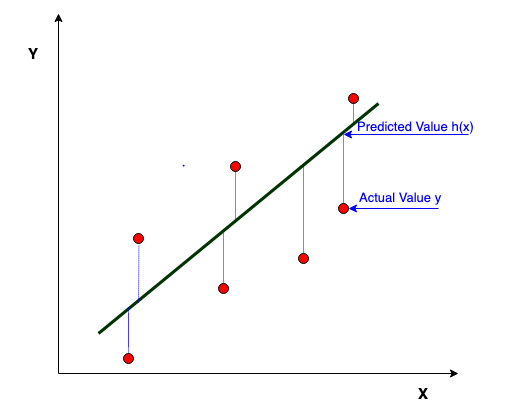
Bias
In layman terms, bias is the difference between the predicted and actual values.
These biases are of different types —
- Selection Bias : It’s about collecting that data which doesn’t represent the target population.
- Measurement Bias : It’s about being biased towards a particular result while observing other features/columns.
- Algorithm Bias : It’s about the ML algorithm getting biased over the training data.
- Exclusion Bias : It’s about excluding valuable data which is tagged as not important.
- Recall Bias : It’s about labeling same data inconsistently.
Low bias : In this the model makes only few assumptions about the form of the target function.
High Bias : In this the model makes more assumptions about the form of the target function.
Low bias ML algorithms : KNN, SVM and Decision Trees
High bias ML algorithms : Logistic Regression and Linear Regression
Example —
If the model is trained on the shape of the fruit, then bias example would be predicting a lychee to be a dragon fruit.
Variance
Variance is an error which measures randomness of the predicted results from the actual results. It’s defined as model’s sensitivity to randomness in the data.
Low Variance : It’s about the model having minor variation in the predicted values wrt to any changes in the training data set.
High Variance : It’s about the model having major variation in the predicted values wrt to any changes in the training data set.
Low variance ML algorithms : Logistic Regression, Linear Regression and Linear Discriminant Analysis
High variance ML algorithms : Decision Trees, Support Vector Machines and KNN
Example —
Let’s say if we consider red color as a feature then that will be a noise as many fruits have red color.
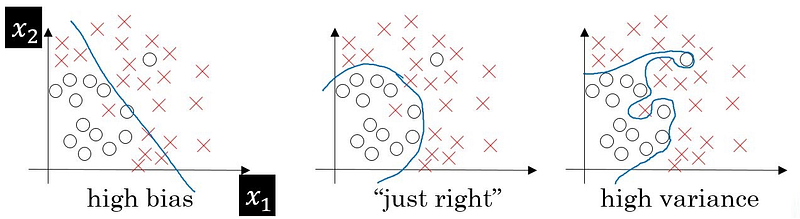
Bias vs Variance
- Non Linear algorithms have low bias but a high variance.
- Linear ML algorithms have high bias but low variance.
- Increasing the bias will reduce/decrease the variance.
- Increasing the variance will decrease the bias.
Training Error
It’s an error that occurs during model training and inappropriately handling the dataset during pre-processing.
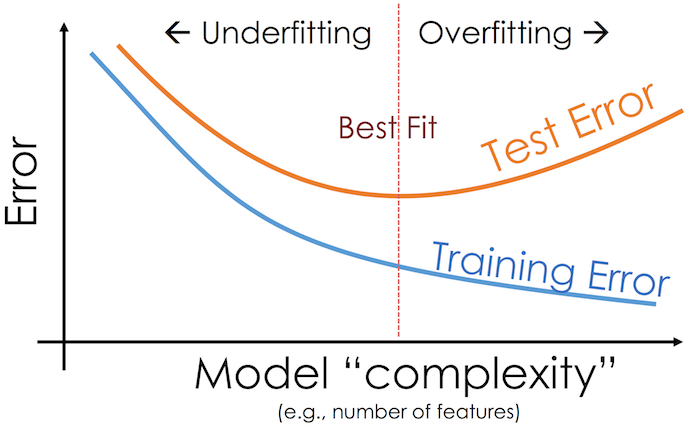
Test Error
It’s an error that occurs during model testing and more inclined towards overfitting or under fitting.
Under Fitting
Under fitting is about high training error and high test error.
Over Fitting
Overfitting is about low training error and high test error.
Errors
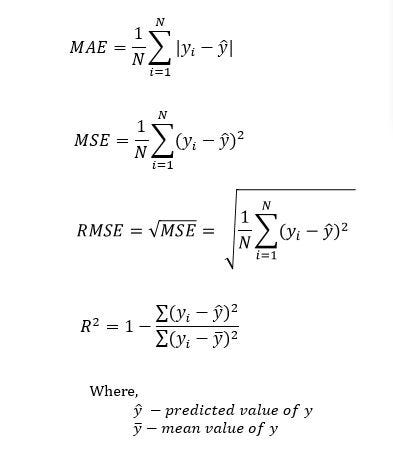
Mean Square Error
It is the mean of square of all errors.
Mean Absolute Error
It is the mean of all the absolute errors. It is less sensitive to the outliers as many small errors is aggregated to form one large error.
It is used with Regression Models.
Root Mean Squared Error
It is the error rate by the square root of Mean Square error between the predicted and actual values.
It is more sensitive to the outliers as compared to the MAE.
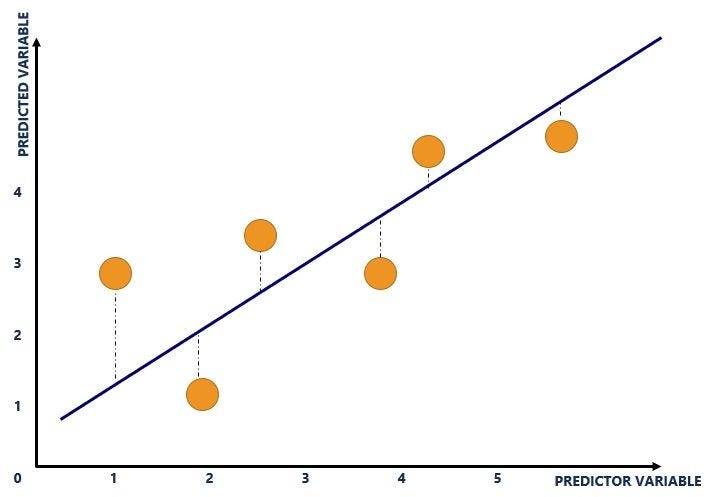
R-squared
It is used to represent the coefficient of how well the observations fit. It is the percentage of the dependent variable variation which is explained using linear model. It is always between 0 to 100%.
To summarize,
Variance with overfitting leads to high test error.
Bias with under fitting leads to high train and test error.
Let’s talk about each performance metrics and when to use—
Accuracy
What is Accuracy?
It’s the ratio of correctly predicted values to the total values.
It gives you the overall performance of the model.
Formula —
Accuracy = (TP+TN)/(TP+FP+FN+TN)
Precision
What is Precision?
It is the ratio of correctly predicted positive values to the total predicted positive observations.
It tells us how accurate the positive predictions are.
Formula —
Precision = TP/ (TP + FP)
Recall
What is Recall?
It is the ratio of correctly predicted positive values to all the values in the actual class which is yes.
It tell us the coverage of the actual positive samples.
Formula —
Recall = TP / (TP + FN)
F1 score
What is F1 Score?
It is the weighted average of recall and precision. This metric is more useful than accuracy in the case of uneven class distribution.
It is used to as a hybrid metric for the unbalanced classes.
Formula —
F1 Score = 2*(Recall * Precision) / (Recall + Precision)
Confusion Matrix
What is Confusion Matrix?
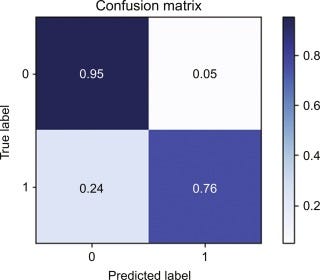
It defines the performance of the classification algorithm by summarizing and visualizing the data.
It analyzes the classifier’s potential.
Type I error
What is Type I error?
Type 1 error is a false positive result.
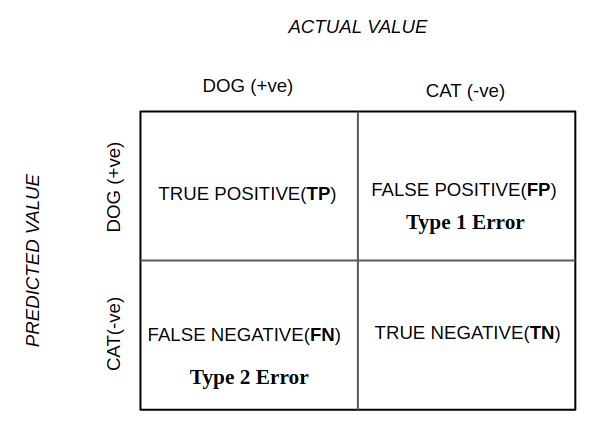
Type II error
What is Type II Error?
Type II error is a false negative result.
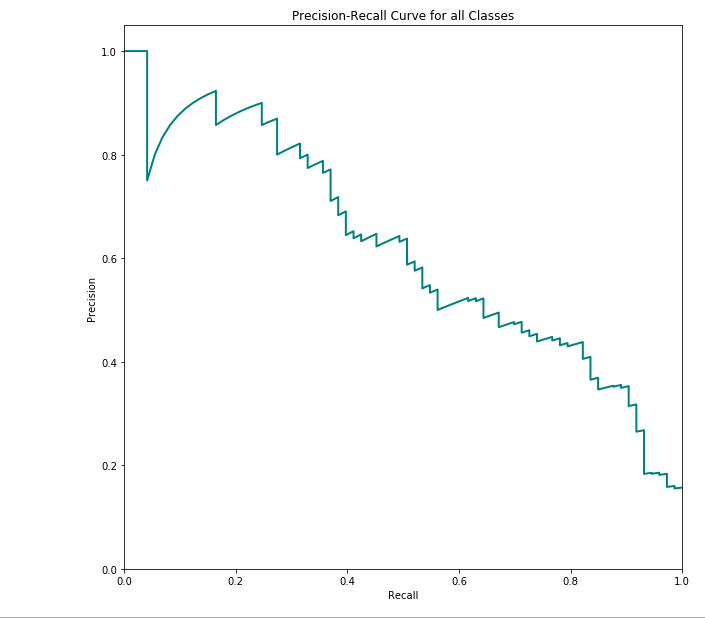
ROC Curve
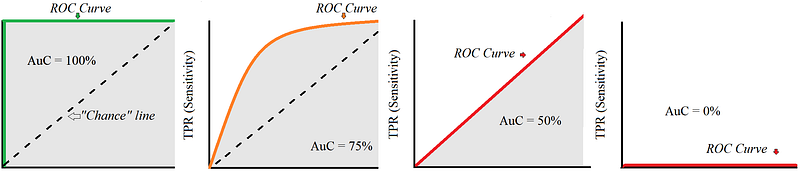
What is ROC Curve?
Receiver Operator Characteristics is an evaluation metric for the classification problems that are binary in nature.
It is used to assess the overall performance of the test results.
AUC score
What is AUC Score?
Area under the Curve calculates the area under the ROC. It measures how well the predictions are ordered and ranked.
To summarize —
- Confusion matrix: A confusion matrix is a table that is used to define the performance of a classification model. It compares the predicted values with the actual values and shows the number of correct and incorrect predictions for each class. The matrix is usually represented in the form of a table with rows representing the actual class and columns representing the predicted class.
- F1 Score: The F1 score is a measure of a model’s accuracy that takes both precision and recall into account. It is the harmonic mean of precision and recall, with a higher score indicating better performance.
- Recall: Recall is a measure of a model’s ability to correctly identify all relevant instances. It is calculated as the number of true positives divided by the number of true positives plus the number of false negatives.
- Precision: Precision is a measure of a model’s ability to correctly identify positive instances. It is calculated as the number of true positives divided by the number of true positives plus the number of false positives.
- Type I error: A Type I error, also known as a false positive, occurs when a model incorrectly classifies a negative instance as positive.
- Type II error: A Type II error, also known as a false negative, occurs when a model incorrectly classifies a positive instance as negative.
- Accuracy: Accuracy is a measure of a model’s overall performance, calculated as the number of correct predictions divided by the total number of predictions.
- ROC Curve: Receiver Operating Characteristic (ROC) curve is a graphical representation of the performance of a binary classifier system as the discrimination threshold is varied. It plots the true positive rate against the false positive rate.
- AUC Score: AUC stands for “Area Under the ROC Curve.” It is a measure of a model’s overall performance, with a higher AUC score indicating better performance.
Complete Code Implementation —
import numpy as np
import matplotlib.pyplot as plt
from sklearn.metrics import confusion_matrix, classification_report, roc_curve, roc_auc_score
from sklearn.model_selection import train_test_split
from sklearn.linear_model import LogisticRegression

# Generate a sample dataset
X = np.random.randn(1000, 10)  # Features
y = np.random.randint(0, 2, size=(1000,))  # Target variable (binary classification)

# Split the dataset into training and test sets
X_train, X_test, y_train, y_test = train_test_split(X, y, test_size=0.2, random_state=42)

# Train a logistic regression model
model = LogisticRegression()
model.fit(X_train, y_train)

# Make predictions on the test set
y_pred = model.predict(X_test)

# Calculate the confusion matrix
cm = confusion_matrix(y_test, y_pred)
print("Confusion Matrix:")
print(cm)

# Calculate the F1 Score, Recall, and Precision
f1_score = classification_report(y_test, y_pred)['1']['f1-score']
recall = classification_report(y_test, y_pred)['1']['recall']
precision = classification_report(y_test, y_pred)['1']['precision']
print("F1 Score:", f1_score)
print("Recall:", recall)
print("Precision:", precision)

# Calculate the Type I error and Type II error
tn, fp, fn, tp = cm.ravel()
type_i_error = fp / (fp + tn)
type_ii_error = fn / (fn + tp)
print("Type I Error:", type_i_error)
print("Type II Error:", type_ii_error)

# Calculate the Accuracy
accuracy = (tp + tn) / (tp + tn + fp + fn)
print("Accuracy:", accuracy)

# Calculate the ROC Curve and AUC Score
probs = model.predict_proba(X_test)[:, 1]
fpr, tpr, thresholds = roc_curve(y_test, probs)
auc = roc_auc_score(y_test, probs)

# Plot the ROC Curve
plt.plot(fpr, tpr, label='ROC Curve (AUC = {:.2f})'.format(auc))
plt.plot([0, 1], [0, 1], 'k--')
plt.xlabel('False Positive Rate')
plt.ylabel('True Positive Rate')
plt.title('Receiver Operating Characteristic (ROC) Curve')
plt.legend(loc='lower right')
plt.show()

print("AUC Score:", auc)
Which Metric to use and when?
- Use RMSE when you want to use more weights to the samples that are further from mean, other wise use MAE.
- For Regression problem use MSE, MAE, R squared and Adjusted R square.
- Use accuracy for classification problems which don’t have class imbalance.
- Use precision to confirm the prediction results.
- Use recall to get as many positives as possible.
- Use F1 score when you want good precision and recall on a model.
- For the classification problems, use accuracy, precision, recall, Log-Loss.
- Both ROC and AUC are used to evaluate the binary classification problems as well as multi class classification problems — to assess their performance.
That’s it for now. Day 28 coming soon: Advanced Regression.
Let me know if you have questions in the comment section below. Subscribe/ Follow, Like/Clap as it would encourage me to write more in my free time
Stay Tuned!!
Read More —
11 most important System Design Base Concepts
6. Networking, How Browsers work, Content Network Delivery ( CDN)
13. System Design Template — How to solve any System Design Question
System Design Case Studies — In Depth
Complete Data Structures and Algorithm Series
Some of the other best Series —
30 days of Data Structures and Algorithms and System Design Simplified
Data Science and Machine Learning Research ( papers) Simplified **
100 days : Your Data Science and Machine Learning Degree Series with projects
Complete Data Visualization and Pre-processing Series with projects
Exceptional Github Repos — Part 1
Exceptional Github Repos — Part 2
Tech Newsletter —
If you are interested, you can join my newsletter through which I send tech interview tips, techniques, patterns, hacks — Software Development, ML, Data Science, Startups and Technology projects to more than 30K readers. You can subscribe to Tech Brew :
For Python Projects —
For complete 60 days of Data Science and ML : Day 1 — Day 60 : Quick Recap of 60 days of Data Science and ML
Follow for more updates. Stay tuned and keep coding!
For other projects, tune to —
Build Machine Learning Pipelines( With Code)
Recurrent Neural Network with Keras
Clustering Geolocation Data in Python using DBSCAN and K-Means
Facial Expression Recognition using Keras
Hyperparameter Tuning with Keras Tuner
Custom Layers in Keras


