
Day 15 of 30 days of Data Analytics with Projects Series
Welcome back peeps. This is Day 15 of 30 days of data analytics.
What’s covered in 30 days of Data Analytics Series till now —
Day 1 : Data Analytics basics and kickstart of Data analytics with projects series
Day 3 : Data Analytics Ecosystem — Data Life Cycle, Data Analysis complete process ( most important things)
Day 5 : Statistics
Day 6 : Basic and Advanced SQL
Day 8 : Pandas and Numpy
Day 9 : Data Manipulation
Day 10 : Data Visualization — Part 1
Day 11 : Data Visualization — Part 2
Day 12 : Data Visualization — Part 3
Day 13: Tableau — Part 1
Day 14: Tableau — Part 2
Day 15: Tableau — Part 3
Take Complete Hands On Tableau Course : Link
Projects Videos —
All the projects, data structures, SQL, algorithms, system design, Data Science and ML , Data Analytics, Data Engineering, , Implemented Data Science and ML projects, Implemented Data Engineering Projects, Implemented Deep Learning Projects, Implemented Machine Learning Ops Projects, Implemented Time Series Analysis and Forecasting Projects, Implemented Applied Machine Learning Projects, Implemented Tensorflow and Keras Projects, Implemented PyTorch Projects, Implemented Scikit Learn Projects, Implemented Big Data Projects, Implemented Cloud Machine Learning Projects, Implemented Neural Networks Projects, Implemented OpenCV Projects,Complete ML Research Papers Summarized, Implemented Data Analytics projects, Implemented Data Visualization Projects, Implemented Data Mining Projects, Implemented Natural Leaning Processing Projects, MLOps and Deep Learning, Applied Machine Learning with Projects Series, PyTorch with Projects Series, Tensorflow and Keras with Projects Series, Scikit Learn Series with Projects, Time Series Analysis and Forecasting with Projects Series, ML System Design Case Studies Series videos will be published on our youtube channel ( just launched).
Subscribe today!
Tech Newsletter —
If you are interested, you can join my newsletter through which I send tech interview tips, techniques, patterns, hacks — Software Development, ML, Data Science, Startups and Technology projects to more than 30K readers. You can subscribe to Tech Brew :
In the last posts we covered Data Visualization and Tableau — Part 1 and Tableau — Part 2.
In this post we will cover Tableau — Part 3 as follows —
Tableau Basics
Create trend lines and understand the relevant statistical metrics such as p-value and R-squared
Create forecasts, Barcharts, Area Charts, Box and Whisker
Create Histogram, Bullet Chart, Bubbles Chart, Funnel Charts, Advanced Charts
Create Scatterplots , Piecharts, Treemaps
Create Maps — Detailed Maps, Symbol Maps, Density Maps
Create Advanced Maps
Create Interactive Dashboards
Create Storylines
Work with Data Blending in Tableau
Create Table Calculations
Create Dual Axis Charts
Create Calculated Fields
Create Visualizations using Calculated Fields
Tableau String Functions
Tableau Date Functions
Tableau Type Conversion
Tableau Reporting
Implement Aggregation, Granularity, and Level of Detail
Create and use Groups
Create and add Filters and Quick Filters
Create Reference Lines with Parameters
Implement Clustering
Implement Filters, including the context filter
Implement Grouping & Sets
Let’s get started with Tableau — Part 3.
Hierarchies
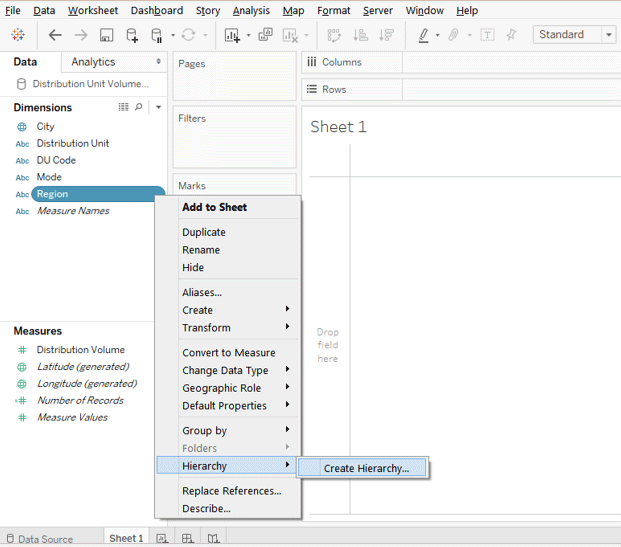
Tableau Hierarchy provides drill-down action to the Tableau report. Using Tableau Hierarchy we can navigate from a higher level to a nested level or lower level as hierarchies arrange data fields in a level
- You can create hierarchy, drill up and down and remove hierarchy
- By creating hierarchies in Tableau, we set our data on different levels of detail and organize it
Data Extracts
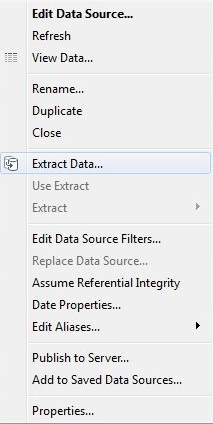
Data Extracts creates a subset of data from the data source i.e a local copy of portion of data gets saved in Tableau’s memory and it helps to optimize Tableau’s performance, speed and offers flexibility to handle large sets of data easily.
Advantages of Data Extracts —
Support large data sets
Help improve performance
Provide offline access to your data
Support additional functionality
Manipulate or modify the extract data
Data Blending
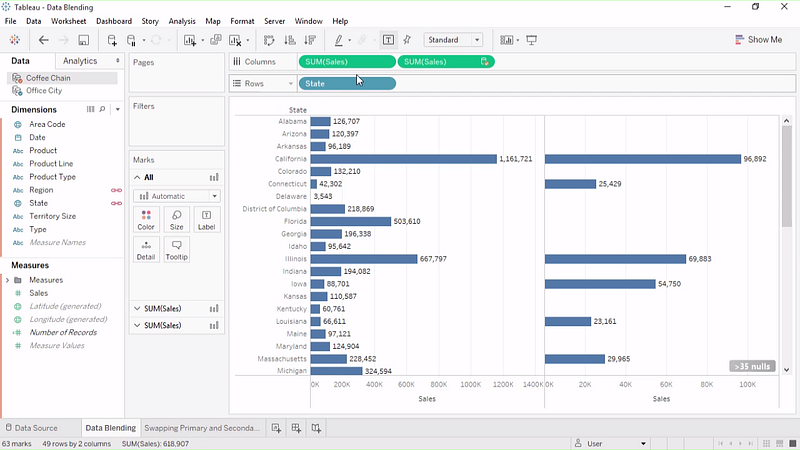
Data Blending is used when there is related data in multiple data sources, which you want to analyze together in a single view. Blends query each data source independently, the results are aggregated to the appropriate level, then the results are presented visually together in the view
- The two sources involved in data blending are referred as primary and secondary data source
- It is performed on a sheet-by-sheet basis and is established when a field from a second data source is used in the view
- Tableau uses linking field to know how to combine the data from multiple sources.
Filters and Quick Filters
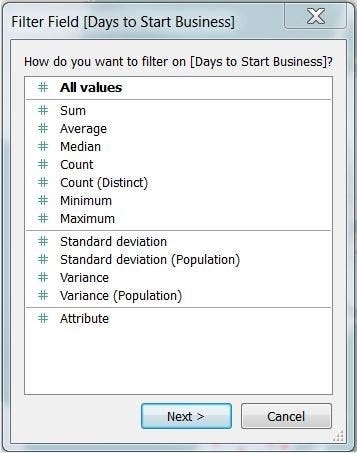
Filters are used to restrict the data as per the requirements as it allows you to select the individual data points or a group of data points
Basic Filters
Filter Dimensions : applied on the dimension fields.
Filter Measures : applied on the measure fields.
Filter Dates : applied on the date fields.
Quick Filters
Tableau provides filters that are quickly available using the right-click option on the dimension or measure
Context Filters
Improves performance
Creates a (second) dependent numerical
Tableau Custom Views
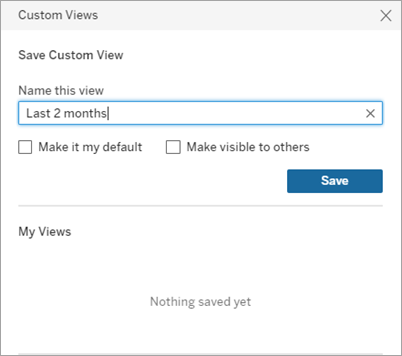
It’s a saved version of the view with your selections and filters applied. It lets you save your filters, sorts, or selections, without making changes to the underlying view
- You can also extend the normal data views with some additional features so that the view can give different types of charts
Take Complete Hands On Tableau Course : Link
That’s it for now. Day 16: Tableau — Part 4 coming soon.
Let me know if you have questions in the comment section below. Subscribe/ Follow, Like/Clap as it would encourage me to write more in my free time
Stay Tuned!!
Read More —
11 most important System Design Base Concepts
6. Networking, How Browsers work, Content Network Delivery ( CDN)
13. System Design Template — How to solve any System Design Question
System Design Case Studies — In Depth
Complete Data Structures and Algorithm Series
Some of the other best Series —
30 days of Data Structures and Algorithms and System Design Simplified
Data Science and Machine Learning Research ( papers) Simplified **
100 days : Your Data Science and Machine Learning Degree Series with projects
Complete Data Visualization and Pre-processing Series with projects
Exceptional Github Repos — Part 1
Exceptional Github Repos — Part 2
Tech Newsletter —
If you are interested, you can join my newsletter through which I send tech interview tips, techniques, patterns, hacks — Software Development, ML, Data Science, Startups and Technology projects to more than 30K readers. You can subscribe to Tech Brew :
For Python Projects —
For complete 60 days of Data Science and ML : Day 1 — Day 60 : Quick Recap of 60 days of Data Science and ML
Follow for more updates. Stay tuned and keep coding!
For other projects, tune to —
Build Machine Learning Pipelines( With Code)
Recurrent Neural Network with Keras
Clustering Geolocation Data in Python using DBSCAN and K-Means
Facial Expression Recognition using Keras
Hyperparameter Tuning with Keras Tuner
Custom Layers in Keras


