
Day 2 of 30 days of Data Analytics with Projects Series
Welcome back peeps. Weekend is going amazing! Happy to share that we have just finished —
Finished Series —
60 Days of Data Science and Machine Learning with projects Series
We are now starting a new series — 30 days of Data Analytics with Projects. This series would run in parallel with —
Ongoing Series —
What’s covered till now —
Day 1 : Data Analytics basics and kickstart of Data analytics with projects series
Day 3 : Data Analytics Ecosystem — Data Life Cycle, Data Analysis complete process ( most important things)
Business Understanding
Lets dive in!
- Data-Driven Decision Making: Data-driven decision making is a process of using data and analytics to inform and support decision-making. This process involves collecting, cleaning, and analyzing data, and using the insights gained to inform decisions and actions. Data-driven decision making is often used in business and organizations to improve performance, reduce costs, and increase revenue.
- Formulating solutions to business problems: To formulate solutions to business problems, one needs to start by identifying the problem and its root causes. This can be done by conducting research, interviewing stakeholders, and analyzing data. Once the problem is understood, potential solutions can be generated by brainstorming, using best practices, and consulting experts. The solutions should then be evaluated based on their feasibility, impact, and cost-benefit.
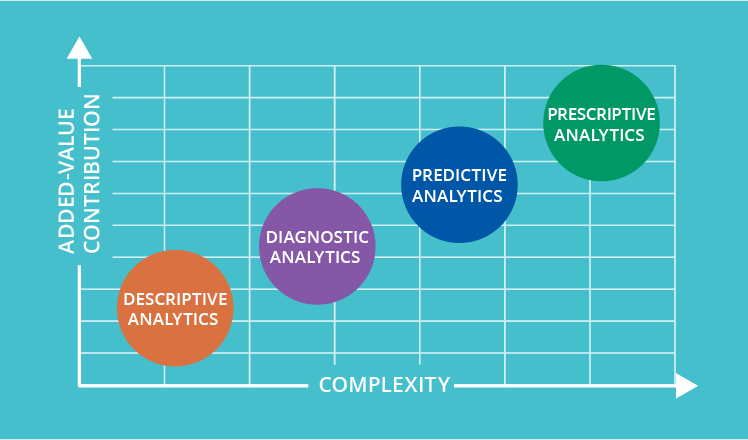
- Descriptive Analysis: Descriptive analysis is a method of summarizing and describing data using techniques such as frequency distributions, measures of central tendency, and measures of dispersion. It can be used to generate insights and understand patterns in the data. Descriptive analysis is the first step in data analysis, and it provides a basic understanding of the data.
- Predictive Analysis: Predictive analysis is a method of using statistical models to make predictions about future events or outcomes. It can be used to identify patterns and trends in data, and to make predictions about future behavior. Predictive analysis is used in a variety of applications, including marketing, finance, and healthcare.
- Diagnostic Analysis: Diagnostic analysis is a method of identifying the cause of an issue or problem. It can be used to troubleshoot and identify the root cause of a problem, and to determine the best course of action for resolving the issue. Diagnostic analysis is often used in manufacturing, healthcare, and IT.
- Prescriptive Analysis: Prescriptive analysis is a method of using data, analytics, and optimization techniques to generate actionable recommendations. It can be used to identify the best course of action for achieving specific goals or objectives. Prescriptive analysis is used in a variety of applications, including supply chain management, logistics, and finance.
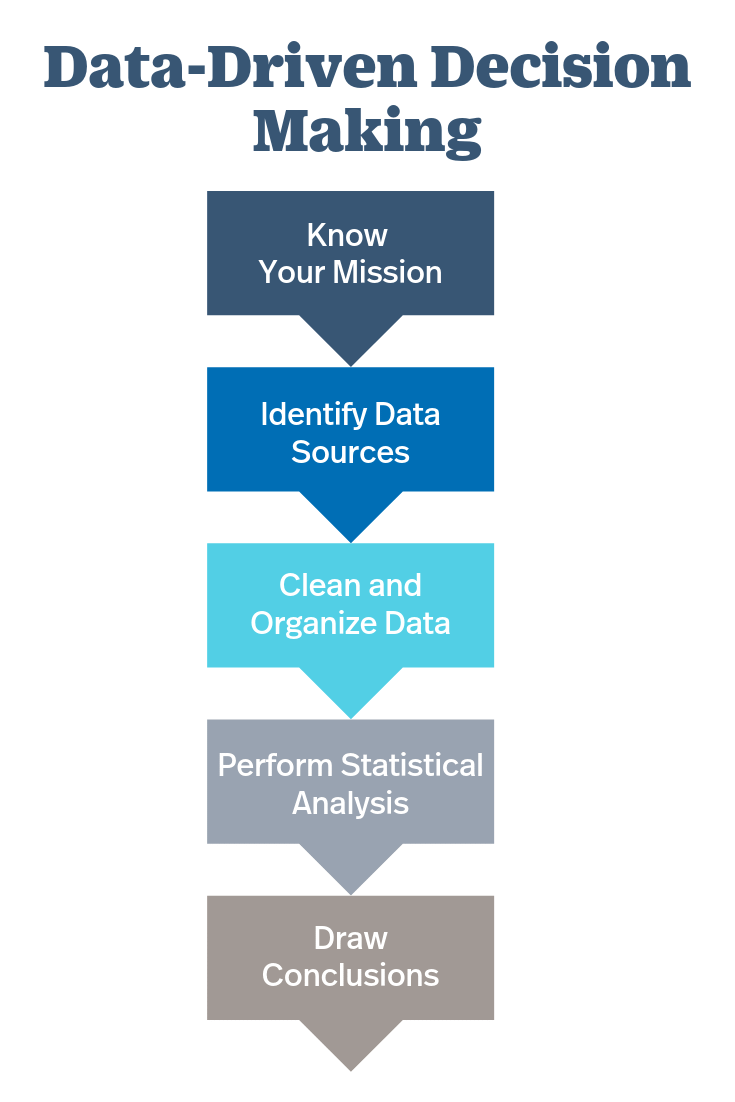
Data Driven Decision Making
It’s the process of using data and its insights, metrics to derive strategic business decisions that helps achieve the company objectives and goals.
It empowers different teams to make better business decisions with data.
Code Example for Data Driven Decision making —
import pandas as pd

# Load the dataset from a CSV file
data = pd.read_csv('customer_purchases.csv')

# Perform data analysis and derive insights
# For example, calculate total revenue per customer segment
revenue_by_segment = data.groupby('segment')['revenue'].sum()

# Make data-driven decisions based on the analysis
# For example, allocate marketing budget based on the revenue generated by each segment
marketing_budget = {
    'Segment A': 5000,
    'Segment B': 3000,
    'Segment C': 2000
}

# Print the marketing budget allocation
for segment, budget in marketing_budget.items():
    print(f"Allocate ${budget} to marketing campaign for {segment}")

# Monitor the performance of the marketing campaigns and iterate the decision-making process based on data-driven insights
In this series we will cover all the 6 steps of data analytics.
How to formulate solutions to business problems?
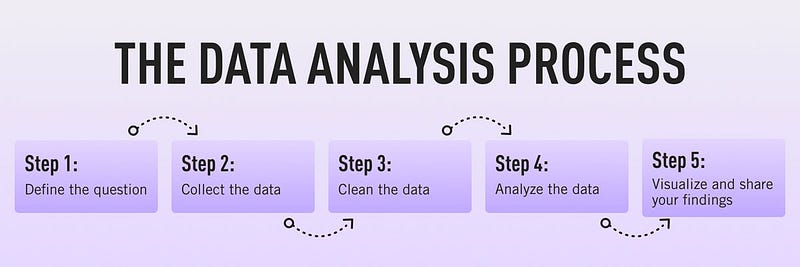
There are 6 steps to this —
Business Objectives — Identify the business goals, performance key performance indicators and metrics that influence the business decisions.
Get right data — Identify the sources of data and teams that are responsible for collecting that data.
Collect, clean and prepare the data — After collecting the raw data, clean and pre-process it for further steps.
Visualize and Explore the data — Use Matplotlib, seaborn, tableau to visualize and explore the data.
Build Insights and perform statistical analysis — Upon building the key insights and statistical analysis, gather all the key indicators and build a storyline/dashboard.
Take action from the gathered insights — Communicate the insights to key business people/shareholders.
Code Implementation for each stage —
- Get Right Data
# Example code for identifying data sources and teams

data_sources = {
    'Sales': 'sales_team',
    'Customer Feedback': 'customer_support_team',
    'Website Analytics': 'marketing_team',
    # Add more data sources and teams as needed
}

# Print data sources and teams responsible for collecting the data
for source, team in data_sources.items():
    print(f"Data source: {source} - Responsible team: {team}")
2. Collect Clean and prepare Data
# Example code for collecting, cleaning, and preparing the data

import pandas as pd

# Assuming data is collected from a CSV file
data_file = 'data.csv'

# Read the data into a pandas DataFrame
raw_data = pd.read_csv(data_file)

# Perform data cleaning and preprocessing steps
cleaned_data = raw_data.dropna()  # Remove rows with missing values
preprocessed_data = cleaned_data.apply(lambda x: x.strip() if isinstance(x, str) else x)  # Remove leading/trailing whitespace

# Print the cleaned and preprocessed data
print(preprocessed_data.head())
3. Visualize and explore the Data
# Example code for visualizing and exploring the data using Matplotlib

import matplotlib.pyplot as plt

# Assuming 'preprocessed_data' contains the cleaned and preprocessed data

# Example: Plot a histogram of a numerical variable
plt.hist(preprocessed_data['Sales'], bins=10)
plt.xlabel('Sales')
plt.ylabel('Frequency')
plt.title('Distribution of Sales')
plt.show()

# Example: Create a scatter plot of two numerical variables
plt.scatter(preprocessed_data['Sales'], preprocessed_data['Profit'])
plt.xlabel('Sales')
plt.ylabel('Profit')
plt.title('Sales vs. Profit')
plt.show()
4. Build insights and perform statistical analysis
# Example code for statistical analysis and building insights
# Assuming 'preprocessed_data' contains the cleaned and preprocessed data
# Example: Calculate mean and standard deviation of a numerical variable
sales_mean = preprocessed_data['Sales'].mean()
sales_std = preprocessed_data['Sales'].std()
# Example: Calculate correlation between two numerical variables
sales_profit_corr = preprocessed_data['Sales'].corr(preprocessed_data['Profit'])
# Print the calculated statistics
print(f"Mean Sales: {sales_mean}")
print(f"Standard Deviation of Sales: {sales_std}")
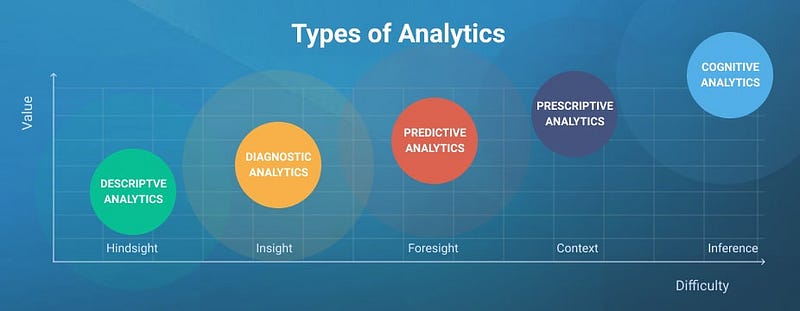
print(f"Correlation between Sales and Profit: {sales_profit_corr}")There are mainly 4 types of analysis you need to know —
Descriptive Analysis — To analyze the data features and summarize them to derive conclusions from the structure of the data. It aims to summarize and explore the structure of the data. In this example, we’ll calculate basic statistics like mean, standard deviation, minimum, and maximum values for each feature.
import pandas as pd

# Load the dataset from CSV
data = pd.read_csv('data.csv')

# Calculate basic statistics for each feature
statistics = data.describe()
print(statistics)
Predictive Analysis — To analyze the data and determine the future result or outcome or predictions.
from sklearn.linear_model import LinearRegression
from sklearn.model_selection import train_test_split
from sklearn.metrics import mean_squared_error

# Split the data into training and testing sets
X_train, X_test, y_train, y_test = train_test_split(data[['feature1', 'feature2', 'feature3']], data['target'], test_size=0.2, random_state=42)

# Train a linear regression model
model = LinearRegression()
model.fit(X_train, y_train)

# Make predictions on the test set
predictions = model.predict(X_test)

# Evaluate the model using mean squared error
mse = mean_squared_error(y_test, predictions)
print("Mean Squared Error:", mse)
Diagnostic Analysis — To analyze the data and identify problems that are shown by the data to optimize the performance and key metrics.
import matplotlib.pyplot as plt

# Scatter plot of target variable vs. feature1
plt.scatter(data['feature1'], data['target'])
plt.xlabel('feature1')
plt.ylabel('target')
plt.title('Scatter plot: feature1 vs. target')
plt.show()
Prescriptive Analysis — To use AI to make business decisions and combine the results of above 3 analysis to derive better insights and decisions.
# Get the most influential feature on the target variable (based on model coefficients)
most_influential_feature = model.coef_.argmax()
print("The most influential feature is:", data.columns[most_influential_feature])
That’s it for now. Day 3 -
Let me know if you have questions in the comment section below. Subscribe/ Follow, Like/Clap as it would encourage me to write more in my free time
Stay Tuned!!
Read More —
11 most important System Design Base Concepts
6. Networking, How Browsers work, Content Network Delivery ( CDN)
13. System Design Template — How to solve any System Design Question
System Design Case Studies — In Depth
Complete Data Structures and Algorithm Series
Some of the other best Series —
30 days of Data Structures and Algorithms and System Design Simplified
Data Science and Machine Learning Research ( papers) Simplified **
100 days : Your Data Science and Machine Learning Degree Series with projects
Complete Data Visualization and Pre-processing Series with projects
Exceptional Github Repos — Part 1
Exceptional Github Repos — Part 2
Tech Newsletter —
If you are interested, you can join my newsletter through which I send tech interview tips, techniques, patterns, hacks — Software Development, ML, Data Science, Startups and Technology projects to more than 30K readers. You can subscribe to Tech Brew :
For Python Projects —
For complete 60 days of Data Science and ML : Day 1 — Day 60 : Quick Recap of 60 days of Data Science and ML
Follow for more updates. Stay tuned and keep coding!
For other projects, tune to —
Build Machine Learning Pipelines( With Code)
Recurrent Neural Network with Keras
Clustering Geolocation Data in Python using DBSCAN and K-Means
Facial Expression Recognition using Keras
Hyperparameter Tuning with Keras Tuner
Custom Layers in Keras


