
Day 17 of 30 days of Data Engineering Series with Projects
Welcome back peeps to Day 17 of Data Engineering Series with Projects!
In this we will cover —
Data Augmentation
Read and Process Large Datasets
Pre-requisite to Day 17 is to complete Day 1–16( link below):
Day 3 : Complete Advanced Python for Data Engineering — Part 2
Projects Videos —
All the projects, data structures, SQL, algorithms, system design, Data Science and ML , Data Analytics, Data Engineering, , Implemented Data Science and ML projects, Implemented Data Engineering Projects, Implemented Deep Learning Projects, Implemented Machine Learning Ops Projects, Implemented Time Series Analysis and Forecasting Projects, Implemented Applied Machine Learning Projects, Implemented Tensorflow and Keras Projects, Implemented PyTorch Projects, Implemented Scikit Learn Projects, Implemented Big Data Projects, Implemented Cloud Machine Learning Projects, Implemented Neural Networks Projects, Implemented OpenCV Projects,Complete ML Research Papers Summarized, Implemented Data Analytics projects, Implemented Data Visualization Projects, Implemented Data Mining Projects, Implemented Natural Leaning Processing Projects, MLOps and Deep Learning, Applied Machine Learning with Projects Series, PyTorch with Projects Series, Tensorflow and Keras with Projects Series, Scikit Learn Series with Projects, Time Series Analysis and Forecasting with Projects Series, ML System Design Case Studies Series videos will be published on our youtube channel ( just launched).
Subscribe today!
Tech Newsletter —
If you are interested, you can join my newsletter through which I send tech interview tips, techniques, patterns, hacks — Software Development, ML, Data Science, Startups and Technology projects to more than 30K readers. You can subscribe to Ignito:
System Design Case Studies — In Depth
Design Instagram
Design Netflix
Design Reddit
Design Amazon
Design Messenger App
Design Twitter
Design URL Shortener
Design Dropbox
Design Youtube
Design API Rate Limiter
Design Web Crawler
Design Amazon Prime Video
Design Facebook’s Newsfeed
Design Yelp
Design Uber
Design Tinder
Design Tiktok
Design Whatsapp
Most Popular System Design Questions
Mega Compilation : Solved System Design Case studies
Let’s get started!
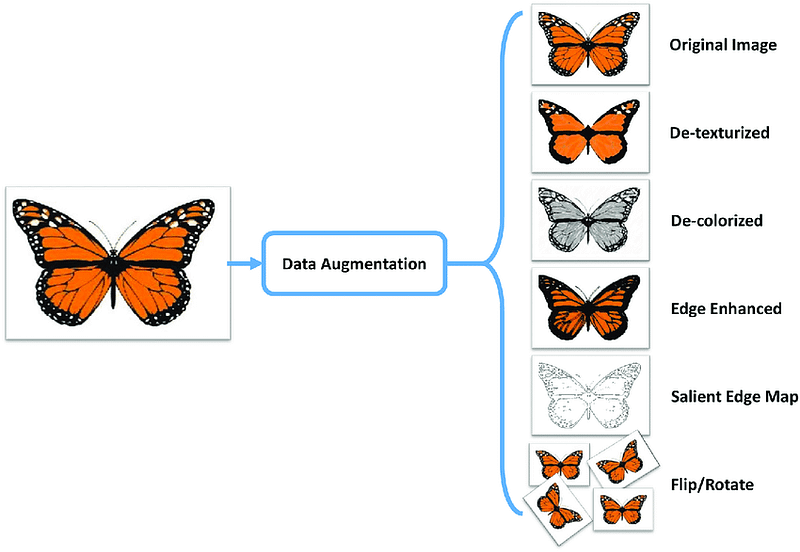
Data augmentation is a technique used to artificially increase the size of a dataset by applying various transformations to the existing data.
Some common data augmentation techniques include:
- Width and Height Shifts: This technique randomly shifts the position of an image horizontally and vertically within a specified range.
- Brightness: This technique adjusts the brightness of an image by a random factor within a specified range.
- Shear Transformation: This technique applies a random shear transformation to an image, which can change the angle of an object in the image.
- Zoom: This technique randomly zooms in or out on an image within a specified range.
- Channel Shift: This technique randomly changes the color channels of an image, such as shifting the value of the red channel by a random amount.
- Flips: This technique randomly flips an image horizontally or vertically.
When working with large datasets, it is important to have efficient ways of loading, processing, and managing the data. Some common techniques include:
- Load data: You can use libraries like Pandas or NumPy to load large datasets into memory and store them in a DataFrame or an array.
- Aggregation: You can use libraries like Pandas or NumPy to group data by certain columns and calculate aggregate statistics such as mean, median, or count.
- Filtering: You can use libraries like Pandas or NumPy to filter data by certain conditions and select only the rows that meet those conditions.
- Evaluating expressions: You can use libraries like Pandas or NumPy to evaluate expressions on the data and create new columns or update existing columns.
- Selection: You can use libraries like Pandas or NumPy to select specific columns or rows from the data for further processing.
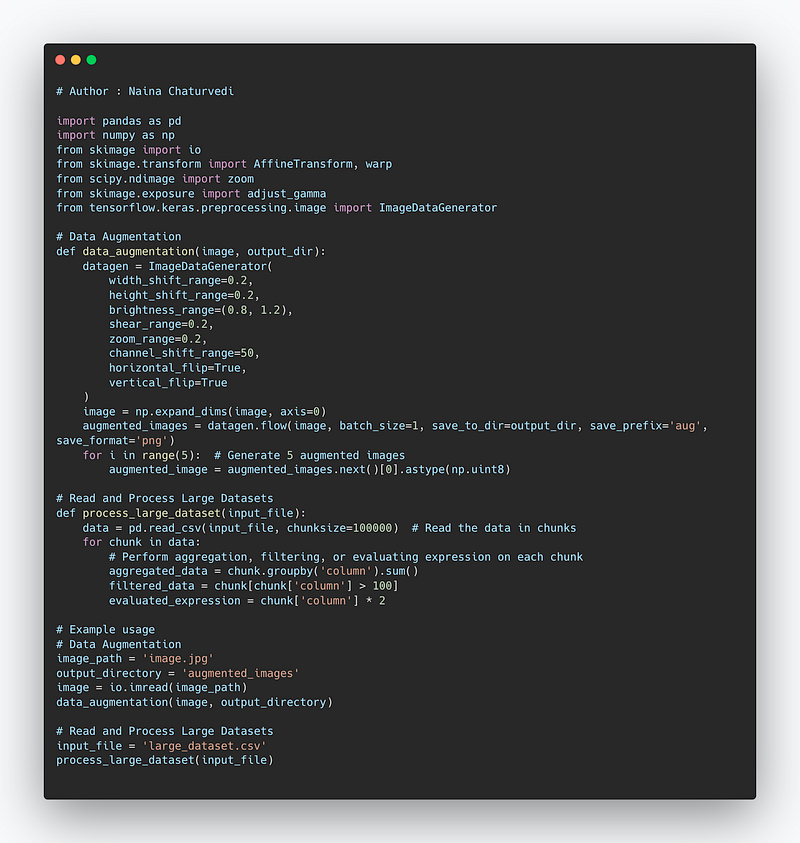
Complete code —
import pandas as pd
import numpy as np
from skimage import io
from skimage.transform import AffineTransform, warp
from scipy.ndimage import zoom
from skimage.exposure import adjust_gamma
from tensorflow.keras.preprocessing.image import ImageDataGenerator

# Data Augmentation
def data_augmentation(image, output_dir):
    datagen = ImageDataGenerator(
        width_shift_range=0.2,
        height_shift_range=0.2,
        brightness_range=(0.8, 1.2),
        shear_range=0.2,
        zoom_range=0.2,
        channel_shift_range=50,
        horizontal_flip=True,
        vertical_flip=True
    )
    image = np.expand_dims(image, axis=0)
    augmented_images = datagen.flow(image, batch_size=1, save_to_dir=output_dir, save_prefix='aug', save_format='png')
    for i in range(5):  # Generate 5 augmented images
        augmented_image = augmented_images.next()[0].astype(np.uint8)

# Read and Process Large Datasets
def process_large_dataset(input_file):
    data = pd.read_csv(input_file, chunksize=100000)  # Read the data in chunks
    for chunk in data:
        # Perform aggregation, filtering, or evaluating expression on each chunk
        aggregated_data = chunk.groupby('column').sum()
        filtered_data = chunk[chunk['column'] > 100]
        evaluated_expression = chunk['column'] * 2

# Example usage
# Data Augmentation
image_path = 'image.jpg'
output_directory = 'augmented_images'
image = io.imread(image_path)
data_augmentation(image, output_directory)

# Read and Process Large Datasets
input_file = 'large_dataset.csv'
process_large_dataset(input_file)
Snippet —
Data augmentation
It’s the technique of increasing the amount and diversity of your training set by applying random transformations.
Width and Height Shifts —
generator = tf.keras.preprocessing.image.ImageDataGenerator(

    width_shift_range=[-90,-40,0,40,90],
    height_shift_range=[-40,0,40]
)
x, y = next(generator.flow_from_directory('images', batch_size=1))
plt.imshow(x[0].astype('uint8'));
Brightness —
generator = tf.keras.preprocessing.image.ImageDataGenerator(

    brightness_range=(0.8,4.2)
)
x, y = next(generator.flow_from_directory('images', batch_size=1))
plt.imshow(x[0].astype('uint8'));Shear Transformation —
generator = tf.keras.preprocessing.image.ImageDataGenerator(

    shear_range=46
)
x, y = next(generator.flow_from_directory('images', batch_size=1))
plt.imshow(x[0].astype('uint8'));Zoom —
generator = tf.keras.preprocessing.image.ImageDataGenerator(

    zoom_range=[0.2,3.0]
)
x, y = next(generator.flow_from_directory('images', batch_size=1))
plt.imshow(x[0].astype('uint8'));Channel Shift —
generator = tf.keras.preprocessing.image.ImageDataGenerator(

    channel_shift_range=180
)
x, y = next(generator.flow_from_directory('images', batch_size=1))
plt.imshow(x[0].astype('uint8'));Flips —
generator = tf.keras.preprocessing.image.ImageDataGenerator(

    horizontal_flip=True,
    vertical_flip=True
)
x, y = next(generator.flow_from_directory('images', batch_size=1))
plt.imshow(x[0].astype('uint8'));Read and Process Large Datasets
Vaex is a high-performance open source python library for lazy out-of-core dataframes which lets you perform the visualization, exploration, analysis, ML on tabular datasets using techniques such as efficient out-of-core algorithms, memory mapping and lazy evaluations. One can go over a billion rows and perform different statistical functions, aggregations and build impressive plots within few seconds.
Vaex does not read any data when you open a memory mapped file, instead it only reads the file metadata, such as number of rows, number of columns, column names, data types, file structure, location of the data on the disk, file description etc. It goes through the entire dataset only when its required to do so with just few passes over the dataset.
Why to use Vaex :
- Memory efficient: It doesn’t create any memory copy while filtering/selections operations
- Lazy / Virtual columns: Without wasting the RAM, Vaex computes on the fly
- Performance: Vaex is used to process huge tabular data i.e it processes >¹⁰⁹ rows/second
- Visualization : Using Vaex data visualization can be done with just one-line of code.
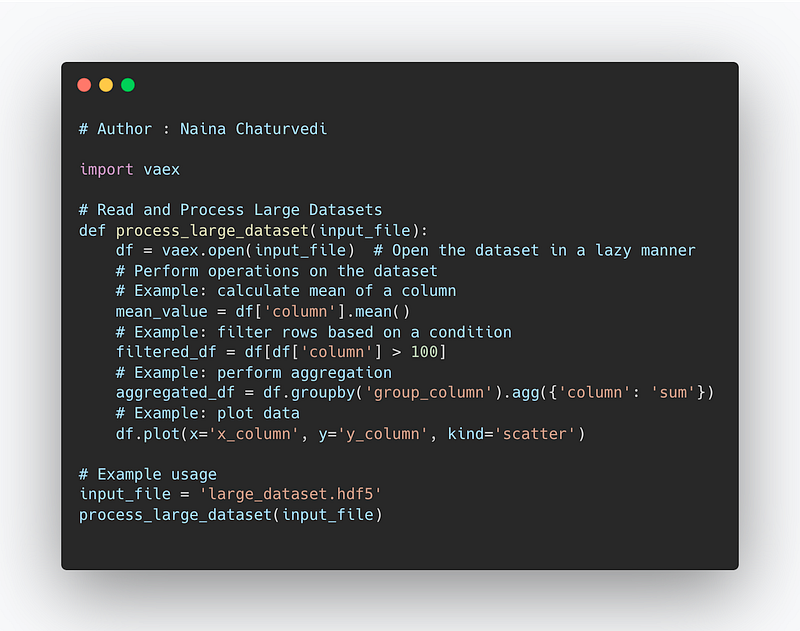
Complete Code —
import vaex

# Read and Process Large Datasets
def process_large_dataset(input_file):
    df = vaex.open(input_file)  # Open the dataset in a lazy manner
    # Perform operations on the dataset
    # Example: calculate mean of a column
    mean_value = df['column'].mean()
    # Example: filter rows based on a condition
    filtered_df = df[df['column'] > 100]
    # Example: perform aggregation
    aggregated_df = df.groupby('group_column').agg({'column': 'sum'})
    # Example: plot data
    df.plot(x='x_column', y='y_column', kind='scatter')

# Example usage
input_file = 'large_dataset.hdf5'
process_large_dataset(input_file)
Snippet —
We will see Vaex in action now.
1. If you haven’t installed Vaex then use below command to install it
pip install vaex
2. Once done, restart your kernal. Next import all the necessary libraries —
import vaex
import pandas as pd
3. Load data using Vaex
We will using dataset — Chicago Taxi Trips
df=vaex.open('/your_file_path/chicago_taxi_trips_2016_01.csv')Output — the data gets loaded in total 5.79 s
4. See the loaded data and stats
%%time
df
Output —
CPU times: user 3 µs, sys: 0 ns, total: 3 µs
Wall time: 7.63 µs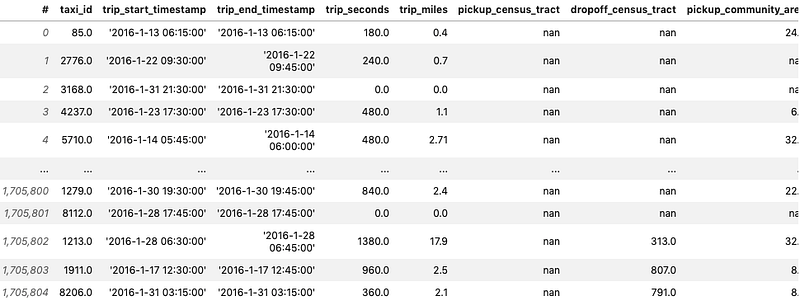
type(df)Output —
vaex.dataframe.DataFrameLocal# Get a high level overview of the DataFrame%%time
df.describe()This is done with a single pass over the data
Output —
CPU times: user 1.83 s, sys: 37.8 ms, total: 1.87 s
Wall time: 970 ms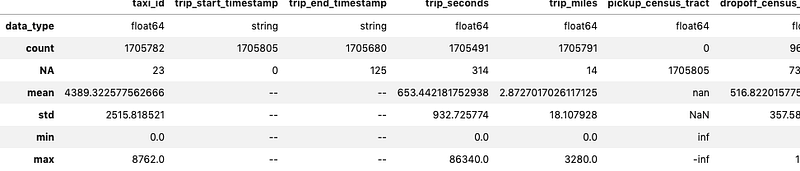
%%time
df.info()
Output —
CPU times: user 15 ms, sys: 4.9 ms, total: 19.9 ms
Wall time: 18.2 ms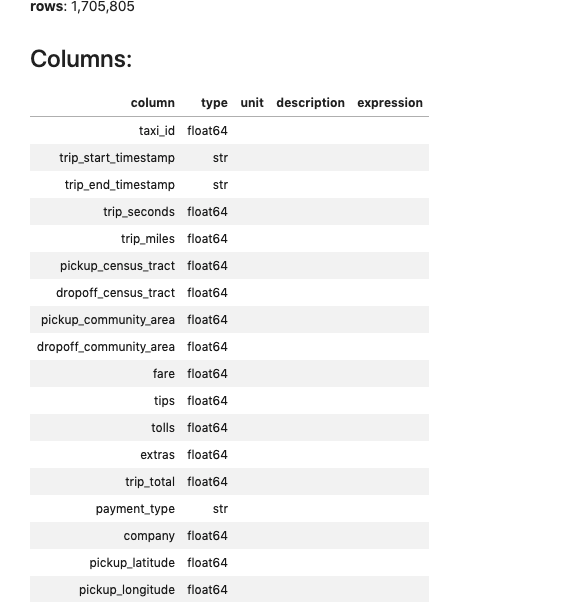
%%time
df['payment_type'].value_counts()
Output —
CPU times: user 264 ms, sys: 8.24 ms, total: 272 ms
Wall time: 163 ms
Cash 912334
Credit Card 781271
No Charge 7555
Unknown 3139
Dispute 845
Pcard 437
Prcard 224
dtype: int645. Aggregation, Filtering, evaluating expression and selection
Vaex performs parallelized, highly performant groupby operations
%%time
df_group=df.groupby(df.payment_type,agg='count')
df_group
Output —
total: 542 ms
Wall time: 330 ms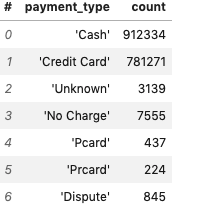
In Vaex, filtering, evaluating expressions and selection will not waste memory by making copies.
%%timeit
df[df.fare>100]
Output —
1.47 ms ± 70.2 µs per loop (mean ± std. dev. of 7 runs, 100 loops each)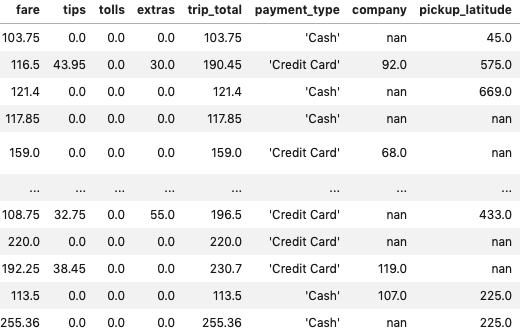
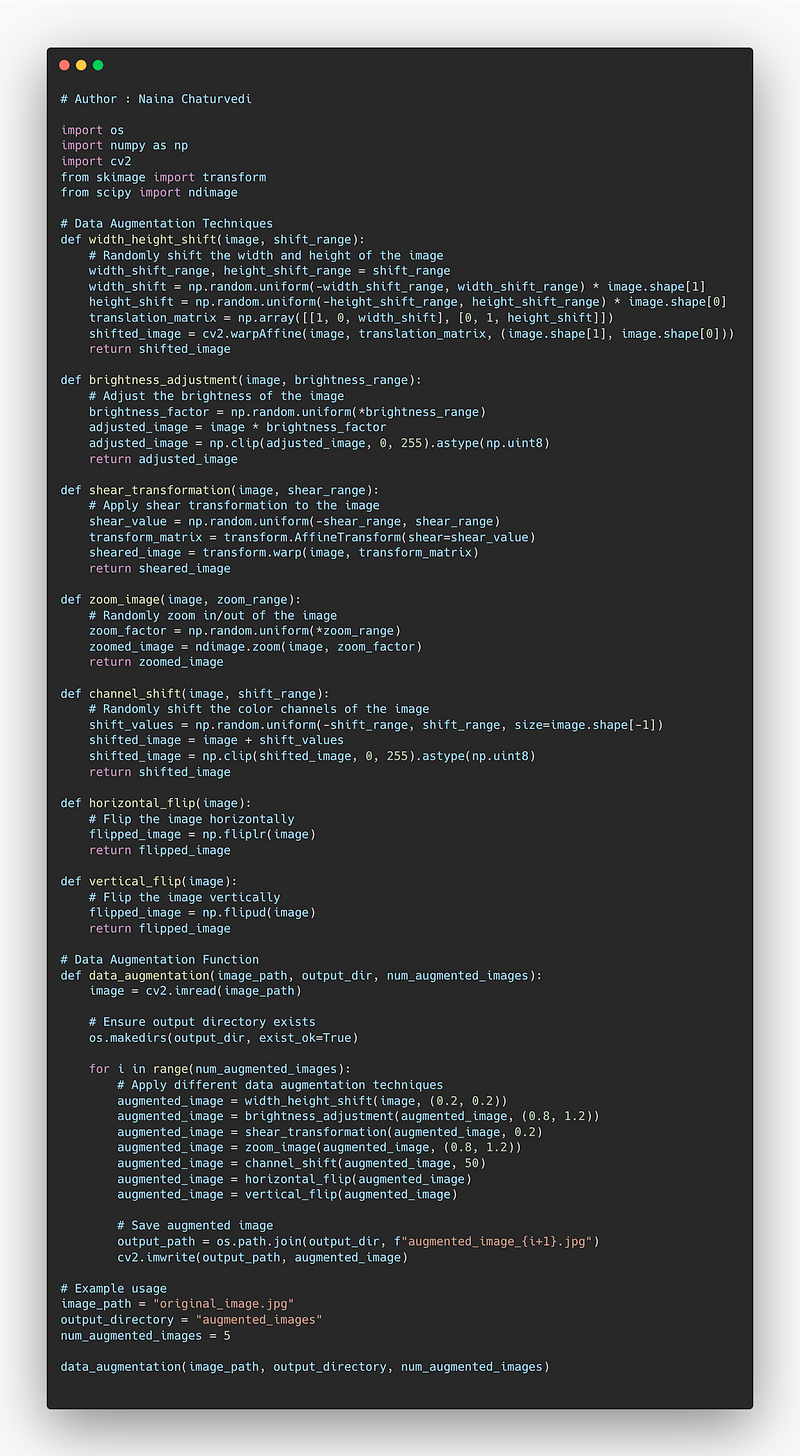
Complete Code Implementation —
import os
import numpy as np
import cv2
from skimage import transform
from scipy import ndimage

# Data Augmentation Techniques
def width_height_shift(image, shift_range):
    # Randomly shift the width and height of the image
    width_shift_range, height_shift_range = shift_range
    width_shift = np.random.uniform(-width_shift_range, width_shift_range) * image.shape[1]
    height_shift = np.random.uniform(-height_shift_range, height_shift_range) * image.shape[0]
    translation_matrix = np.array([[1, 0, width_shift], [0, 1, height_shift]])
    shifted_image = cv2.warpAffine(image, translation_matrix, (image.shape[1], image.shape[0]))
    return shifted_image

def brightness_adjustment(image, brightness_range):
    # Adjust the brightness of the image
    brightness_factor = np.random.uniform(*brightness_range)
    adjusted_image = image * brightness_factor
    adjusted_image = np.clip(adjusted_image, 0, 255).astype(np.uint8)
    return adjusted_image

def shear_transformation(image, shear_range):
    # Apply shear transformation to the image
    shear_value = np.random.uniform(-shear_range, shear_range)
    transform_matrix = transform.AffineTransform(shear=shear_value)
    sheared_image = transform.warp(image, transform_matrix)
    return sheared_image

def zoom_image(image, zoom_range):
    # Randomly zoom in/out of the image
    zoom_factor = np.random.uniform(*zoom_range)
    zoomed_image = ndimage.zoom(image, zoom_factor)
    return zoomed_image

def channel_shift(image, shift_range):
    # Randomly shift the color channels of the image
    shift_values = np.random.uniform(-shift_range, shift_range, size=image.shape[-1])
    shifted_image = image + shift_values
    shifted_image = np.clip(shifted_image, 0, 255).astype(np.uint8)
    return shifted_image

def horizontal_flip(image):
    # Flip the image horizontally
    flipped_image = np.fliplr(image)
    return flipped_image

def vertical_flip(image):
    # Flip the image vertically
    flipped_image = np.flipud(image)
    return flipped_image

# Data Augmentation Function
def data_augmentation(image_path, output_dir, num_augmented_images):
    image = cv2.imread(image_path)

    # Ensure output directory exists
    os.makedirs(output_dir, exist_ok=True)

    for i in range(num_augmented_images):
        # Apply different data augmentation techniques
        augmented_image = width_height_shift(image, (0.2, 0.2))
        augmented_image = brightness_adjustment(augmented_image, (0.8, 1.2))
        augmented_image = shear_transformation(augmented_image, 0.2)
        augmented_image = zoom_image(augmented_image, (0.8, 1.2))
        augmented_image = channel_shift(augmented_image, 50)
        augmented_image = horizontal_flip(augmented_image)
        augmented_image = vertical_flip(augmented_image)

        # Save augmented image
        output_path = os.path.join(output_dir, f"augmented_image_{i+1}.jpg")
        cv2.imwrite(output_path, augmented_image)

# Example usage
image_path = "original_image.jpg"
output_directory = "augmented_images"
num_augmented_images = 5

data_augmentation(image_path, output_directory, num_augmented_images)
Snippet —
That’s it for now.
Find Day 18 Below —
Let me know if you have questions in the comment section below. Subscribe/ Follow, Like/Clap as it would encourage me to write more in my free time
Stay Tuned!!
Read more —
All the Complete System Design Series Parts —
6. Networking, How Browsers work, Content Network Delivery ( CDN)
Github —
Keep learning and coding ;)
Day 5 coming soon!
For Python Projects —
For complete 60 days of Data Science and ML : Day 1 — Day 60 : Quick Recap of 60 days of Data Science and ML
Follow for more updates. Stay tuned and keep coding! Disclosure: Some of the links are affiliates.
For other projects, tune to —
Build Machine Learning Pipelines( With Code)
Recurrent Neural Network with Keras
Clustering Geolocation Data in Python using DBSCAN and K-Means
Facial Expression Recognition using Keras
Hyperparameter Tuning with Keras Tuner
Custom Layers in Keras


