
5 Cool Advanced Pandas Techniques for Data Scientists
Use these techniques …

Before you start implementing these techniques, load the data of your choice in your working environment. For this post, I’m using Iris data.
Start with importing the necessary libraries such as Pandas and Numpy and loading your data set. Once done, dive in the techniques below —
1. Split data using pandas
In the code below, we are splitting the data into a random sample of rows and removing them from the original data after dropping index values.
iris_data_new= df.copy()
df1=iris_data_new.sample(frac=0.75,random_state=0)
iris_data_new=iris_data_new.drop(df1.index)df2=iris_data_new.sample(frac=0.25,random_state=0)
iris_data_new=iris_data_new.drop(df2.index)print(df1.shape)Output —
(112, 5)Some of the other best Series —
Data Science and Machine Learning Research ( papers) Simplified **
100 days : Your Data Science and Machine Learning Degree Series with projects
Complete Data Visualization and Pre-processing Series with projects
Exceptional Github Repos — Part 1
Exceptional Github Repos — Part 2
Tech Newsletter —
If you are interested, you can join my newsletter through which I send tech interview tips, techniques, patterns, hacks — Software Development, ML, Data Science, Startups and Technology projects to more than 30K readers. You can subscribe to Tech Brew :
Github —
2. Binning Data
Binning is a technique to group/bin your data into multiple buckets which is very helpful if you dealing with continuous numeric data. In pandas you can bin the data using functions cut and cut. First check the shape of your data i.e no of rows and columns.
print(iris_data.shape)Output —
(150, 5)Then bin your data using qcut as shown below —
pd.qcut(df['sepal_width'],q=5).value_counts()Output —
(2.7, 3.0]      50
(1.999, 2.7]    33
(3.1, 3.4]      31
(3.4, 4.4]      24
(3.0, 3.1]      12
Name: sepal_width, dtype: int64Projects Videos —
All the projects, data structures, SQL, algorithms, system design, Data Science and ML , Data Analytics, Data Engineering, , Implemented Data Science and ML projects, Implemented Data Engineering Projects, Implemented Deep Learning Projects, Implemented Machine Learning Ops Projects, Implemented Time Series Analysis and Forecasting Projects, Implemented Applied Machine Learning Projects, Implemented Tensorflow and Keras Projects, Implemented PyTorch Projects, Implemented Scikit Learn Projects, Implemented Big Data Projects, Implemented Cloud Machine Learning Projects, Implemented Neural Networks Projects, Implemented OpenCV Projects,Complete ML Research Papers Summarized, Implemented Data Analytics projects, Implemented Data Visualization Projects, Implemented Data Mining Projects, Implemented Natural Leaning Processing Projects, MLOps and Deep Learning, Applied Machine Learning with Projects Series, PyTorch with Projects Series, Tensorflow and Keras with Projects Series, Scikit Learn Series with Projects, Time Series Analysis and Forecasting with Projects Series, ML System Design Case Studies Series videos will be published on our youtube channel ( just launched).
Subscribe today!
3. Slicing using loc and iloc functions
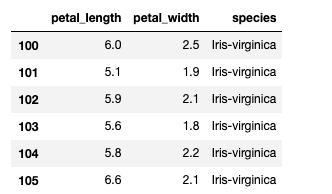
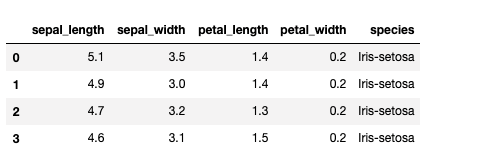
You can do position based and label based slicing using iloc and loc functions respectively.
iris_data.loc[100:105, 'petal_length':'species']Output —
iris_data.iloc[:4]Output —
4. Mean Imputation and Interpolate method
Mean Imputation is a technique in which the missing value is replaced by the mean of available data in the chosen column.
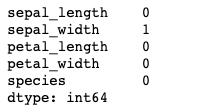
First see if your data has missing values or not.
iris_data.isnull().sum()Output —
Then calculate the mean and replace the missing value —
iris_data['sepal_width'].mean()Output —
3.0516778523489942Replace the missing value
iris_data['sepal_width'].fillna(iris_data['sepal_width'].mean(), inplace=True)
iris_data.isnull().sum()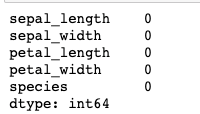
Interpolate method —
iris_data['sepal_width'].fillna(iris_data['sepal_width'].interpolate(), inplace=True)5. Combining Data using Concat and Join
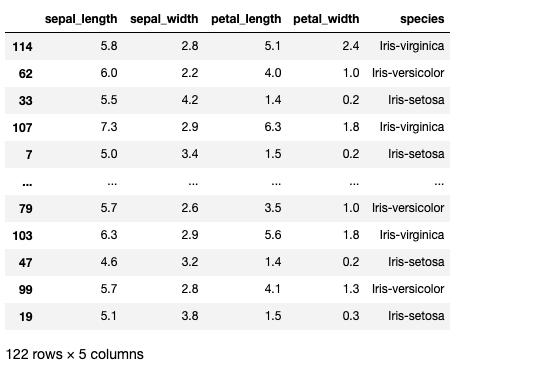
Just like in numpy, pd.concat() function is used for concatenation of Series or DataFrame objects in pandas.
df4=pd.concat([df1,df2],axis=0)print(df4)Output —
Joins —
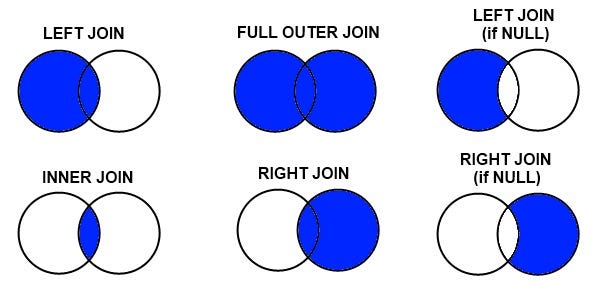
Merging and joining the data is one of the most important skill in the data science. Understanding and Implementing it right is crucial in order to analyze data well.
In this we will implement —
- Inner Join : keep rows from both the tables/data frames based on the specified merge condition.
- Full Join : keep all the rows form left table and right table with matched rows wherever possible and NaN’s elsewhere.
- Left Join : keep all the rows form left table and wherever there are missing values in the right table, put it as NaN’s, based on the specified merge condition.
- Right Join : keep all the rows form right table and wherever there are missing values in the left table, put it as NaN’s, based on the specified merge condition.
#Inner Join
df5=pd.merge(df1,df2,on='sepal_length')
print(df5)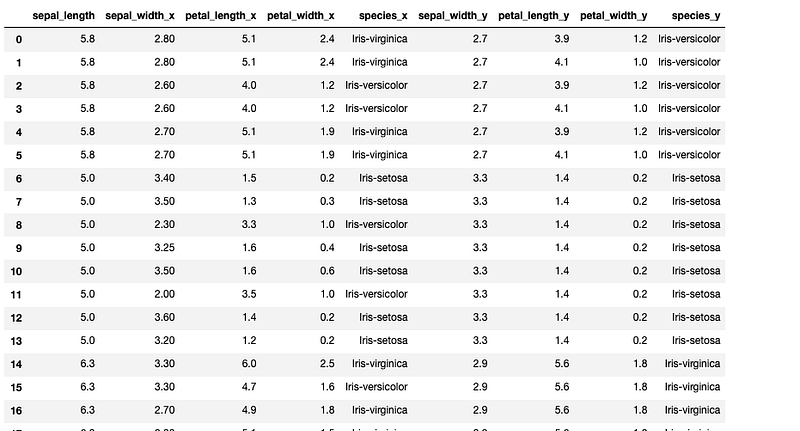
#Full outer join
df6=pd.merge(df1,df2,how='outer')
print(df6)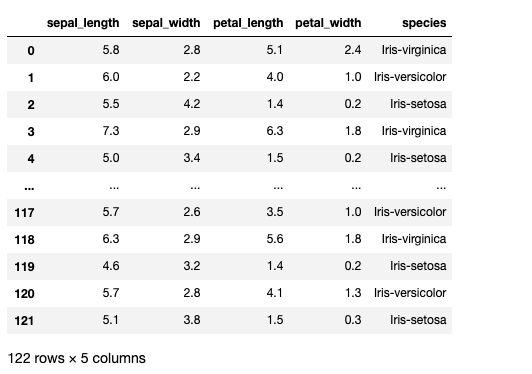
#Left Join
df7=pd.merge(df1,df2,how='left')
print(df7)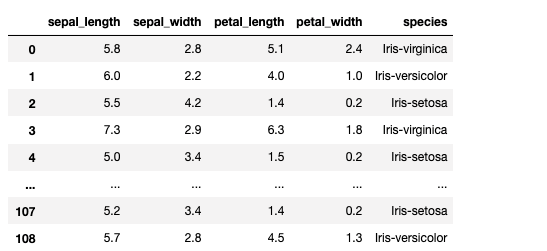
#Right Join
df8=pd.merge(df1,df2,how='right')
print(df8)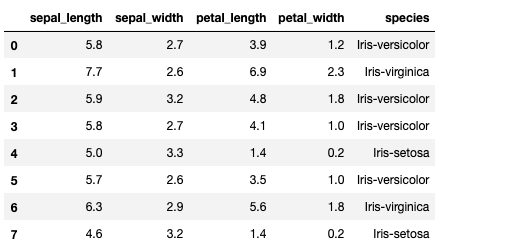
All the Complete System Design Series Parts —
6. Networking, How Browsers work, Content Network Delivery ( CDN)


