Seaborn Python Review
Reviewing theses Plotting & Statistics Packs — #PySeries#Episode 20
Seaborn is a library that uses Matplotlib underneath to plot graphs. It will be used to visualize random distributions.
Answer these eight questions:)
Visualization Exercise
The Data
This classic dataset contains the prices and other attributes of almost 54,000 diamonds. It’s a great dataset for beginners learning to work with data analysis and visualization.
https://www.kaggle.com/shivam2503/diamonds
Google Drive:
Source: Diamond.csv
Content:price price in US dollars ($326 — $18,823)
carat weight of the diamond (0.2–5.01)
cut quality of the cut (Fair, Good, Very Good, Premium, Ideal)
color diamond colour, from J (worst) to D (best)
clarity a measurement of how clear the diamond is (I1 (worst), SI2, SI1, VS2, VS1, VVS2, VVS1, IF (best))
x length in mm (0–10.74)
y width in mm (0–58.9)
z depth in mm (0–31.8)
depth total depth percentage = z / mean(x, y) = 2 * z / (x + y) (43–79)
table width of top of diamond relative to widest point (43–95)
Follow the instructions to recreate the plots using this data:01#PyEx — Python — MatlilPlot & Seaborn —Importing MatlibPlot:
Import pandas, matplotlib.pyplot and seaborn02#PyEx — Python — MatlilPlot & Seaborn— Plotting Graphs:
Read in the data set diamonds.csv03#PyEx — Python — MatlilPlot & Seaborn — Plotting Graphs :
Create a scatterplot of price versus carat as shown below: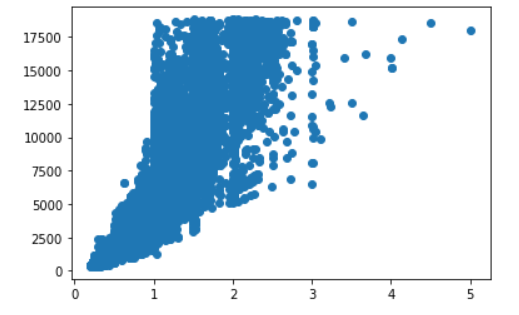
04#PyEx — Python — MatlilPlot & Seaborn — Plotting Graphs:
Make the previous plot larger with figure size (10, 8):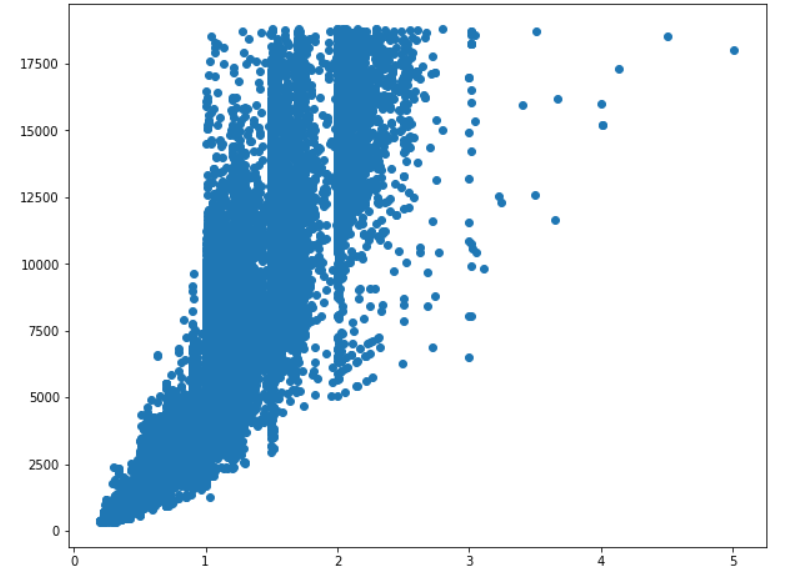
05#PyEx — Python — MatlilPlot & Seaborn — Plotting Graphs :
`Create a histogram of the price column with displot as shown below. Observe the x-axis limits. Also, set bins=50 and height=8: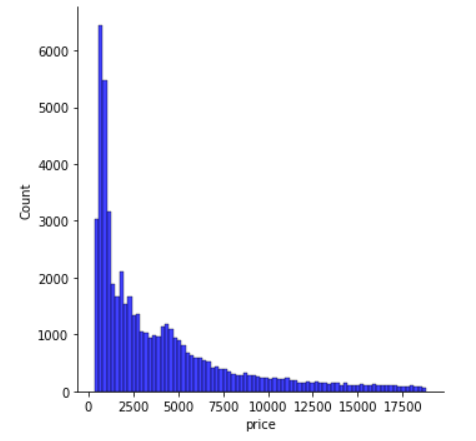
06#PyEx — Python — MatlilPlot & Seaborn —Plotting Graphs :
Create a count plot of the instances per cut type as shown below: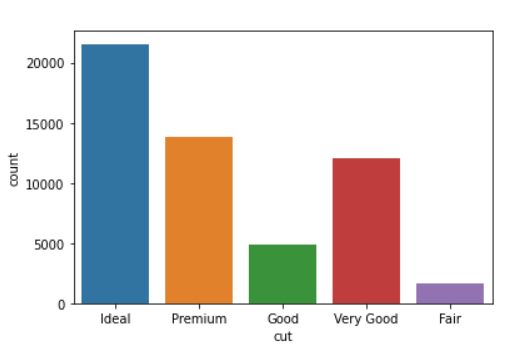
07#PyEx — Python — MatlilPlot & Seaborn —Plotting Graphs :
7. Create a large box plot figure showing the price distribution per cut type as shown below. Set (10, 8) as figure size.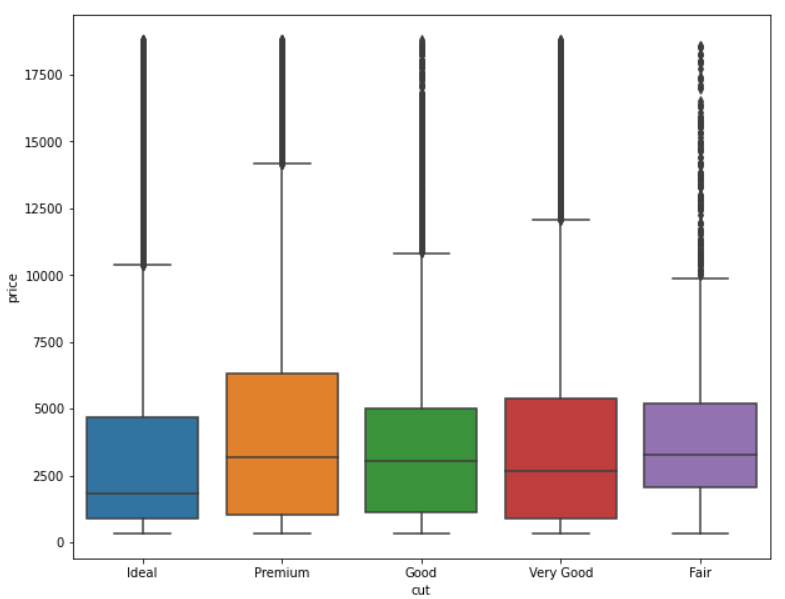
08#PyEx — Python — MatlilPlot & Seaborn —Plotting Graphs :
Figure out how to change the ordering of the box plot as shown below: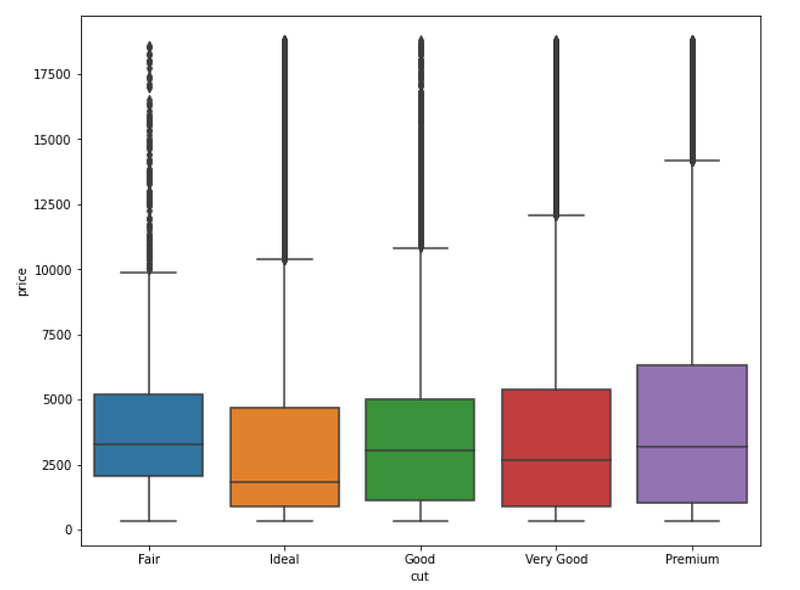
If you find this post helpful, please consider to subscribe to the Jungletronics for more posts like this.
Until next time!
I wish you excellent day!
Be safe!
Cheers!
Colab Notebook Anwers link:)
Google Drive link:)
Google Colab Notebooks are here:
Credits & References
INTRODUÇÃO A MACHINE LEARNING PARA CERTIFICAÇÃO HCIA-AI by crateus.ufc.br
Posts Related:
00Episode#PySeries — Python — Jupiter Notebook Quick Start with VSCode — How to Set your Win10 Environment to use Jupiter Notebook
01Episode#PySeries — Python — Python 4 Engineers — Exercises! An overview of the Opportunities Offered by Python in Engineering!
02Episode#PySeries — Python — Geogebra Plus Linear Programming- We’ll Create a Geogebra program to help us with our linear programming
03Episode#PySeries — Python — Python 4 Engineers — More Exercises! — Another Round to Make Sure that Python is Really Amazing!
04Episode#PySeries — Python — Linear Regressions — The Basics — How to Understand Linear Regression Once and For All!
05Episode#PySeries — Python — NumPy Init & Python Review — A Crash Python Review & Initialization at NumPy lib.
06Episode#PySeries — Python — NumPy Arrays & Jupyter Notebook — Arithmetic Operations, Indexing & Slicing, and Conditional Selection w/ np arrays.
07Episode#PySeries — Python — Pandas — Intro & Series — What it is? How to use it?
08Episode#PySeries — Python — Pandas DataFrames — The primary Pandas data structure! It is a dict-like container for Series objects
09Episode#PySeries — Python — Python 4 Engineers — Even More Exercises! — More Practicing Coding Questions in Python!
10Episode#PySeries — Python — Pandas — Hierarchical Index & Cross-section — Open your Colab notebook and here are the follow-up exercises!
11Episode#PySeries — Python — Pandas — Missing Data — Let’s Continue the Python Exercises — Filling & Dropping Missing Data
12Episode#PySeries — Python — Pandas — Group By — Grouping large amounts of data and compute operations on these groups
13Episode#PySeries — Python — Pandas — Merging, Joining & Concatenations — Facilities For Easily Combining Together Series or DataFrame
14Episode#PySeries — Python — Pandas — Pandas Dataframe Examples: Column Operations
15Episode#PySeries — Python — Python 4 Engineers — Keeping It In The Short-Term Memory — Test Yourself! Coding in Python, Again!
16Episode#PySeries — NumPy — NumPy Review, Again;) — Python Review Free Exercises
17Episode#PySeries — Generators in Python — Python Review Free Hints
18Episode#PySeries — Pandas Review…Again;) — Python Review Free Exercise
19Episode#PySeries — MatlibPlot & Seaborn Python Libs — Reviewing theses Plotting & Statistics Packs
20Episode#PySeries —Seaborn Python Review — Reviewing theses Plotting & Statistics Packs (this one)