Guide to Machine Learning for Anomaly Detection: Introduction
A carefully generated, thoroughly engineered resource for Data Scientists.
Chapter 01 from the Guide to Machine Learning for Anomaly Detection
Warning! Before you continue reading this article and all the articles that compose this guide, you must understand this was in part generated using OpenAI’s GPT 4 model. It started as a self learning project and I soon enough realized this could be really valuable to fellow data scientists. Because of this, I will release the entire guide for free alongside every chapter so you can directly go read the guide from the document so you don’t even need to give me reading time if you don’t want to.
Guide Index
>>>>> 0: About the generation of this guide <<<<< >>>>> 1: Introduction to Anomaly Detection <<<<< 2: Statistical Techniques for Anomaly Detection (Part 1) 2: Statistical Techniques for Anomaly Detection (Part 2) 3: Introduction to M. Learning for Anomaly Detection (Part 1) 3: Introduction to M. Learning for Anomaly Detection (Part 2) 4: Dealing with Imbalanced Classes in Supervised Learning 5: K-Means Clustering for Anomaly detection 6: DBSCAN for Anomaly detection 7: Isolation Forest for Anomaly Detection 8: One-Class SVM (Support Vector Machine) for Anomaly Detection 9: K-Nearest Neighbors (KNN) for Anomaly Detection 10: Principal Graph and Structure Learning (PGSL) for Anomaly Detection 11: Dimensionality Reduction Techniques for Anomaly Detection 12: Singular Value Decomposition (SVD) for Anomaly Detection 13: Advanced Matrix Factorization Techniques for Anomaly Detection 14: Nystrom Method for Anomaly Detection 15: Kernel Methods for Anomaly Detection 16: Advanced Algorithms for Anomaly Detection 17: Feature Selection and Engineering for Anomaly Detection 18: Semi-Supervised Learning for Anomaly Detection 19: Deep Learning for Anomaly Detection 20: Ensemble Methods for Anomaly Detection 21: Evaluation Metrics for Anomaly Detection 22: Case Studies and Industry Applications 23: Conclusion and Future Directions in Anomaly Detection
About the generation of this guide
So, here’s the deal…
Back in June 2023, I got this itch to really dive deep into anomaly detection. My day job revolves around it, and I figured, why not make the most of it?

Enter OpenAI with its powerful GPT-4 engine. I had this interesting idea to use it to help me set up a course-like rundown for any topic — this time, it was anomaly detection. My game plan was to have GPT draft each section so I could learn every topic in great detail.
As I kept at it, I quickly realized I was generating something of value, so I thought, why not turn all these bits and pieces into one solid guide? Partly just to see if I could, and partly so I’d have this handy reference for later.
Step one was sketching out what this guide would look like. What topics should be in there? What would make it really thorough?
Now, crafting each chapter was a bit of a marathon. ChatGPT is cool, but as of then, it wasn’t exactly writing off the shelf best-sellers. I had to nudge it with several different prompts for every section, time and time again. Some took a few tries to get just right but most of the time I had to do quite some heavy lifting to have compelling material. Most importantly, this is supposed to be a coding guide, so I had to ensure code works and examples are relevant. Overall, this is to explain that even though I mainly worked with GPT this still took an immense amount of hours for me to generate.
Oh, and the coding? I tested every single line of code on jupyter notebooks, which you’ll find with this guide at the end of every article. Put in some serious hours to make sure everything’s on point — talking about ~ 2 hours per chapter. Tried to chip away at it daily, setting aside about 30 to 40 minutes. Slow and steady, you know?
Chapter 1: Introduction to Anomaly Detection
Definition of Anomaly Detection
As we step into the world of anomaly detection, we begin with the fundamental question: What is anomaly detection?
By definition, anomaly detection, also known as outlier detection, is the process of identifying data points, events, or observations which deviate from the norm.
These points, which are typically few and far between, often carry significant and critical information. In the context of a vast dataset, these anomalous points may appear random, but they often reveal an underlying pattern or cause that is markedly different from the rest of the data.
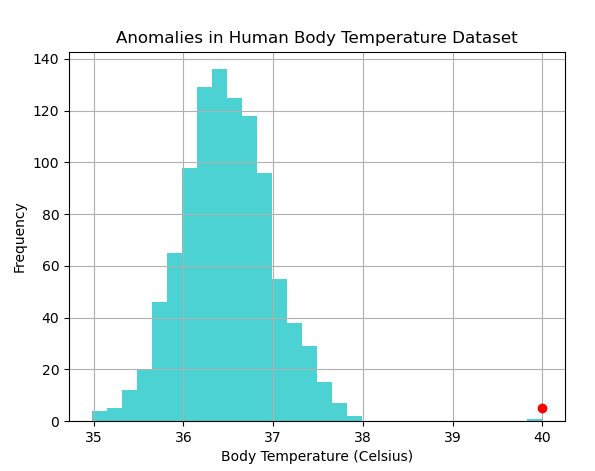
In the real world, anomalies can manifest in many forms and are domain-specific. For example, in a dataset of normal human body temperatures, a reading of 40 degrees Celsius would be considered anomalous, given that it significantly deviates from the normal human body temperature range.
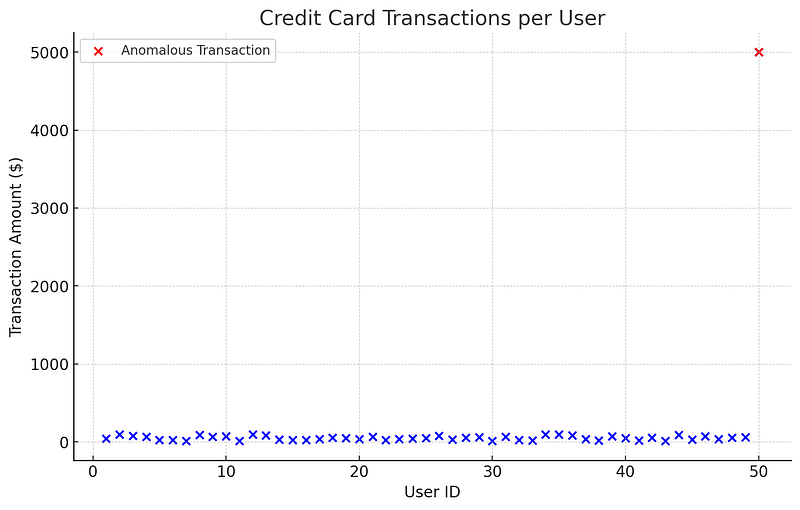
Similarly, in a credit card transaction dataset, a sudden, large transaction from a user who typically makes only small transactions could be considered an anomaly, as it doesn’t conform to their usual spending behavior.
The formal definition of an anomaly is dependent on the specific context. In general, however,
an anomaly is defined as an observation that deviates so much from other observations as to arouse suspicion that it was generated by a different mechanism (Hawkins, 1980).
This definition highlights a few important aspects of anomalies.
- Firstly, anomalies are data points that are significantly different from the norm.
- Secondly, this difference is not just random noise, but a systematic deviation, suggesting a separate underlying mechanism or cause.
It’s essential to note that anomalies are not inherently bad or undesirable. While the term anomaly often carries a negative connotation, such as in the case of fraudulent credit card transactions or network intrusions, anomalies can also represent something positive or valuable. For example, in a pharmaceutical setting, an anomalous result could point to a new, previously unknown, therapeutic effect of a drug.
Classification of Anomalies
Anomalies, by their nature, deviate from what is expected or usual in a dataset. This deviation is what makes them interesting and potentially valuable. However, not all anomalies are created equal. Depending on their characteristics, we can classify anomalies into three distinct categories:
- Point Anomalies
- Contextual Anomalies
- Collective Anomalies
Let’s delve deeper into these categories to understand their unique characteristics and implications.
Point Anomalies
Point anomalies, also referred to as global anomalies, represent the simplest form of anomalies.
A data point that significantly deviates from the rest of the dataset is considered a point anomaly.
These deviations are clear when the data point lies significantly outside the overall pattern or distribution of the data.
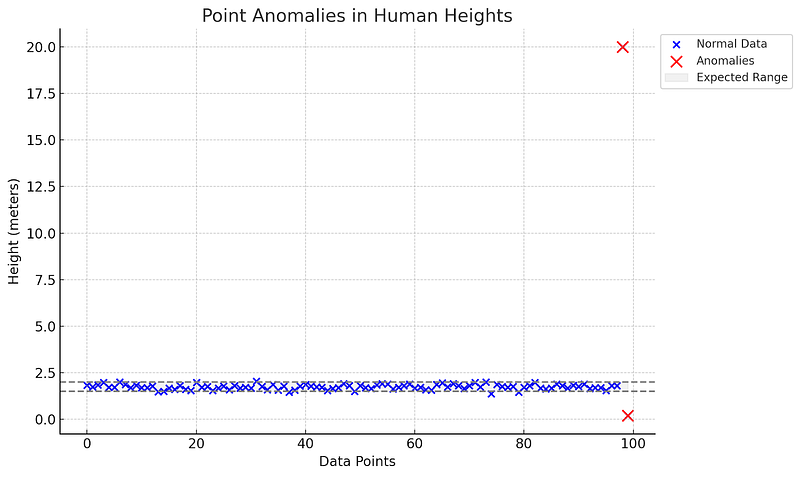
For instance, consider a dataset of human heights, where most data points range between 1.5 and 2 meters. If we encounter a value of 20 meters or 0.2 meters, it would be considered a point anomaly, as it lies far outside the expected range of human heights.
Contextual Anomalies
Contextual anomalies, or conditional anomalies, are
data points that deviate significantly within a specific context but may not be considered anomalies otherwise.
The context refers to a situation or condition that can be defined using other data attributes.
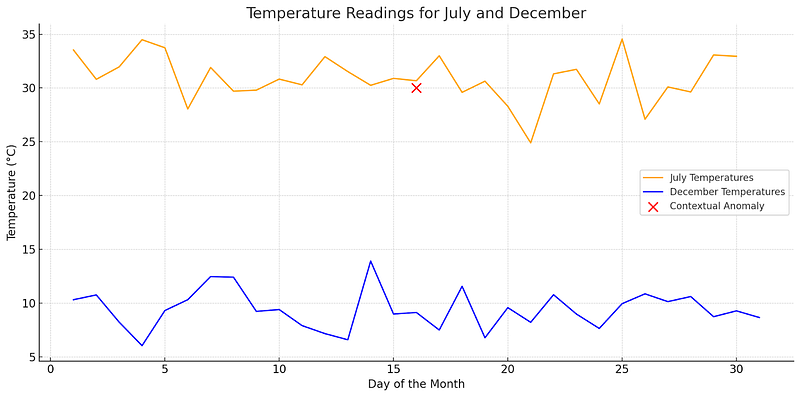
Consider the temperature readings from a weather station. A temperature of 30 degrees Celsius in July (summer) may not be an anomaly, but the same reading in December (winter) could be considered a contextual anomaly (assuming a region where winters are typically cold).
Collective Anomalies
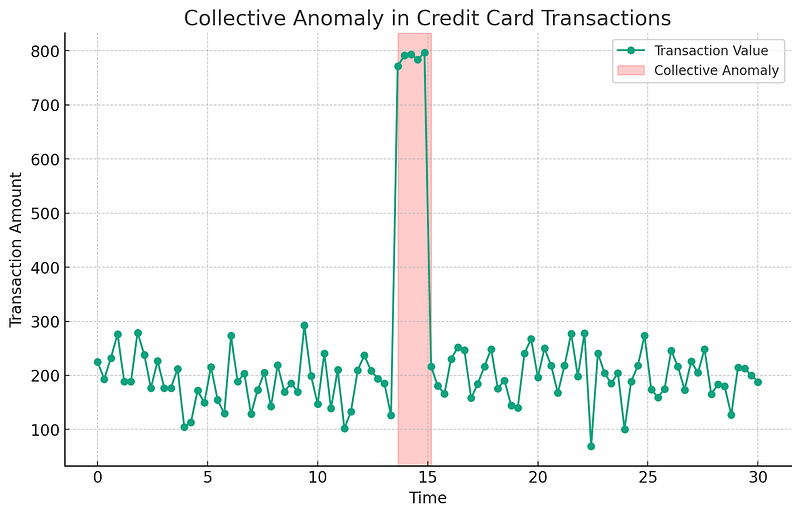
Collective anomalies involve a collection of data points that, together, are considered anomalous but may not be so individually.
This type of anomaly is interesting in cases where data points are related or connected. The individual data points may not be anomalies on their own, but their occurrence together is anomalous.
Consider a scenario where an individual is using a credit card. A single high-value transaction might not raise flags if the user has a history of similar transactions. However, a series of such high-value transactions in a short time span could be considered a collective anomaly, potentially indicating credit card fraud.
In summary, these three categories provide us with a comprehensive framework to understand and identify anomalies in various datasets. As we delve deeper into the concepts and techniques of anomaly detection, keep in mind that different types of anomalies may require different detection methods. Understanding these categories will help us choose the most appropriate anomaly detection technique for a given situation or dataset.
Anomaly detection has a wide range of applications across various domains, from credit card fraud detection, network intrusion detection, and health monitoring, to industrial damage detection, image processing, and more. The identification and understanding of these anomalies can provide valuable insights into unusual behaviors, identify potential issues and threats, and facilitate effective decision-making.
Despite its importance, anomaly detection presents several challenges. Given that anomalies are rare by definition, the imbalance in the data can make the detection process complex. Additionally, the boundary between normal and anomalous behavior isn’t always clear and can evolve over time. As a result, the process often requires a combination of statistical techniques, machine learning algorithms, and domain knowledge.
With this comprehensive understanding of anomaly detection, we will delve deeper into various techniques used for detection, starting from statistical techniques, then moving onto machine learning and deep learning techniques. In the forthcoming chapters, we will take a closer look at these methods, discussing their principles, applications, advantages, and limitations, and offering readers a complete and in-depth understanding of the rich and promising field of anomaly detection.
Throughout this journey, keep in mind that
the aim of anomaly detection is not just to identify the outliers, but also to understand the ‘why’ behind these outliers.
Each anomaly represents a story, a deviation from the norm that, when properly understood, can provide invaluable insights and opportunities for intervention and improvement.
Coding Time: Putting Anomaly Detection into Practice
Now that we have covered the theory of anomaly detection and its types, let’s put it into practice with a Python code demonstration. This will allow us to visualize what an anomaly looks like in a dataset and see a simple method of detecting anomalies.
import numpy as np
import matplotlib.pyplot as plt

# Set the random seed for reproducibility
np.random.seed(0)

# Generate 1000 data points from a normal distribution with mean 0 and standard deviation 1
data = np.random.normal(0, 1, 1000)

# Introduce an anomaly - a point that is much different than the rest
data[500] = 50

# A simple anomaly detection function
def detect_anomalies(data, threshold=3):
    # Calculate the mean and standard deviation of the data
    mean, std = np.mean(data), np.std(data)
    # Identify anomalies - points that are more than `threshold` standard deviations away from the mean
    anomalies = np.abs(data - mean) > threshold * std
    return anomalies

# Detect anomalies
anomalies = detect_anomalies(data)

# Plot the data and the anomalies
plt.figure(figsize=(10, 6))
plt.plot(data, 'b-')
plt.plot(np.where(anomalies)[0], data[anomalies], 'ro')
plt.title('Data points and anomalies')
plt.xlabel('Index')
plt.ylabel('Value')
plt.grid(True)
plt.show()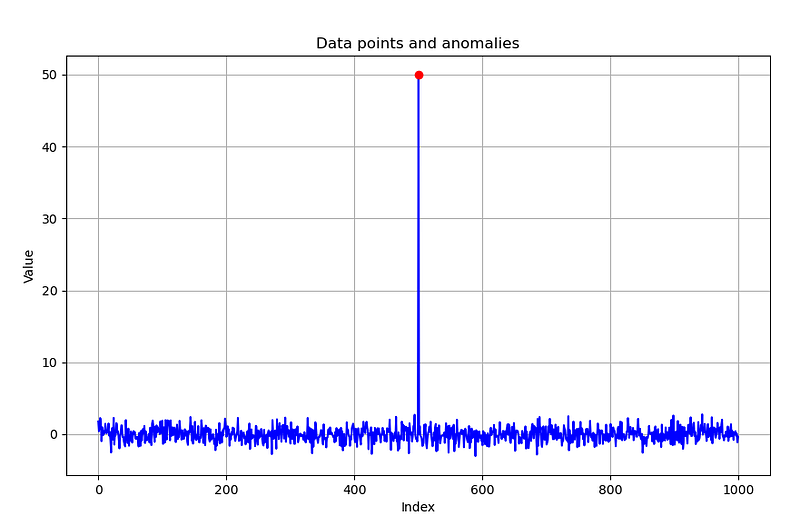
In this code snippet:
- We start by generating 1000 data points from a standard normal distribution (mean = 0, standard deviation = 1).
- We then manually introduce an anomaly — a data point that is significantly different from the rest (in this case, we set the 500th data point to 50).
- The detect_anomalies function is a simple anomaly detection algorithm based on the statistical concept of a z-score. It calculates the mean and standard deviation of the data and flags data points that are more than a certain threshold number of standard deviations away from the mean as anomalies. In this instance, we use a threshold of 3, which is a commonly used value, but this can be adjusted based on the specific context and requirements.
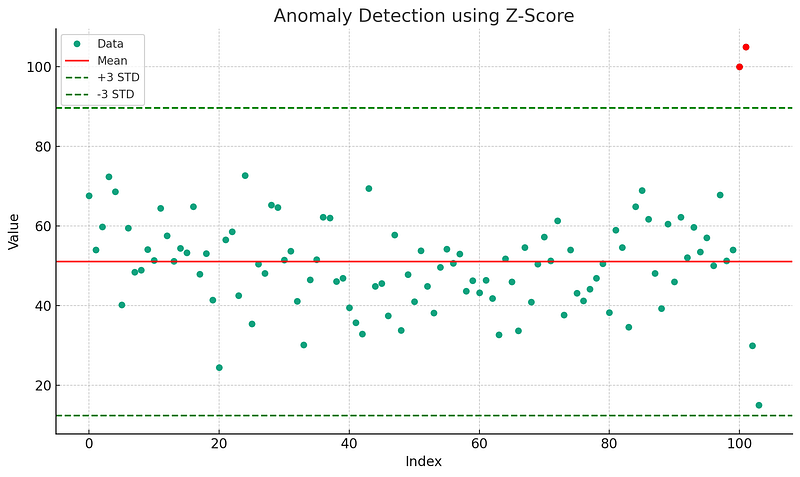
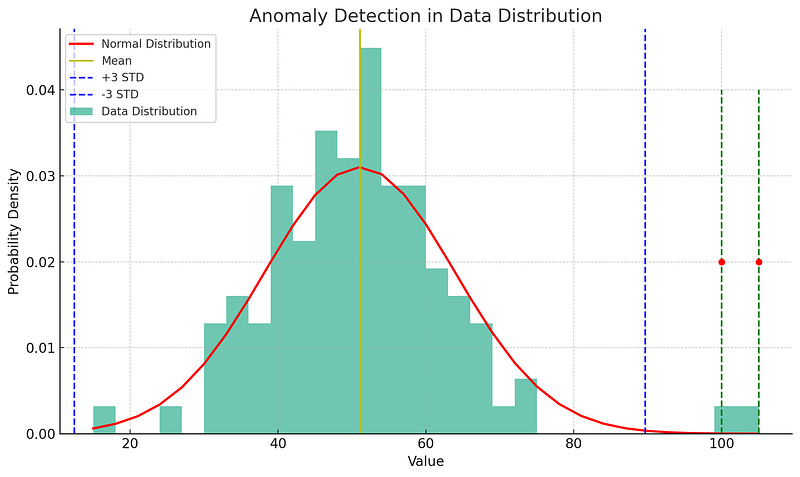
- Finally, we detect the anomalies in our data using this function and plot the data. Data points flagged as anomalies are highlighted in red. This visualization provides a clear, intuitive understanding of anomalies as data points that deviate significantly from the rest of the dataset.
As we progress through this guide, we will encounter more sophisticated techniques for anomaly detection, suited to more complex datasets and nuanced definitions of what constitutes an anomaly. Nevertheless, the core idea illustrated by this simple example — an anomaly is a data point that is ‘unusual’ in the context of the rest of the data — remains a fundamental concept in anomaly detection.
Remember, the beauty of anomaly detection lies in its wide array of applications, from detecting credit card fraud to identifying outliers in sensor data. Armed with the theoretical knowledge and hands-on experience, you are now ready to delve deeper into the world of anomaly detection.
See you in Chapter 2!
Link to Chapter 1 code : https://github.com/gabrielpierobon/anomaly_detection/blob/main/Chapter%2001%20Introduction%20to%20Anomaly%20Detection.ipynb
Link to PDF Guide: https://drive.google.com/file/d/1g77lB2zeZGQUqIyPSb9Fr-uMyjmAG4j4/view?usp=drive_link


