Data Science 101 | Towards AI
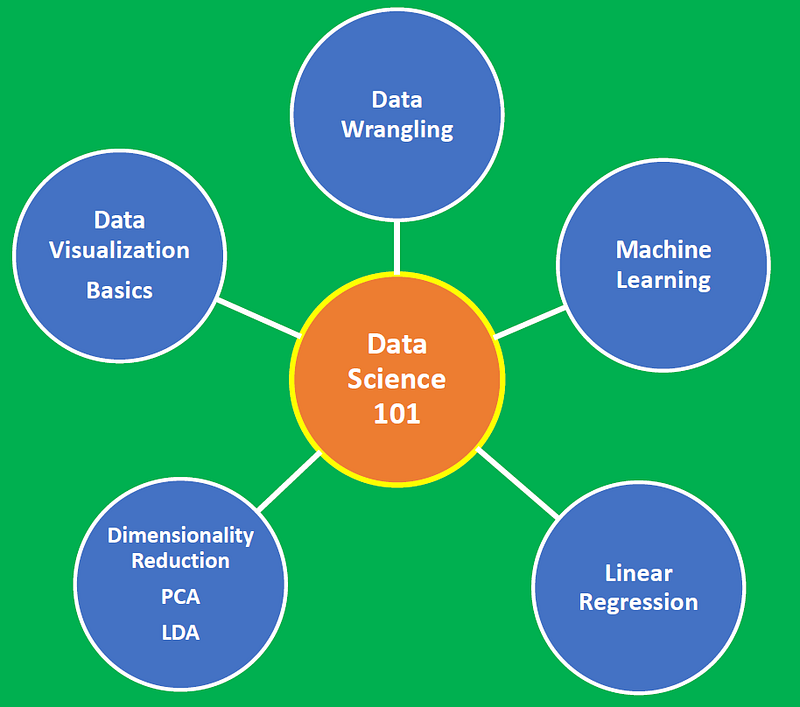
Data Science 101 — A Short Course on Medium Platform with R and Python Code Included
Data Science 101 is intended for individuals that have some prior exposure or knowledge in data science concepts and are interested in practical applications beyond what is offered in most introductory-level data science courses on platforms such as DataCamp, Coursera, Udemy, or edX.
This course will provide you with the fundamental knowledge that you need in data science using real-world examples. The course contains several examples with code included using both R and Python, considered the top 2 programming languages used by most data science organizations and industries.
Why You Should Take This Course
- All course materials are included as links to my medium data science articles, so you don’t need to leave this platform to access course materials. Supplementary course materials such as datasets, jupyter notebooks, R scripts, and sample output files are included as links to my GitHub repositories.
- Code is provided for all examples using R or Python. You can download the code and datasets for each example, and then modify it accordingly for learning purposes or modify the code to solve an entirely different problem.
- The course can also serve as a quick refresher for those preparing for a data scientist job interview as some of the course materials are designed using materials from typical data scientist interviews take-home challenge projects.
- The author has 2 years of experience in data science education, he is a top contributor to the online data science publication Towards AI, and he keeps learning new data science concepts each and every day. So please feel free to leave feedback comments or questions for further clarification or discussion.
What You Will Learn:
- Fundamental programming skills in R and Python
- Learn how to process raw data into formats necessary for analysis
- Learn techniques for transforming data such as principal component analysis (PCA) and linear discriminant analysis (LDA)
- Learn basic data visualization principles and how to apply them using R’s ggplot2, and Python’s matplotlib and seaborn packages
- Introduction to linear regression including simple and multiple regression problems
- Learn the machine process
- Implement machine learning algorithms
- In-depth knowledge of fundamental data science concepts through motivating real-world case studies
- Hands-on Experiential learning
Prerequisites
This course assumes basic understanding of programming concepts in R and Python. The course also assumes familiarity with essential math skills. Please see the article: Essential Math Skills for Machine Learning for more information about essential math skills required for practicing data scientists.
MODULE 1: Data Wrangling
The process of data wrangling is a critical step for any data scientist. Very rarely is data easily accessible in a data science project for analysis. It’s more likely for the data to be in a file, a database, or extracted from documents such as web pages, tweets, or PDFs. Knowing how to wrangle and clean data will enable you to derive critical insights from your data that would otherwise be hidden.
This module will demonstrate the data wrangling process. You’ll learn the following:
- Read csv file from the internet using file’s URL and convert it directly into a data frame for analysis.
- Importation of unstructured data
- Cleaning and organizing unstructured data using string processing techniques
- Converting unstructured data into structured data
- Performing analysis of structured data
- Extracting data from a pdf using tools in R and Python
Module Links:
Using sapply() function in R to generate a table
Download a file from the internet using the R functions download.file() and read.csv()
Tutorial on Data Wrangling: College Towns Dataset
Extracting Data from PDF File Using Python and R
MODULE 2: Data Visualization Basics
This module will teach basic data visualization principles and how to apply them using R’s ggplot2 and Python’s matplotlib packages. You will learn the following:
- Scatter plot
- Barplot
- Histrogram
- Probability density plot
- Line plot
- Pairplot
- Heatmap
Module Links:
Tutorial on Barplots using R’s ggplot Package
Tutorial on Data Visualization: Weather Data
Bad and Good Regression Analysis
Building a Machine Learning Recommendation Model from Scratch
MODULE 3: Techniques of Dimensionality Reduction
A machine learning algorithm (such as classification, clustering or regression) uses a training dataset to determine weight factors that can be applied to unseen data for predictive purposes. Before implementing a machine learning algorithm, it is necessary to select only relevant features in the training dataset. The process of transforming a dataset in order to select only relevant features necessary for training is called dimensionality reduction. Dimensionality reduction is important because of three main reasons:
- Prevents Overfitting: A high-dimensional dataset having too many features can sometimes lead to overfitting (model captures both real and random effects).
- Simplicity: An over-complex model having too many features can be hard to interpret especially when features are correlated with each other.
- Computational Efficiency: A model trained on a lower-dimensional dataset is computationally efficient (execution of algorithm requires less computational time).
Dimensionality reduction, therefore, plays a crucial role in data preprocessing. In this module, you’ll learn two important techniques for dimensionality reduction:
- Principal Component Analysis (PCA)
- Linear Discriminant Analysis (LDA)
Module Links:
Machine Learning: Dimensionality Reduction via Linear Discriminant Analysis
Machine Learning: Dimensionality Reduction via Principal Component Analysis
MODULE 4: Linear Regression
Learn how to use Python’s Pylab and Sklearn tools to implement linear regression, one of the most common statistical modeling approaches in data science. You’ll learn about the following:
- Building a simple linear regressor using Python
- Gradient-descent algorithm for minimizing the cost function
- Hyperparameter tuning
- Bias-variance tradeoff
- Multiple regression analysis
- Model Evaluation
- R-Square value
- Residual and Mean Square Error (MSE)
Module Links:
Machine Learning: Python Linear Regression Estimator Using Gradient Descent
Bad and Good Regression Analysis
Linear Regression Analysis in Materials Sciences
Bias-Variance Tradeoff Illustration Using Pylab
Building a Machine Learning Recommendation Model from Scratch
MODULE 5: Machine Learning
Learn how machine learning can be used for building a recommendation system and for forecasting loan status using Monte Carlo simulation.
You’ll learn the following:
- Covariance matrix
- Variable selection
- Feature standardization
- Data partitioning into train, test, and validation sets
- Model building
- Model evaluation
- Hyperparamter tuning
- Cross-validation
- PCA, LDA, and Lasso Regression
- Sklearn’s pipeline tool
- Monte Carlo simulation
Module Links:
Building a Machine Learning Recommendation Model from Scratch
Machine Learning Model for Stochastic Processes
References and Additional Resources
- Essential Math Skills for Machine Learning: https://readmedium.com/4-math-skills-for-machine-learning-12bfbc959c92.
- Best Data Science MOOC Specializations: https://readmedium.com/3-best-data-science-mooc-specializations-d58da382f628.
- 5 Steps to Become a Data Scientist: https://readmedium.com/five-steps-to-becoming-a-data-scientist-239bbc60a6e3.
- Data Scientist Interview Process — A Personal Experience: https://readmedium.com/data-scientist-interview-process-a-personal-experience-33295495b4a0.