avatarBenjamin Obi Tayo Ph.D.

Free AI web copilot to create summaries, insights and extended knowledge, download it at here

1147

Abstract

pan class="hljs-number">0</span>.<span class="hljs-number">90</span>,<span class="hljs-number">0</span>.<span class="hljs-number">80</span>,<span class="hljs-number">0</span>.<span class="hljs-number">70</span>,<span class="hljs-number">0</span>.<span class="hljs-number">50</span>,<span class="hljs-number">0</span>.<span class="hljs-number">30</span>,<span class="hljs-number">0</span>.<span class="hljs-number">20</span>,<span class="hljs-number">0</span>.<span class="hljs-number">10</span>,<span class="hljs-number">0</span>.<span class="hljs-number">05</span>,<span class="hljs-number">0</span>.<span class="hljs-number">01</span>,<span class="hljs-number">0</span>.<span class="hljs-number">001</span>)</pre></div><div id="71c7"><pre>DegreeFreedom <-se<span class="hljs-string">q(1,10)</span></pre></div><div id="daef"><pre>Chisq_values<<span class="hljs-built_in">-sapply</span>(p_value,function(x)<span class="hljs-built_in">sapply</span>(DegreeFreedom, function(y)<span class="hljs-built_in">qchisq</span>(<span class="hljs-number">1</span>-x, y))) </pre></div><div id="3bcd"><pre><span class="hljs-function"><span class="hljs-t

Options

itle">rownames</span><span class="hljs-params">(Chisq_values)</span></span>=DegreeFreedom </pre></div><div id="dd0e"><pre><span class="hljs-function"><span class="hljs-title">colnames</span><span class="hljs-params">(Chisq_values)</span></span>=p_value </pre></div><div id="9bbd"><pre><span class="hljs-function"><span class="hljs-title">print</span><span class="hljs-params">(round(Chisq_values,<span class="hljs-number">3</span>)</span></span>)</pre></div><p id="35c2">Here is the output:</p><figure id="99e2"><img src="https://cdn-images-1.readmedium.com/v2/resize:fit:800/1*XKSWJfiHL5ryuoG2kgXszw.png"><figcaption><b>Table of χ2 values vs p-values using sapply() function.</b></figcaption></figure><p id="7a07">As data scientists, it’s important to always make use of functions and libraries in R and python, that way instead of wasting time writing long codes, the focus should be on getting the specific data science project done in a timely and efficient manner.</p><p id="9713">If you enjoyed reading this article, please clap and share on Twitter and Facebook so that others could benefit as well. Thanks for reading.</p></article></body>

Using sapply() function in R to generate a table

Suppose you want to generate a table for a function f(i,j), for 1 ≤ i ≤ N and 1 ≤j ≤ M. This can be accomplished easily using a double for loop. In a functional programming language like R, the emphasis is to use in-built functions that can perform the task, instead of using a for loop. In this article, I will illustrate how the sapply() function can be used to get the job done using few lines of code.

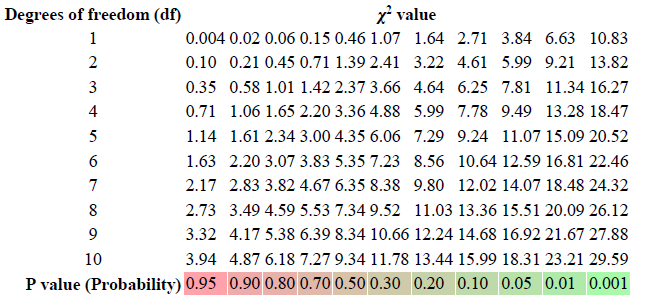
Suppose we want to reproduce a table of Chi-squared values computed for different p-values as shown on this Wikipedia page: https://en.wikipedia.org/wiki/Chi-squared_distribution:

Table of χ2 values vs p-values.

Here is the code in R that does the job:

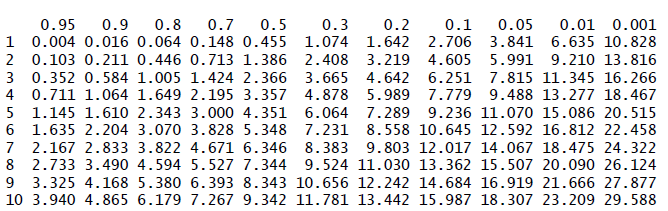
p_value <-c(0.95,0.90,0.80,0.70,0.50,0.30,0.20,0.10,0.05,0.01,0.001)
DegreeFreedom <-seq(1,10)
Chisq_values<-sapply(p_value,function(x)sapply(DegreeFreedom,    function(y)qchisq(1-x, y))) 
rownames(Chisq_values)=DegreeFreedom 
colnames(Chisq_values)=p_value 
print(round(Chisq_values,3))

Here is the output:

Table of χ2 values vs p-values using sapply() function.

As data scientists, it’s important to always make use of functions and libraries in R and python, that way instead of wasting time writing long codes, the focus should be on getting the specific data science project done in a timely and efficient manner.

If you enjoyed reading this article, please clap and share on Twitter and Facebook so that others could benefit as well. Thanks for reading.

R Programming
Sapply Function
Chi Squared Distribution
Creating Tables In R
Recommended from ReadMedium