Data Wrangling Tutorial | Towards AI
Tutorial on Data Wrangling: College Towns Dataset
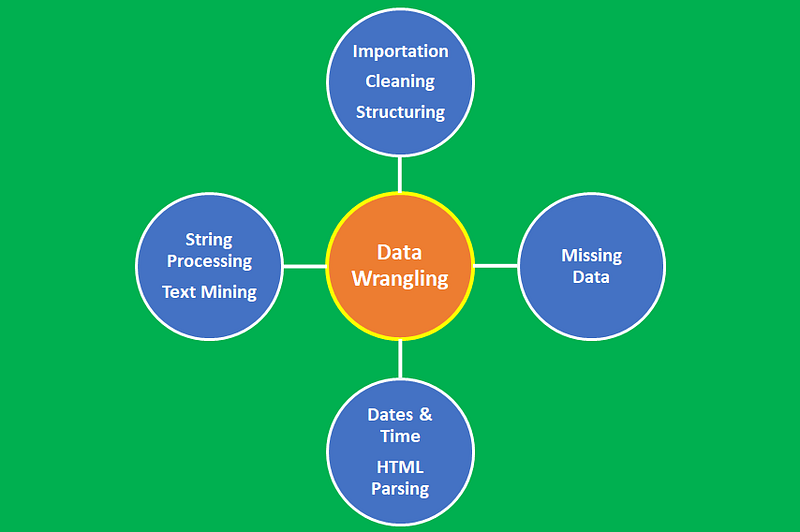
Data wrangling is the process of converting data from its raw form to the tidy form ready for analysis. Data wrangling is an important step in data preprocessing and includes several processes like data importing, data cleaning, data structuring, string processing, HTML parsing, handling dates and times, handling missing data, and text mining.
The process of data wrangling is a critical step for any data scientist. Very rarely is data easily accessible in a data science project for analysis. It’s more likely for the data to be in a file, a database, or extracted from documents such as web pages, tweets, or PDFs. Knowing how to wrangle and clean data will enable you to derive critical insights from your data that would otherwise be hidden.
This tutorial will demonstrate the data wrangling process. You’ll learn the following:
- Importation of unstructured data
- Cleaning and organizing unstructured data using string processing techniques
- Converting unstructured data into structured data
- Performing analysis of structured data
The dataset and code for this article can be downloaded from this repository: https://github.com/bot13956/unstructured_data_university_towns.
Project Objective: This code returns a DataFrame of college towns and the states they belong to, from the unstructured university_towns.txt dataset. The format of the final cleaned DataFrame is in the form:
DataFrame( [ [“Michigan”, “Ann Arbor”], [“Michigan”, “Yipsilanti”] ], columns=[“State”, “RegionName”] )which shows the state, and name of college towns in the given state.
Import Necessary Libraries
import pandas as pd
import numpy as np
Import Unstructured, Unclean Dataset
df=pd.read_table("university_towns.txt",header=None)
df.columns=["data"]
df.head(10)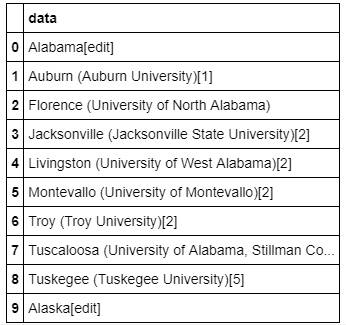
As we can see from Table 1, the dataset is very unstructured, unclean and requires a lot of tidying before any further analysis can be done.
Let’s define a dictionary that can be used to map states to their respective two-letter acronym:
states = {'OH': 'Ohio', 'KY': 'Kentucky', 'AS': 'American Samoa', 'NV': 'Nevada', 'WY': 'Wyoming',
          'NA': 'National', 'AL': 'Alabama', 'MD': 'Maryland', 'AK': 'Alaska', 'UT': 'Utah',
          'OR': 'Oregon','MT': 'Montana', 'IL': 'Illinois', 'TN': 'Tennessee', 'DC': 'District of Columbia',
          'VT': 'Vermont','ID': 'Idaho', 'AR': 'Arkansas', 'ME': 'Maine', 'WA': 'Washington', 'HI': 'Hawaii',
          'WI': 'Wisconsin','MI': 'Michigan', 'IN': 'Indiana', 'NJ': 'New Jersey', 'AZ': 'Arizona',
          'GU': 'Guam', 'MS': 'Mississippi','PR': 'Puerto Rico', 'NC': 'North Carolina', 'TX': 'Texas',
          'SD': 'South Dakota', 'MP': 'Northern Mariana Islands','IA': 'Iowa', 'MO': 'Missouri', 'CT': 'Connecticut',
          'WV': 'West Virginia', 'SC': 'South Carolina', 'LA': 'Louisiana',  'KS': 'Kansas', 'NY': 'New York',
          'NE': 'Nebraska', 'OK': 'Oklahoma', 'FL': 'Florida', 'CA': 'California', 'CO': 'Colorado',
          'PA': 'Pennsylvania', 'DE': 'Delaware', 'NM': 'New Mexico', 'RI': 'Rhode Island', 'MN': 'Minnesota',
          'VI': 'Virgin Islands','NH': 'New Hampshire', 'MA': 'Massachusetts', 'GA': 'Georgia',
          'ND': 'North Dakota', 'VA': 'Virginia'}
Order States Alphabetically
order_states=np.sort(pd.Series(states).values)
order_states;
Data Cleaning, Preparation, and Organization
NewState=[]
for i in range(0,len(order_states)):
    for j in range(0,len(df.data)):
        if (order_states[i] +'['+'edit'+']'==df.data[j]):
NewState=np.append(NewState,order_states[i])StateRegion=[]
for i in range(0,len(NewState)):
for j in range(0,len(df.data)):
if (NewState[i] +'['+'edit'+']'==df.data[j]):
n = j + 1
StateRegion=np.append(StateRegion,n)StateName=[]
CityName=[]
for i in range(0,len(NewState)-1):
for j in range(0,len(df.data)):
if (NewState[i] +'['+'edit'+']'==df.data[j]):
n = j + 1
while (NewState[i+1] +'['+'edit'+']'!=df.data[n]):
StateName=np.append(StateName,NewState[i])
CityName=np.append(CityName,df.data[n])
n = n + 1CTYNAME=[]
for i in CityName:
CTYNAME=np.append(CTYNAME, i.split('(')[0])city_new=[]
for i in CTYNAME:
if i[-1]==' ':
city_new = np.append(city_new,i[:-1])
else:
city_new=np.append(city_new,i)Structuring the Cleaned Dataset
df_final=pd.DataFrame([])StateName=np.append(StateName,'Wyoming')
city_new=np.append(city_new, 'Laramie')
df_final['State']=StateName
df_final['RegionName']=city_newdf_final.set_index(['State','RegionName'],inplace=True)df_final.head(20)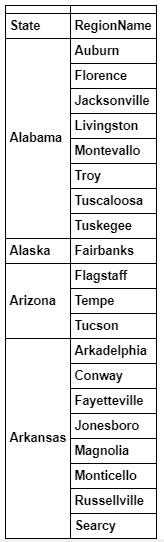
Comparing Table 1 to Table 2, we see that the dataset in Table 2 represents a clean and structured dataset that can now be used for further analysis.
Data Analysis Using Wrangled Dataset
a) University Towns in Kansas and Delaware
df_final.loc['Kansas']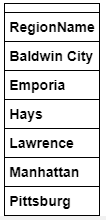
df_final.loc['Delaware']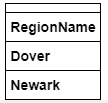
b) Number of University Towns in a given state
This can be obtained using this code:
df_final.reset_index().groupby('State').count()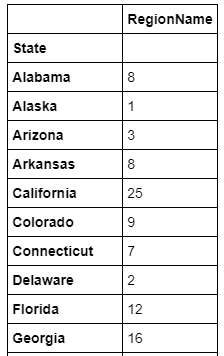
In summary, we’ve shown how data wrangling can be used to convert an uncleaned, unstructured dataset into a tidied form that is ready for further analysis. The process of data wrangling is a critical step for any data scientist. Knowing how to wrangle and clean data will enable you to derive critical insights from your data that would otherwise be hidden.
The dataset and code for this article can be downloaded from this repository: https://github.com/bot13956/unstructured_data_university_towns.