
How to Build a Bayesian Knowledge Graph
Store data in Google Sheets, visualize the knowledge graph in Neo4j, and do Bayesian reasoning with OpenMarkov
A knowledge graph is a structured representation of real-world entities and their relationships. It models relationships between entities as edges and nodes in a graph structure, enabling machine-readable and scalable representation and integration of large amounts of knowledge. It has become trendy, especially after the sensational debuts of GPT-3 and ChatGPT. With the help of GPT, we can now easily construct and query knowledge graphs. It is no surprise that, within a year, we have witnessed an explosion of GPT-based knowledge graph applications (1, 2, 3, 4, 5, 6, and 7).
However, most, if not all, of the current knowledge graphs are deterministic, descriptive, and static. They can depict the deterministic facts succinctly. But they are not equipped to describe our probabilistic world. In other words, they can’t do probabilities. For example, a deterministic graph will represent the relationship between smoking, a visit to Asia, tuberculosis (TB), and COVID-19 like this in Neo4j (Figure 2).
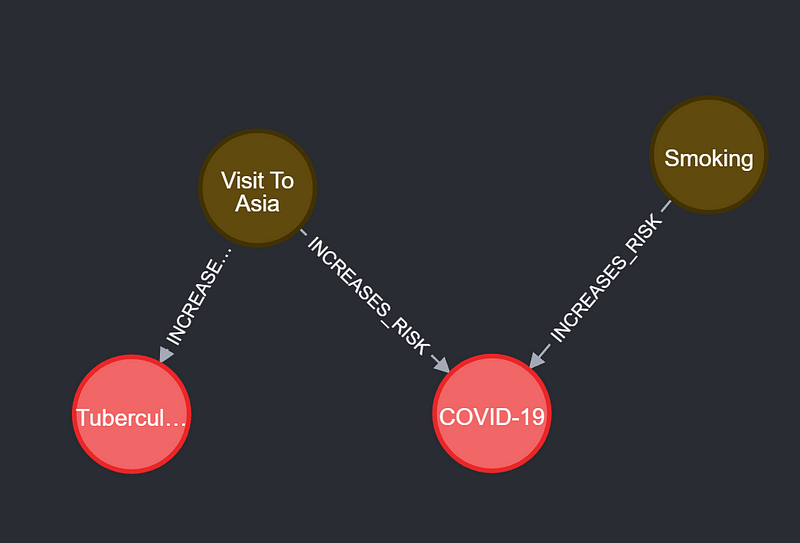
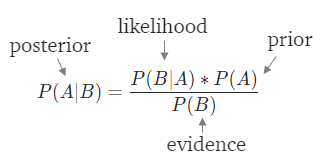
All this graph can tell us is that smoking and a trip to Asia will definitely increase the infection risks. But how likely does a citizen get a COVID infection if he has done both? If a patient went to Asia, which is more likely: TB or COVID-19? To answer these kinds of conditional probability questions, we can use a method called Bayesian inference. All we need for such an inference are prior probabilities and likelihood. They constitute the numerator of Figure 3. Let’s say that we only take smoking and Asian visit into account and calculate the odds that a citizen gets COVID. The prior probabilities for smoking represent how strongly we believe that he is a smoker/non-smoker. The likelihood of smoking and COVID-19 indicates how likely a COVID infection is if the patient smokes or not. These probabilities can be estimated via observation, experiment, or data exchange. Because we just want to calculate the odds of two competing hypotheses, we don’t need to calculate evidence. We then input them into the numerator of the Bayesian equation (Figure 3) to get the posterior.
The combination of knowledge graph and Bayesian reasoning will be of great value for healthcare, insurance, and finance. Doctors, analysts, and traders need to understand various event chains and make probabilistic decisions routinely. And we humans are notoriously bad at both context reasoning and complicated probability calculations. We often overestimate some risks (plane crashes) while underestimating others (smoking). In this case, a Bayesian knowledge graph can help us to overcome both shortcomings.
In this article, I am going to show you how to integrate Bayesian inference into a knowledge graph (Figure 1). The result is a Bayesian knowledge graph. You can find the code for this project in my GitHub repository.
The data for this project is stored in my Google Sheets here.
1. Architecture
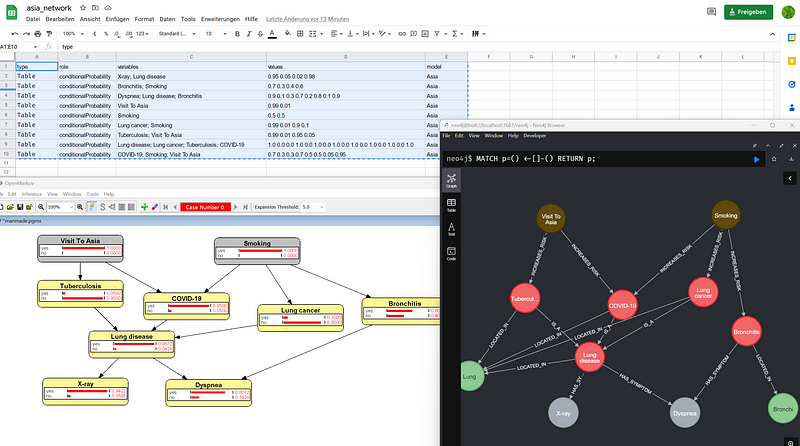
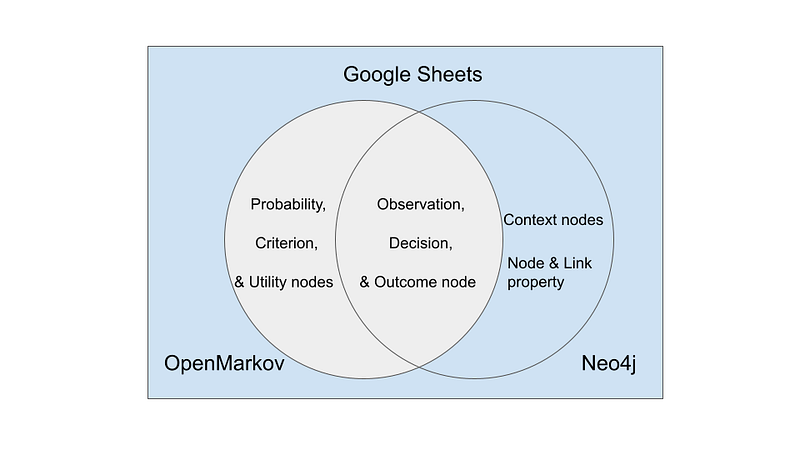
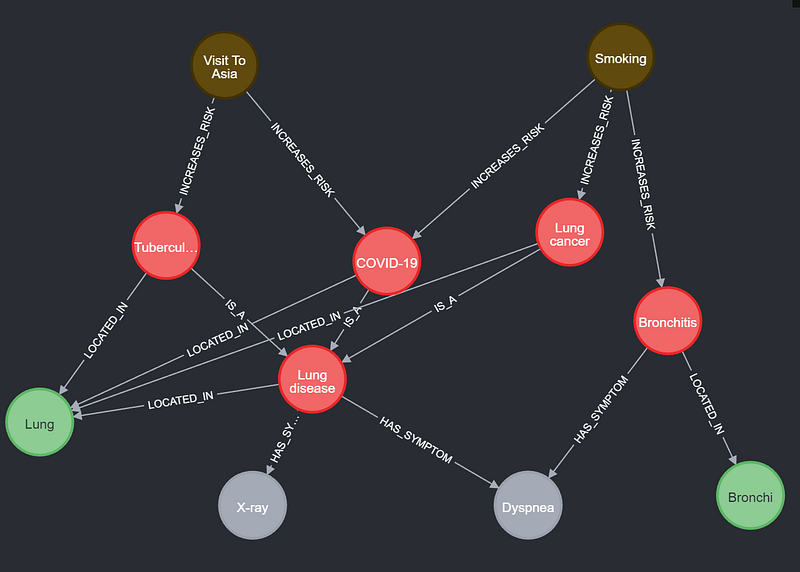
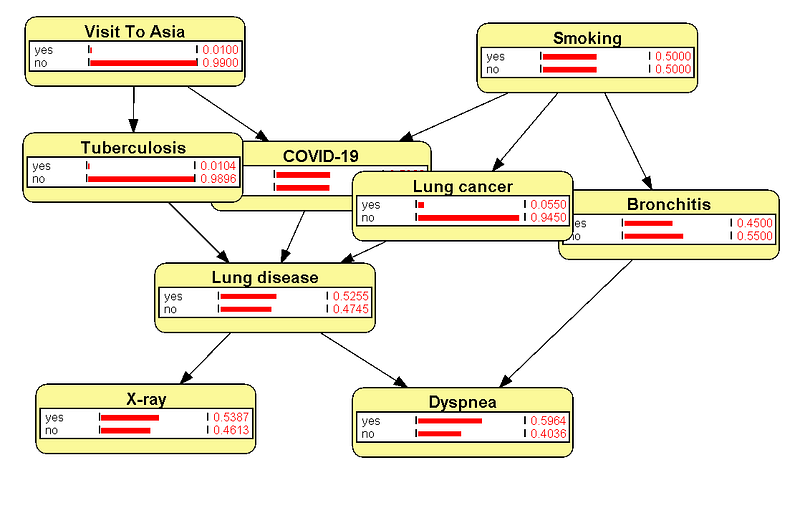
To build a Bayesian knowledge graph, we first need to design a graph that is compatible with Bayesian inference. A knowledge graph like Figure 2 won’t do. In a Bayesian knowledge graph, we need nodes to represent observations, decisions, and outcomes. And the relations in the graph represent either casual or correlational relationships. Finally, we need to encode the probabilities in the data. It is worth noting that on the one hand, the Bayesian network can be just a subgraph of our knowledge graph. The complete knowledge graph can contain nodes, relations, and properties that are not needed in Bayesian inference but are crucial for our understanding of the overall context. As we can see in Figure 1, the nodes Lung and Bronchi are not involved in the Bayesian inference, but they indicate the body parts where those diseases occur. Also, in the same graph, each disease node has a description field that describes the disease succinctly. On the other hand, Bayesian inference requires probability tables and criterion settings that are not needed in the descriptive graph visualization (Figure 5).
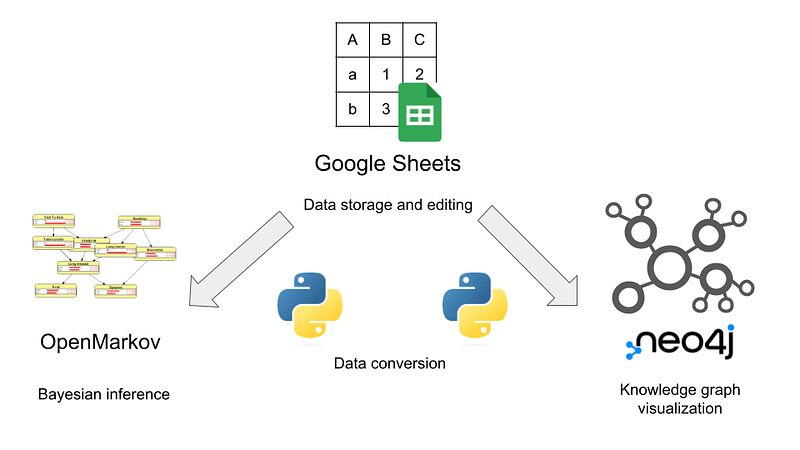
Secondly, we need software. Popular graph platforms, such as Neo4j, can show knowledge graphs interactively and beautifully. But they are not able to do Bayesian inference. Fortunately, the open-source software OpenMarkov can fill this gap. We also need to maintain a single source of truth and a mechanism that let the data flow between Neo4j and OpenMarkov. As I have demonstrated in my article Maintain a Companion Plant Knowledge Graph in Google Sheets and Neo4j, we can store the data in Google Sheets, show the knowledge graph in Neo4j, and do the Bayesian inference in OpenMarkov (Figure 4).
2. Data in Google Sheets
I have modified the so-called Asia network data for this project. The original dataset has been widely used as an example of Bayesian inference.
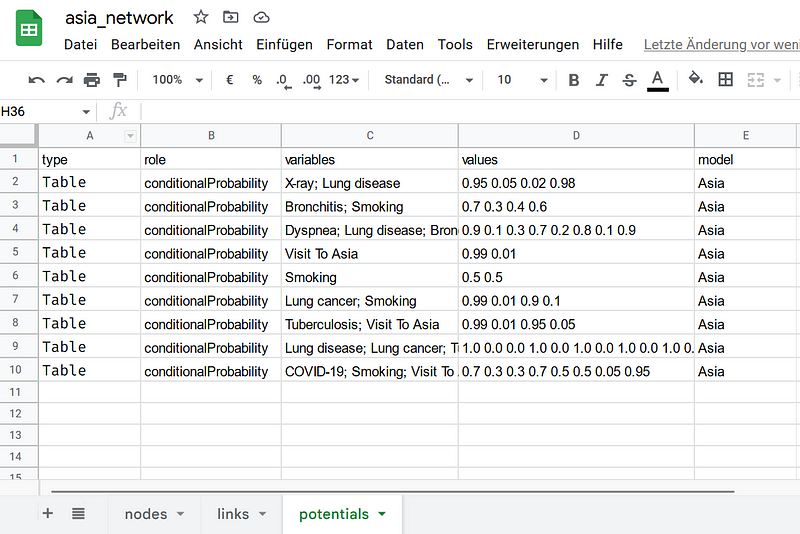
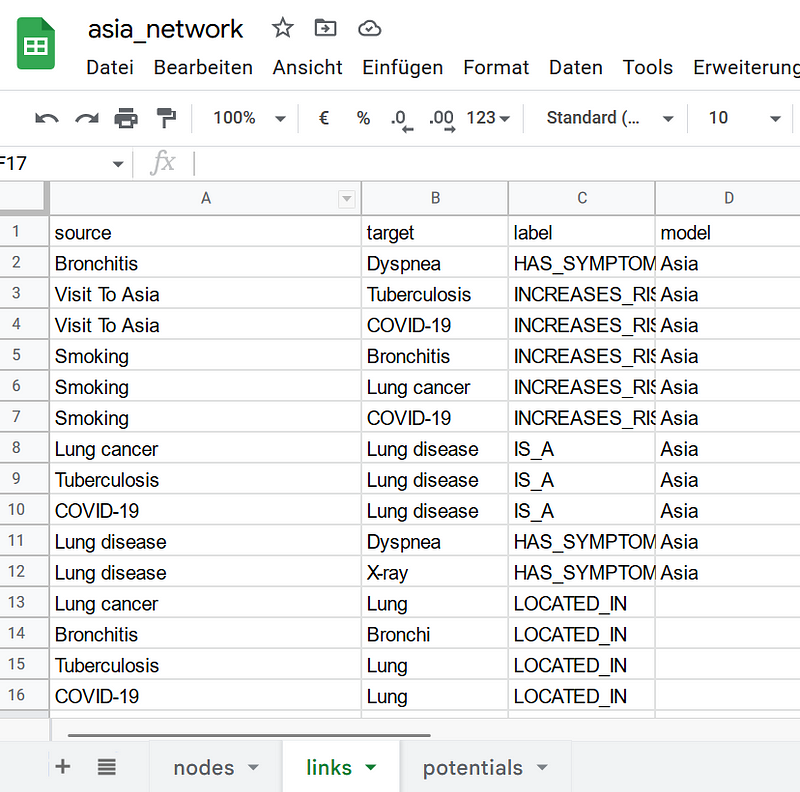
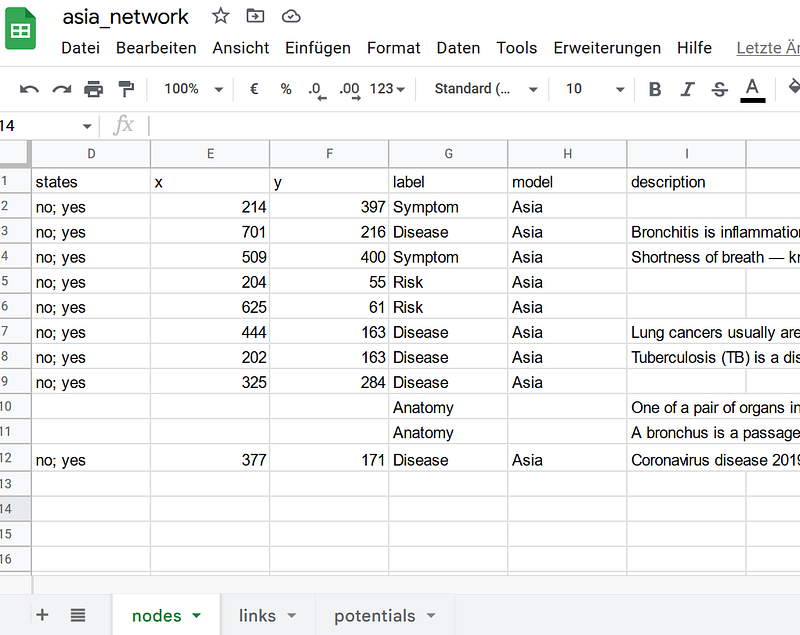
The data are saved in three separate tables in my Google Sheets, namely the nodes, links, and potentials tables (Figure 6). The nodes and links tables contain the details for the nodes and the links, respectively. In the nodes table, you can see the three new nodes (COVID-19, Lung, and Bronchi). In addition, I have added the description properties to the nodes. Finally, I encoded the conditional probabilities in the potentials table. There is a column called model in each table. It indicates to which Bayesian network a node, a link, or a potential belongs.
In my pipeline, Google Sheets is the single source of truth. All the edits can only occur here. This also makes practical sense because data editing in Google Sheets is considerably easier than in Neo4j and OpenMarkov.
3. Knowledge graph visualization in Neo4j
Once the data is stored in Google Sheets, I can use the script google_to_neo4j.py to transfer the data to Neo4j. The script generates a series of node and edge files in the TSV format. I can then import the files into a Neo4j project. Figure 7 shows the result.
As you can see in Figure 7, I added the Lung and Bronchi nodes to indicate the locations of the diseases.
4. Bayesian inference in OpenMarkov
OpenMarkov accepts data in a specific XML format called PGMX. We can generate that file with the google_to_pgmx.py script. Afterward, we can open that file in OpenMarkov.
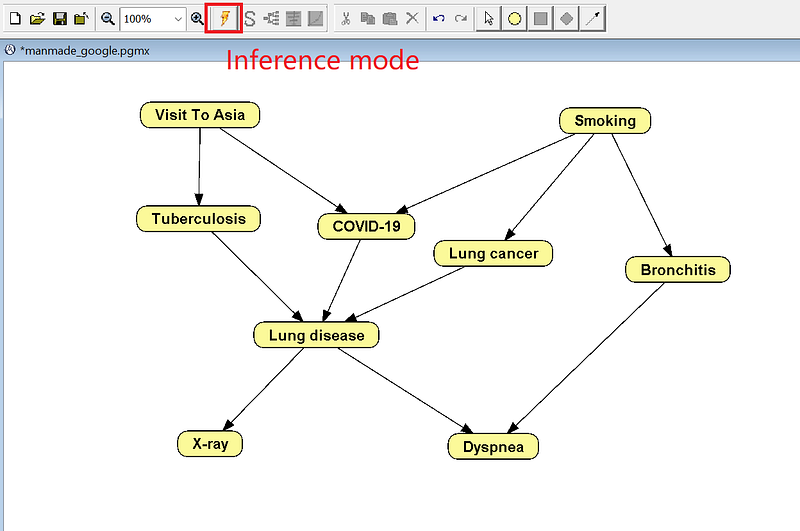
Once the data is inside OpenMarkov, we can switch to the Inference mode and do Bayesian inference (Figure 8).
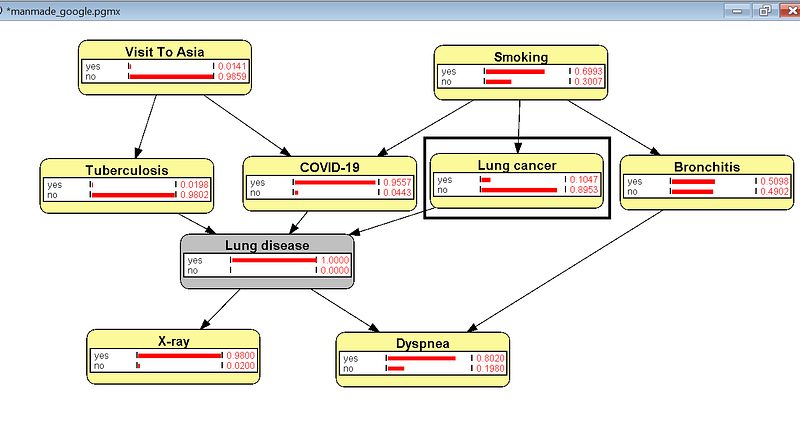
4.1 How probable is a COVID infection for a smoker who visited Asia?
We can answer this question in OpenMarkov. In the Inference mode, click the yes bars in both Visit To Asia and Smoking. The two nodes will turn gray, and the other nodes also update themselves.
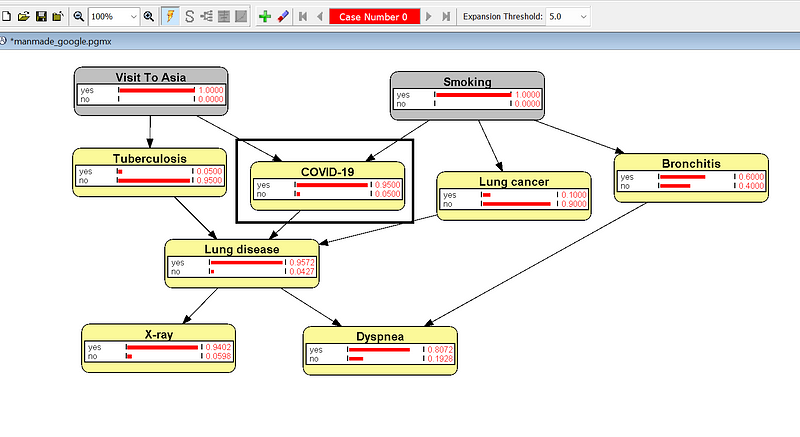
As you can read from the updated COVID-19 node, the probability of a COVID infection for this smoker is 95%.
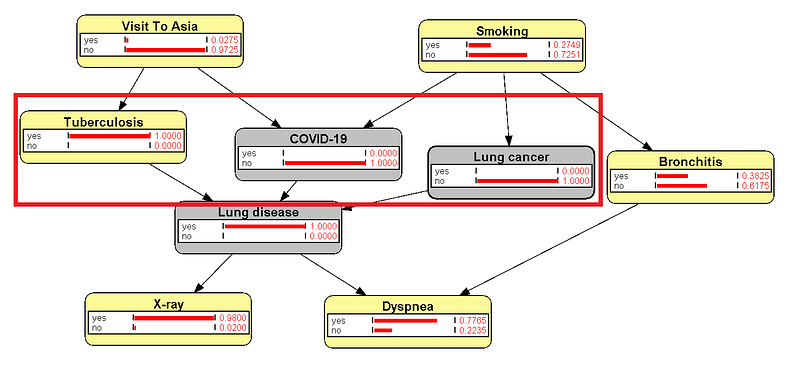
4.2 If the lungs hurt, how probable is lung cancer?
Let’s say that a patient gets lung pain. And immediately he fears the worst: lung cancer. But is it really that bad after only one symptom?
In the Inference mode in OpenMarkov, click the yes bar in Lung disease. That node turns gray. The graph immediately shows that the probability is only 10% for lung cancer (Figure 10). In contrast, it is much more likely that the patient has got COVID (95%). And please don’t forget that TB is also a possibility. That is, although cancer can cause pain, pain is not always the result of cancer. In fact, the pain is more likely caused by something more common, such as COVID. With this in mind, the patient does not need to panic for now. Instead, he’d better ask for some extra tests for a more definite diagnosis.
This example and its variants are often used to debunk the prosecutor’s fallacy. For rare events, such as rare diseases and crimes, a single piece of evidence is sometimes not enough for a conclusion. The decision maker often suffers from an error called base rate neglect. He neglects the fact that even after some initial pieces of evidence, a rare event is still quite unlikely. In other words, the initial test result is more likely to be a false positive than a true positive. And Bayesian inference is here to help us avoid such a fallacy because it calculates the correct probability of the event and forces us to consider other competing explanations.
Also, our knowledge graph reminds us of rare diseases, such as TB. After the doctor exhausted all the other two diseases, TB becomes a certainty (Figure 11), even though it was the rarest at first in our Asia network. And Sherlock Holmes knows this:
When you have eliminated the impossible, whatever remains, however improbable, must be the truth.
Conclusion
In this article, I showed you the power of a Bayesian knowledge graph. The knowledge graph displays a comprehensive big picture over a certain knowledge domain, while the Bayesian inference computes the conditional probabilities of a causal/correlational network. For example, we can build encode the medical encyclopedia into a large knowledge graph like Doctor.ai (1, 2, 3, 4, and 5) that connects multiple Bayesian diagnostic subgraphs: an Asia network for lung diseases, another network for genetic diseases, and so on. The potential is limitless.
And my work here is more a framework than a production-level implementation. So you can change the components in the framework as you see fit. For example, you can store the data in TSV files, display your knowledge in TigerGraph and analyze it in the Gemini Cloud. You can also write your own Bayesian inference or use agena.ai. And you, the data scientist, make sure that the data flow smoothly in the system.
Everybody is doing machine learning (ML) nowadays. In fact, Bayesian and ML complement each other. On the one hand, Bayesian is your only option when you don’t have enough individual data points to do ML properly. For example, it is hard for small clinics or institutes to collect or exchange enough patient data for rare diseases under privacy regulations. Even so, you can still do Bayesian as long as frequency exchanges are allowed. On the other hand, you can learn which features are important for the diagnosis from your ML. You can then collect those conditional probabilities to build your Bayesian network in your future work.
And the graph is quite easy to construct. First, we collect data for nodes and links out of research papers and news articles, just as we did for a traditional knowledge graph. But instead of concept nodes, we need chance, decision, and utility nodes for the Bayesian inference in OpenMarkov. Chance nodes represent event outcomes, and they have finite states. Decision nodes represent the finite decisions that a decision-maker can make. Utility nodes represent the cost and effect of our decisions. We then put the data into Google Sheets. Secondly, we collect the event frequencies and conditional probabilities via observations, experiments, or data exchanges. This is especially valuable for the healthcare industry, where frequency data can be exchanged while patient records cannot leave the hospitals out of privacy concerns. Finally, my scripts make sure that all the apps see the same data.
Doctors sometimes fail to diagnose rare diseases because they haven’t experienced them in their careers. A Bayesian knowledge graph can change that. It can show all the possible causes of a set of symptoms and their probabilities. So doctors can now rank the possible causes and also take rare diseases into account. We can add more features to our Bayesian knowledge graph, too. OpenMarkov can also do cost-effectiveness analyses and Markov influence diagrams (read more in this tutorial). These features can help finance operators, analysts, and doctors make better decisions. So a Bayesian knowledge graph can save money and, more importantly, lives.
Here is my new story about Bayesian knowledge graph with cost-benefit analysis.


