
Medium Statistics: Medium Enhanced Stats Extension for Chrome
See your Claps and Grab your Stats using the Chrome Browser
Medium Enhanced Stats Extension for Chrome
This is a long article, but worth reading thoroughly, in one or more reading sessions, if you have no idea what can be done with the Medium Enhanced Stats Extension.
Save this article to your Reading List by clicking on the “ribbon” underneath the number of claps at the left side, or at the end of the article.

To get to your bookmarked stories, just go to your Medium Home Page and click on the “ribbon” Bookmarks icon, which is between the magnifying glass & the bell.

The “Medium Enhanced Stats Extension (MES)” for use with the Chrome browser is an extension or add-on (a piece of software / a program) that you can download or save to your PC, and if you have the Chrome Browser (or the Opera browser), will let you easily download your Stats page information.
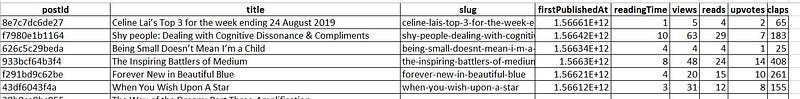
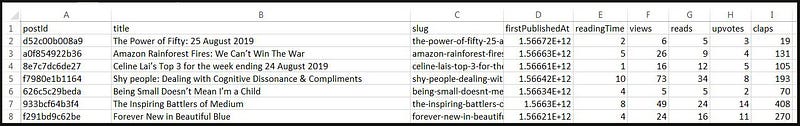
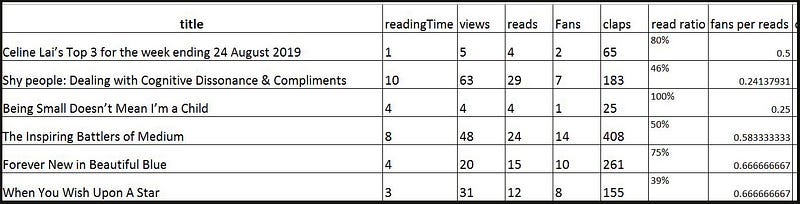
Please note that the “upvotes” in the Table above refers to Fans.
The data shown above has been downloaded from Medium, using the MES.
This is a wonderful thing for people like me whom gallantly try to copy all the data from the Medium Stats Page and then paste it into a text document or spreadsheet document, but fail.
The MES does NOT grab the Read ratio, HOWEVER I will show you later in this article how to use an Excel Formula to add in a column to your own Table showing the Read Ratio, which is the ratio of Reads to Views ( or Reads divided by Views ).
If you have ever wished that the Medium Stats page (accessed by clicking on your Avatar, the little round picture at the top right next to the Bell, then clicking on Stats) would show the number of Claps for your Stories, you are not alone.
At the time of my writing this, the Stats (also called Metrics by some people) on the Medium Stats Page show the information in Table One below, which does not include Claps!
The article below gives Medium’s descriptions of the Stats that they provide by default.
The data will be ordered by month and date of publication, latest at the top, but you can click on the little upward pointing arrow next to Date to change the Sort order to place the OLDEST Stories at the top!
Did you know that you can also click on one of the 4 statistical headings: Views / Reads / Read ratio / Fans - to sort from the highest number to the lowest, and clicking once again on a heading will reverse the sort, from lowest to highest for that Stat?
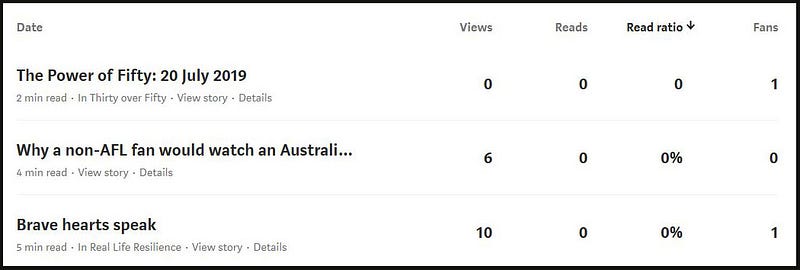
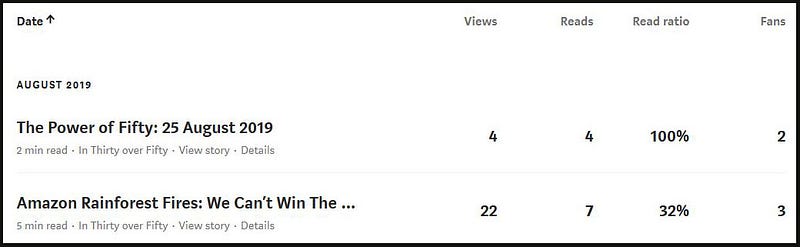
Interestingly, 2 of my Stories shown above have 1 Fan each, even though the number of Reads is zero, indicating that he/she didn’t have the Story open long enough to “clock” up a Read (so she/he closed the page before either 2 min or 5 min was over, respectively).
This means that the Fans browsed the Story very quickly and decided that on the face of it (or on the basis that they got the gist of the Story) they would engage by clapping.
Who knows? They may have felt sorry for me, and given the Story a sympathy clap! “Brave hearts speak” has one Fan, but I wish that it had one Read as well, because zero reads means that the “fan” just skim read that Story!
The fact that there is zero number of Views for one of my fortnightly Publication Newsletters, “The Power of Fifty: 20 July 2019”, which isn’t locked so non-paying readers (non-members) can read it, must mean that a Read time of 2 minutes or lower may not even clock up a View! However, there must have one View for one Fan to clap.
The Medium Enhanced Stats (MES) extension for Chrome will show cumulative Claps or the number of Claps, to date, for each of your Stories, and some possibly useful percentages or ratios, that the standard Medium Stats page doesn’t show.
Outlined below is an example of what you see with the Medium Enhanced Stats Chrome Extension. 😃
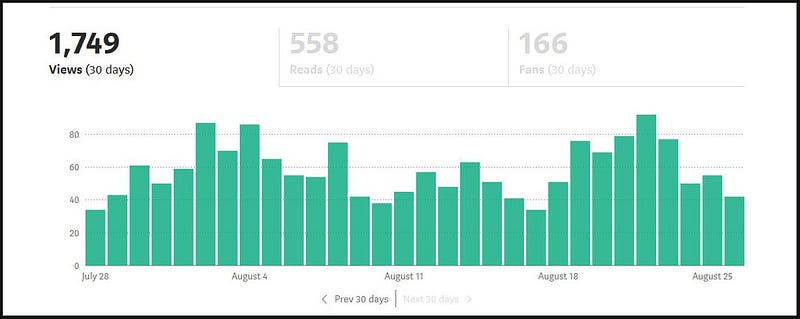
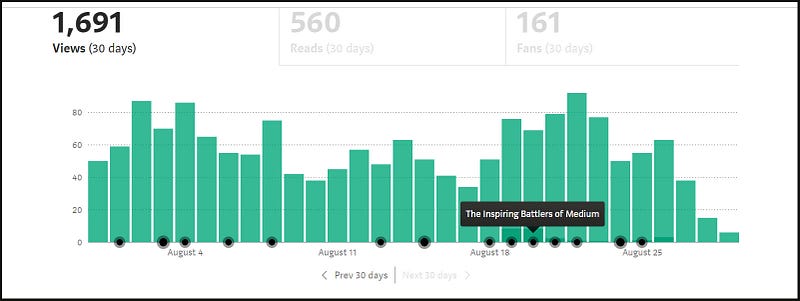
Before we get onto what the percentages in the snapshot above means, I want to tell you that you will also see a green bar chart (graph) above your columns of Stats on your Medium Stats page.
The Medium Enhanced Stats extension ramps up this graph also, as I will show!
The Bar Chart shows the number of Views for all of your Stories, for each of 30 days back from, or prior to, the current date that you visit your Stats Page.
You can click on Prev 30 days to scroll back and view the last 30 days.
It could be a good idea to look at your Stories Views (or Reads or Fans or all of these) at the end of each month (30th or 31st of each month) and to take a screen-shot (or use a Snipping tool) to capture and save the Graph(s) to your computer.
Then you can look for possible trends over the months, or at least amuse yourself over perusing each month’s stats. 😃
Did you know:
You can hover your mouse over any one of the green bars to see the Number of Views for all of your Stories for one day, with Views (30 days) showing. Likewise, you can click on the greyed out “Reads” label or on the greyed out “Fans” label, to “toggle” or switch to a Graph of one of those categories of Stats, and from there can see the number of Reads or number of Fans for all Stories for one day, by hovering your mouse over one of the green bars?
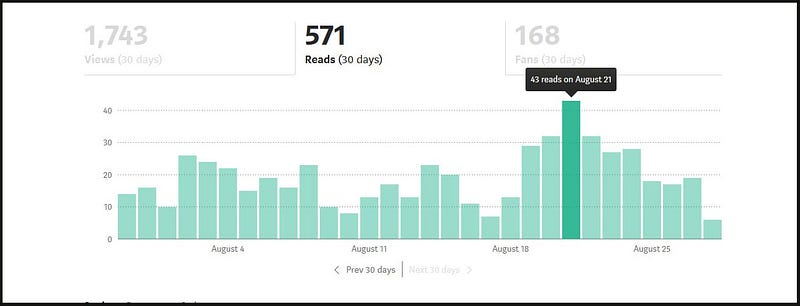
Note, the 30 day ending is now 2 days ahead of the previous graph, hence some differences in the numbers (e.g. 1743 views compared to 1749).
Not many Reads, on that one day August 21st, in total (43) for all of my Medium Stories published to August 21, yes I know! But I can dream about it…..my Reads and Fans (people who Clap for a Story) sky-rocketing. 😲
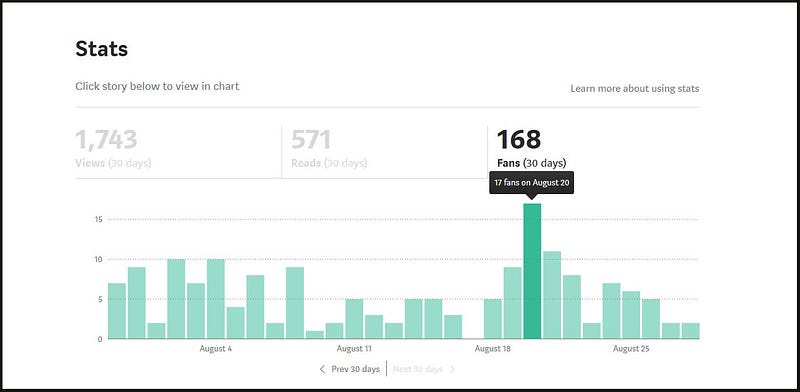
Not many Fans, I know 😢 but never mind. One Fan is a good Fan and a Blessing! 😃 The most Fans I ever had was a total of 32 Fans for all of my Stories to date on June 8th, for “The Point of No Return.”
The Medium Enhanced Stats shows that on that day, June 8th, 37% of all Reads of my Stories were reads of “The Point of No Return.” More about this “metric” or Stat a bit later.
Note, that if you click on any Story Title on your Medium Stats Page, it will take you to what’s called the “Details” page for that Story.
The Details page gives the cumulative number of Views and Read Ratio for that one Story, and the Life-time Earnings, to date. The Graph on the Details page will show you the Sources of Views, either from external sources or Medium generated.
Recall that you can get information from Medium about what their Stats mean, including the Details page, at this link HERE.
Did you know that when you have a Story open, you can click on the little “cog” then on View stats, to get to the Details page?

Now, BELOW is what you will see if you successfully install the “Medium Enhanced Stats” extension or add-on for the Chrome browser.
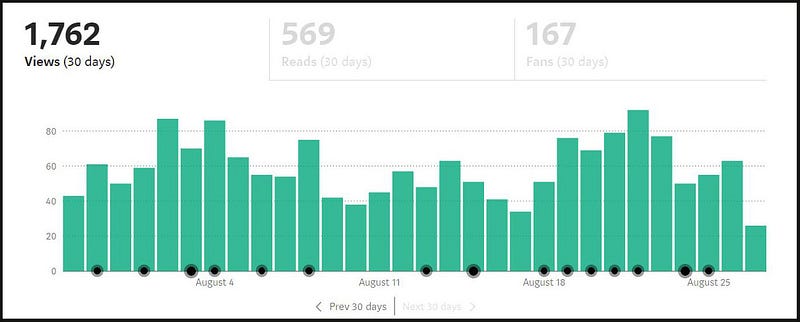
Lookee here! 😲 The black dots or circles indicate days on which you published a Story (whether in a Publication or “self-published” on your own “timeline”or Profile page). Howzat…!
I really like this feature because you can easily look for Stats of interest to you on the days that you had a Story published. At one glance, you can see how many Stories you have had published over 30 days and when (what date) and at what rate, like 1 a day or 3 a week.
From this Chart style, you may see that if you don’t keep up the momentum of publishing say 3 to 5 Stories a week, the Views of any of your published stories will drop.
Hover your mouse over any of the black/gray dots/circles, and the Title of the Story (or Titles of the Stories) published that day, will pop up!!
If you use the Medium Enhanced Stats add-on, you will see a nice variant or variation of your Stats added to the Table on your normal Medium Stats Page, meaning that extra Stats will magically appear (well, they are programmed to appear by a clever person, but it seems like magic to me).
The extra Stats are:
- Number of Claps per Story
- Fans Per Reads Ratio
- Claps Per Views Ratio
- Claps Per Fan Ratio

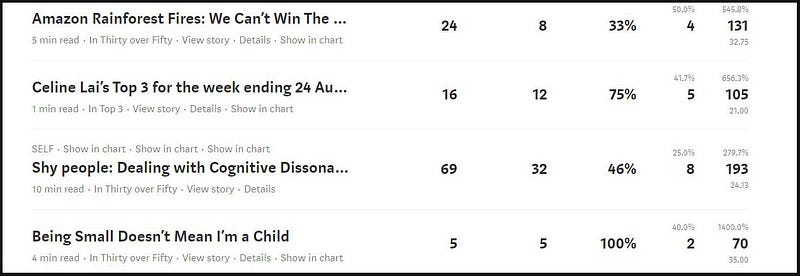
You can see that the number of Claps is included, and this is terrific if you love your Stats, because although Medium sends you out a “weekly” email about your Stats (as long as you have receipt of emails from Medium turned on under your Settings), such emails do NOT include Claps!
You can sort any of the Stat columns by clicking on the Heading, but be aware that the Medium Enhanced Stats (MES) only applies to, or gives percentages for the most recent 100 Stories, and sorting from highest to lowest, or vice versa, may not work well with the Claps stat.
It would be better for you to sort the Claps column by downloading the data using the MES and using a spreadsheet programme to sort the number of Claps. See the later section in this article about working with Excel.
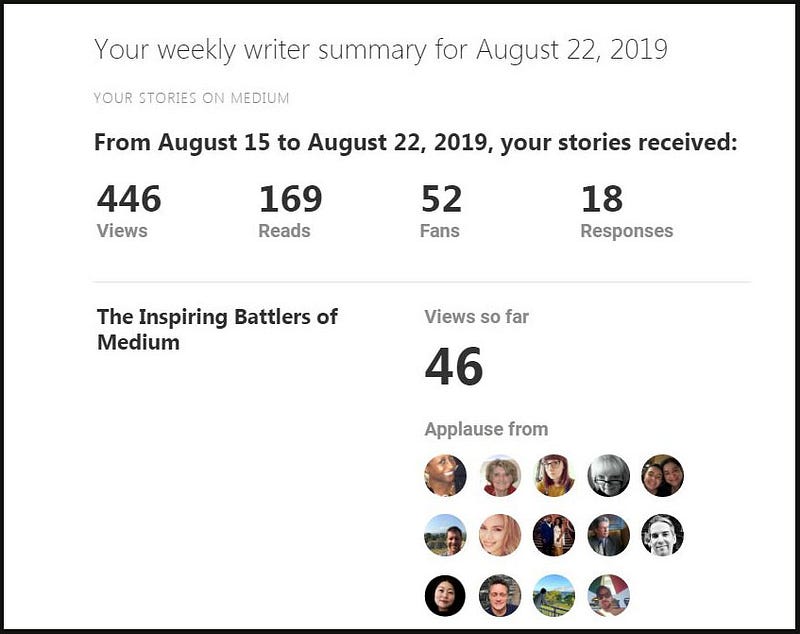
If you MUST know what the Emails from Medium look like (which are titled “Stats for your Stories”, here is a snippet from one of the (irregularly sent) emails that Medium sent to me. If you can count the number of “Avatars” you will find that the Story below had 14 fans.
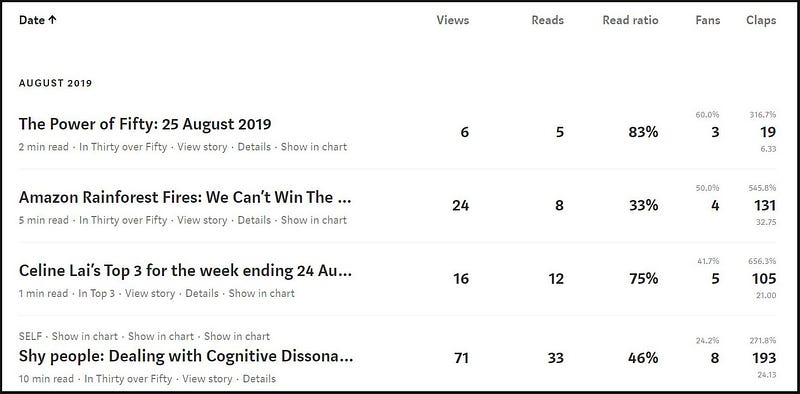
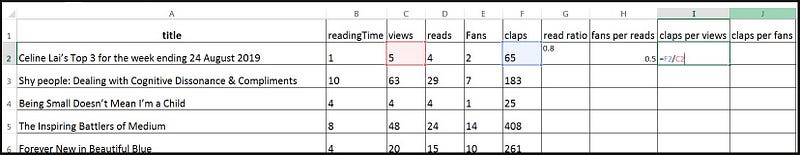
Now, onto what the Enhanced Stats are. If you hover your mouse over the percentages, once you have “run” or used the Medium Enhanced Stats Extension, a text box will pop up telling what that Stat is. Below is a graphic that I created myself to show you labels for the extra (enhanced) stats that the extension provides. 😃
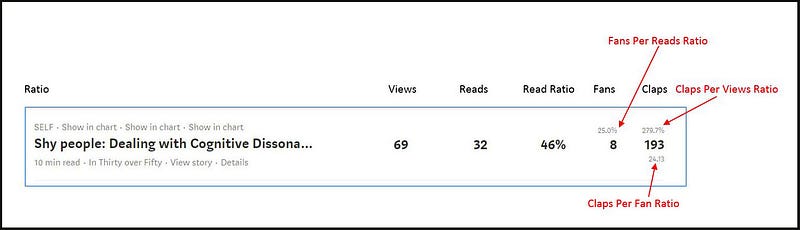
Yes, in case anyone was wondering, this Story above, “Shy people: Dealing with Cognitive Dissonance and Compliments” was curated. Your Stats page will show you the Topic Name that a Story is curated under (which means it is “fed” into a Topic page), in this case SELF.
The Story was published on Thursday August 22nd, curated that day, and the stats above applied on August 26, so are cumulative statistics showing 5 days of stats from and including 22nd and 26th August.
P.S. If you have not had a Medium Story curated yet, and would like to know what happens (somewhat) when a Story is curated, I have written about that at the article below.
Fans Per Reads Ratio
If I hover my mouse over the 40% for “Being Small Doesn’t Mean I’m a Child” above the 2 (which is the number of Fans 😒)an explanation “Fans Per Reads Ratio” will appear (then disappear when I move my mouse away). Look at Table Two.

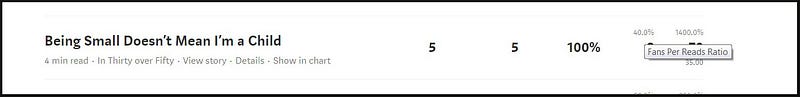
2 divided by 5 is 40%: statistically 40% of the Reads resulted in or yielded 2 Fans. The “dream ratio” would be for this Stat to be at least 100%, meaning one Fan for each Read.
A consolation prize is that the Read Ratio (Reads to Views Ratio), which is provided by default on the standard Medium Stats Page, is 100% 😛 because at the time of writing this, the Story had 5 views and 5 reads. (The number of reads was low, yes I know, but I am happy if there is just 1 read and 1 clap for any of my Stories.)
The number of Fans is important, not just because fans clap or applaud a Story that they like or appreciate, and because Claps translate to payment if you are in the MPP (Medium Partner Program), but because it is a measure of engagement (somebody connecting to you).
Craig Phillips states, in his Story below, that the “Fans Per Reads Ratio” (which he calls the Reads to Fan Ratio) is likely to be low, but is meaningful.
To me, “low” would be a ratio of less than 50% and I agree with him that this ratio is meaningful, in terms of wouldn’t a Medium writer want all people who take the time and effort to read right through their Story (Readers) to clap or applaud the Story also (thus showing they liked it enough to applaud it)?
I’m happy to report that of all the 100 most recent Stories that I have published to the date of writing this, hardly any of the Fans Per Reads Ratios have been lower than 50% and to me, that is great!
It means that of all the number of reads (a measure of how well written and interesting a Story is — enough for a person to read it right through), at least half the number of Readers is a Fan for that story. 😃
If a Reader does not clap for a Story, this may be because she/he did not get enough value from the Story to actually clap for it, OR the person just couldn’t be bothered clapping (yes this is possible), OR the reader didn’t have time to clap or didn’t know that she/he could clap for it (yes, both of these are possible).
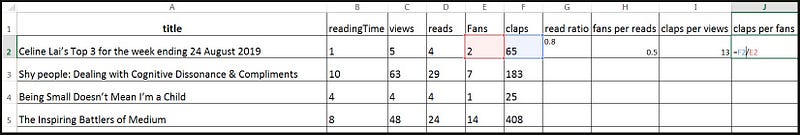
Claps Per Views Ratio
Scroll back up to Table Two and you will see 1400.00% above 70 of which 70 is the number of Claps for the Story, “Being Small Doesn’t Mean I’m a Child.”
This percentage is the Claps Per Views Ratio or the percentage of views equal to the number of claps. The number of Views was 5.
What do you multiply 5 by to get 70? Who knows? The calculator tells me that 5 x 14 = 70.
Aha 😲 100 percent of 5 is 5 and 14 times is multiplied by 100 to get a percentage. In other words, the number of Claps was a whopping 1400 PERCENT times or 14 times more than the number of Views.
However, a high Claps Per Views ratio is not important to me!
This is because the number of Views is a measure of the number of clicks on Story Titles, with the “follow-through” or actual Reads of the Story varying a lot.
I consider a “hit” or a View as the action of a human forager or a curious person who reads a Story Title and thinks “I wonder what this is about, what’s in it for me?” So she/he clicks or views the story, and then may decide “This story is not for me” or “Oh no I made a mistake, I don’t like this story after all,” or “Who cares about this Story, I don’t have time to read this.”
To me, “Reads Per Views” (or Read ratio) as presented as a standard by Medium, is more important. It is, of course, the ratio of the number of Reads to the number of Views.
I think that a high Read ratio (Reads Per Views Ratio) would be considered great or good by anyone interested in Stats.
Craig Phillips and some others consider the number of Reads as a measure of a Story being well written and interesting enough to read right through, but not a measure of engagement (defined as liking a Story enough to clap or comment or highlight, or do a combination of these), as discussed HERE.
Claps Per Views is low in meaning for me, because of my perception of Views as above. This stat is like a well diluted version of Reads Per Views or of Claps Per Reads.
The next stat has a lot more value than Claps Per Views, to my mind.
Claps Per Fan Ratio
The 35 below the 70 is the Claps Per Fan Ratio, which I am more interested in. It is the number of Claps per Fans (not a Ratio but a bare number).
For this example, the Story “Being Small Doesn’t Mean I’m a Child” had 2 Fans and as the number of Claps totalled 70, the average number of Claps per 2 Fans is of course 35.
Having said that I personally find the Claps Per Fan Ratio more meaningful than Claps Per Views, still, Claps Per Fan is another Stat or Metric which I think does not count for as much as some people think, unless the average is the Golden Fifty.
If your Story averages 50 claps per Fan, i.e. the Claps Per Fan is 50, that will mean that every Fan who clapped for your Story gave it the maximum number of Claps allowed to be given to one Story, which is 50.
I have been writing on Medium for just over 9 months now and of the 100 most recent Stories that I have had published on Medium, to date, the highest number of Claps Per Fans for my Stories, was 37 (claps per fans) for a Story that had 6 Fans.
My advice, however, is not to get “hung up” or stressed over this Stat.
The reason for this is that it a cold, hard statistic, being an average; but a person is not an “average person”.
Sure, this stat can indicate the “highness” or the “lowness” of the total number of Claps, for example, if the number is 37 then you may feel satisfied, thinking without looking at further stats, that your Story got at the very least 37 claps from one Fan.
If it is 10 or lower, you may feel less satisfied and peer at the figures for the number of Fans and the total number of claps. Perhaps the Story had 4 Fans who gave claps thus: 37, 1, 1, 1 thus a total of 40 claps divided by 4 Fans giving an AVERAGE of 10 claps per Fan.
BUT lookee here! One good Fan gave 37 claps!! Hurrah. 😃
Honestly, each one of us is unique and special and Medium writers may go a little troppo looking at what the number of Claps by one Fan or by all Fans means to their MPP payments and / or to their reputation or writing prowess.
I agree with Craig, in the aforementioned Story, about making sense of your Medium stats, that the number of Claps given out by any one Fan is personal, and thus a Medium Writer really can’t attribute an exact weighting of importance or a payment distribution proportion to the number of Claps by one person.
That is, unless you have time on your hands to spy on the Fan and study their clapping habits, and ask them for the number of Claps they have given for the Stories they clapped for; and ask them what date they became a paying member, as their payment distribution may start from the date they started paying, not from the 1st of that month or the next month.
As a purely “vanity” metric (meaning something to make me feel good about myself) I would love this Ratio to be 20 or above for every one of my Stories!!
Some Medium writers get really upset when a reader only gives one clap for their Story, but the reason for this could be that the reader is new to Medium and not aware that they can give more than one clap, or it is a “token” clap (maybe an attempt to drive traffic/visits to the clapper) or it is a “courtesy/sympathy” clap (i.e. you have shared your Story on social media and somebody feels sorry for you and gives one clap).
I also don’t like the token clap or the courtesy clap and would like more than one clap from a Fan; however I have learned not to get outraged or indignant if the above happens, because you can’t stop it from happening.
Plus, a Clap is a clap, so why not accept that and be satisfied with others noting the clap and it contributing toward your MPP (Medium Partner Program) payment, if you are in the MPP?
Which is Best, and What about “Claps Per Reads”?

To my mind, if the aforementioned Claps Per Views is equal to 100% or more, meaning the number of Claps is equal to the number of Views or more, then I will feel happy.
But I wouldn’t get upset if this Ratio is below 100, for the reason given above.
If you do see a Story with the number of Claps less than the Views (the Claps Per Views Ratio being less than 100%) as for only Story out of the most recent 100 Stories that I have had published, shown below (“The Final Quarter: A Documentary Film Review”), I recommend that you look at the Read Ratio (Reads Per Views, provided by default by Medium) and the Fans Per Reads, and calculate the ratio of Claps to Reads or “Claps Per Reads Ratio” for yourself.
For the example Story below, “The Final Quarter: A Documentary Film Review”, the Read Ratio was 27%, and the Story received at least 1 clap per read, but not 2 claps per read, which is the Claps to Reads Ratio (which neither Medium or the Extension provides).
In this example, the Claps to Reads Ratio for the Story “The Final Quarter: A Documentary Film Review” is calculated by dividing 16 (the number of Claps) by 11 (the number of Reads) : 16 / 11 = 1.45 or 145%.
The Claps Per Reads Ratio is 145% or the number of Claps is 145% the number of Reads.
The Claps Per View Ratio is 39.0% (shown in the Table) calculated as 16 / 41 or 0.39 x 100 . This means that the number of Claps is 39% of the number of Views.
I do not care, I do not ←- the low Claps Per View do not matter to me, as the number of Claps to Reads was 100% plus! Also, the number of Fans Per Reads was 27.3% which to me, is acceptable.

I conclude that the Story above is a good one because it has 3 Fans and the number of Claps is more than the number of Reads (i.e. the Claps Per Reads Ratio is above 100%), and the Read ratio was at least 20%.
Also, in my books, even one Fan is a measure of engagement or appreciation of a Story. 😺
Footnote: Regarding the Story above, it looks like not many are interested in reading a Documentary about racism and an indigenous Australian Football player!!
Tom Kuegler, who has a website with lots of tips for Medium writers, states that the Read Ratios for his Medium Stories average 40 to 45 percent, and a 50 percent Reads to Views Ratio (Read Ratio) is a “miracle”.
The Read Ratio of 27% for my Story above is not too bad, I conclude. If I look at 40% being satisfactory then 27% is nearly 30% or roughly 3/4 of the way to 40%.
If the Read Ratio was below 20 percent, along with a low Claps Per Views Ratio and a low Claps Per Reads Ratio, then I would be concerned that the Story was not at all suitable for Medium readers.
If you are interested in what another wise one thinks about the usefulness of the various Statistics, please read the excellent article by Ryan McCready below!
To sum up, the number of Fans, the Read Ratio and the total number of Claps (not the Claps Per Fans Ratio) are most important statistics to me!
Show in Chart
Now this is a gem of the Medium Enhanced Stats Extension, in my mind! 😃
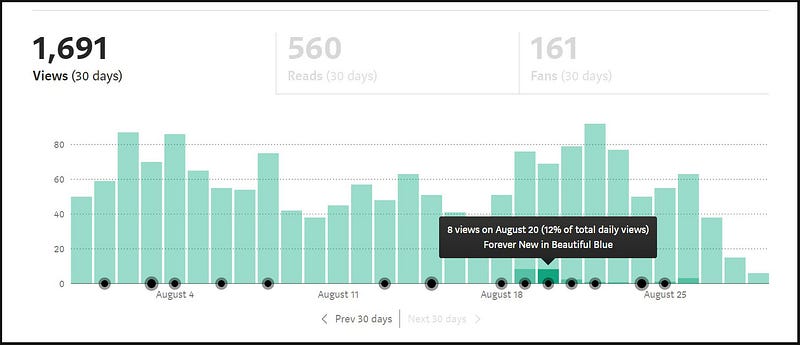
Look at Table Two on this page and you see “Show in Chart” next to each Story. The example Chart below shows what happens when I have Views selected for the category of Statistics for the whole chart, and I clicked on the Story Title “Forever New in Beautiful Blue.”
The Story was published on 19th August and the darker green area shows the proportion, 12%, of the total Views for all of my Stories published on 20 August, which were Views of this Story. ( You can also see the daily number of Views for a Story by clicking on “Details” next to the Story Title on your Medium Stats page.)
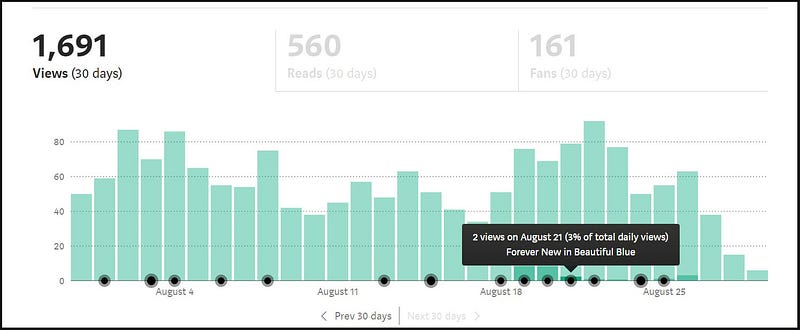
The proportion was 11% on the date of Publication and ranged from 3 to 5% of total daily Views over the 5 days after 20 August.
Wherever you see the darker green area, you can hover your mouse over it, to read the number of Views of the Story in question and the proportion of daily Views for that Story!!
.
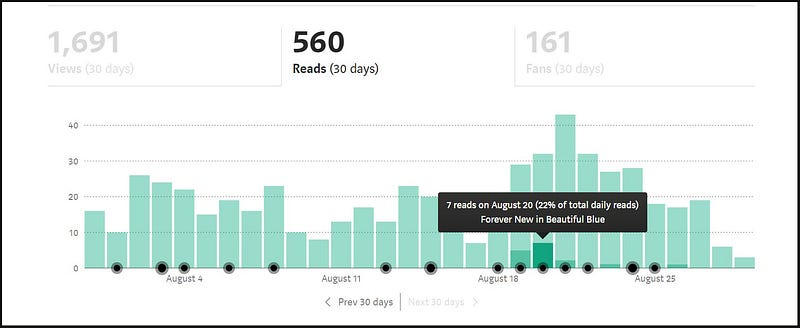
The magic doesn’t stop there. 😄
You can click on the greyed out Reads “label” or on the greyed out Fans “label” and see the number of Reads for the Story or the number of Fans, per day that Reads or Fans occurred.
After clicking on “Show in Chart” don’t cry if you don’t see any darker green areas in the Bars showing currently. You need to click on Prev 30 days or Next 30 days, and scroll back or forward, to find the dates that apply. (Also remember the MES gives stats for the last 100 Stories only, including Show in Chart information.)
Note: if you hover your mouse over a Story title in the Table, using the Medium Enhanced Stats extension, the Date of Publication of the story will appear! This comes in handy if you want to use “Show in Chart.”
Just an additional note here, if you are wondering which other Stories were viewed or read on any of the days that the Story you are looking at, was viewed or read; the answer is that the Graph will not show this automatically.
I mean, your best way of finding out is to go to the Story Titles of the Stories published around the same date as the Story you are looking at, then click on “Show in Chart” which may show Stats for them on the same day as the Story you are currently looking at.
You can also look at the Details page for your Stories and note whether there are Views of the Story on the day that you are looking at / interested in.
Save your Enhanced Statistics
The Medium Enhanced Stats extension will let you download or save a nice little graphic showing statistics for your 100 most recent Stories.
Have your Medium Stats page open, then click on the small black M on the green background, shown below next to the Star. This icon will appear at the top right of your browser screen after you have installed the MES add-on.

Clicking on this icon will make a graphic similar to the one below pop up in the top right corner of your computer screen.
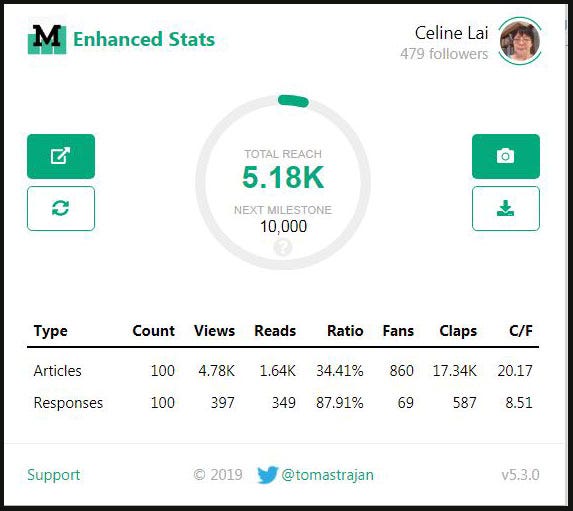
My last 100 Stories have averaged a 34% Reads Per Views Ratio (which is not bad I think, given I am not a celebrity or a famous Medium writer making lots of money from Medium, or a Medium guru with a lot of referrals) and the overall Claps Per Fans Ratio (C/F) is 20.17 claps per Fan (which I am happy with, statistically speaking).
Note: the information includes stats for the most recent 100 Responses or Comments, for which the Claps for these are not used by Medium to determine the MPP payments.
If you use Medium’s “Download your data” function under your Settings, you will find Responses or Comments mixed up with your Stories; meaning that Responses/Comments are treated as Stories by Medium and both together will appear in the “Posts” section of your Medium Download, as shown in an article that I wrote, which you can read here.
Click on the camera icon (picture) to download or save the graphic to your computer as a .png file ( it will be saved to the Folder that you have set up for your Downloads to go into, e.g. your folder titled “Downloads”).
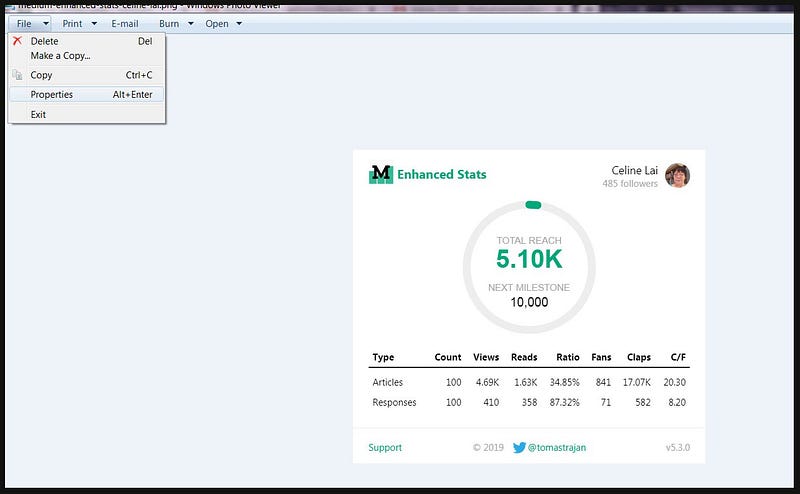
You will see the file details/name at the bottom of your screen, as shown below. Click on “medium-enhanced..png” to open the Graphic.

If you have no clue where it was saved to, you can do some “digging” to find that out, e.g. if you used Windows Photo Viewer to open/view the graphic, you can click on File then on Properties, which will reveal the Folder Path. You can also go to File then Save / Save a Copy to save it to the Folder which you want it to be in, for easy future access.
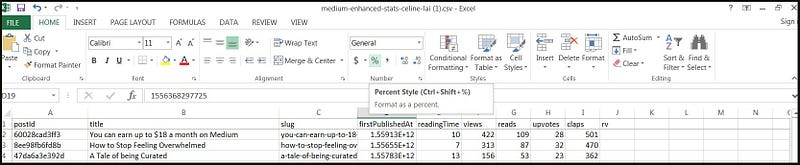
Click on the green downward pointing arrow underneath the Camera icon, to save a .csv file of your Medium Enhanced Stats to your default folder. You will see the file details/file name at the bottom of your screen, as below.
Click on the file title (shown above) and if you have Microsoft Excel or another spreadsheet program on your computer, the file will open, showing a conglomeration of data packed together untidily, which may give you a fright.
Do not cry though, because, I, your friendly Medium neighbour whom loves to write technical instructions, will soon guide you through how to make this information appear nicely! 😄
Gimme the Medium Enhanced Stats Extension now !!
You will have to install the Chrome Browser if you haven’t already got it on your computer. I use both Chrome and Mozilla Firefox, and actually I prefer Firefox to work on my Medium stories, but I go to Chrome to look at my Stats.
Just do an internet search for “Chrome download” and save the latest version to your Desktop PC and run the executable file/program to launch Chrome.
Then go to the page below and follow the prompts from there.
Do not worry if you are suspicious about what will happen to get this Extension running, as I have a confession to make.
I thought that I would try out this Extension (sight un-seen, meaning that I could not find a single article about how this extension practically works, and that is why I am writing one now).
So I went about following the instructions, but then I got worried, and thought “Wait a moment, I don’t like this.” Call me old (as I turn 56 on the 14th September) and cautious about computer programs, and you would be correct.
I thought that I stopped the installation of the Medium Enhanced Stats (MES) extension, but the next day when I went to look at my Medium Stats using Chrome, hey presto, the MES was running like a dream! In other words, I assure you that running it does not blow up your computer or otherwise interfere.
Saving and Tweaking your Medium Enhanced Stats
After installing the MES, download your data, as described above. 😃
Know that the data is saved as a .CSV File and that C S V means Comma Separated Value.
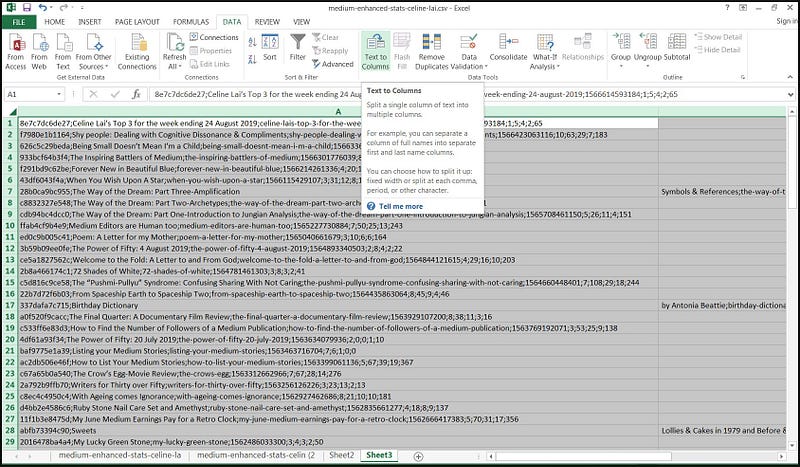
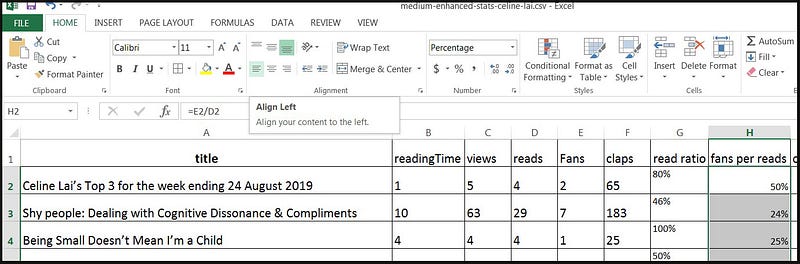
To nicely table out your data, as shown in the screenshot at the very top of this article, you will need Microsoft Excel or another Spreadsheet program that you can use, to “manipulate” (work with/amend) the data.
Below is a link to alternatives to Excel, including some programmes which are free to use.
The rough/raw data will look like the following. 😒
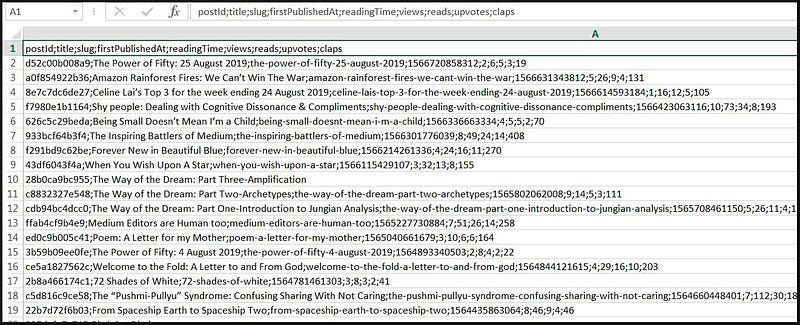
Here’s what to do to get it polished!
Convert the data to a Table (for use with Microsoft Excel)
Note: your data may be in two columns, A and B, but just select and work with column A. The 2nd column B may contain sub-titles! Either highlight the first Column, Column A, or delete Column B.
Highlight Column A by positioning your mouse above the data in column A — so position your mouse where it has A and a little black down-ward pointing arrow appears. Left-mouse click to highlight column A.
If you want to delete column B, highlight it and right-click and click on Delete.
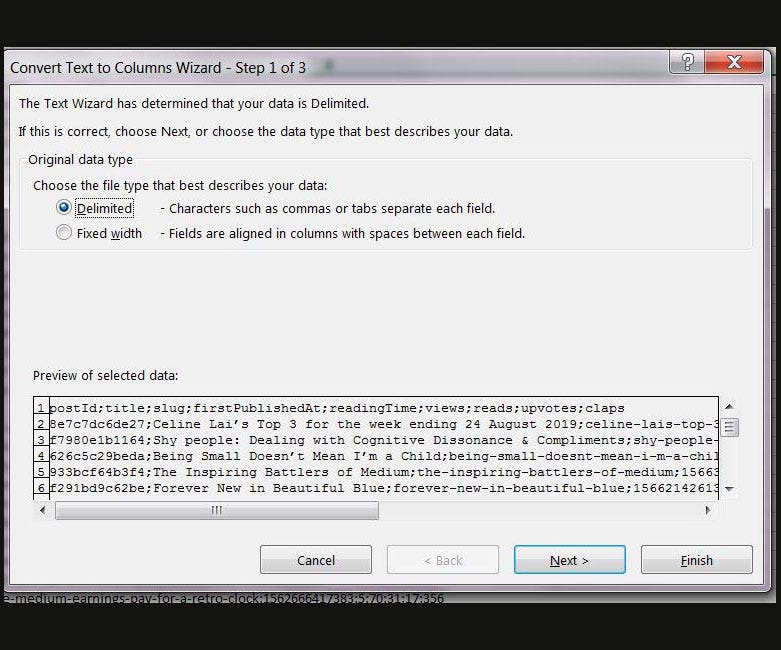
Once you have highlighted column A or deleted column B and highlighted column A, click “Text to Columns” under the Data tab.
Have Delimited selected and press Next.
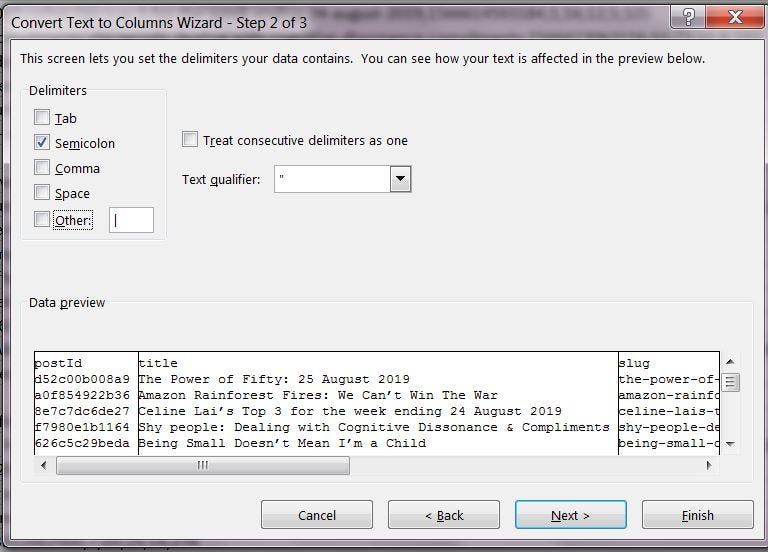
Have Semi-colon selected and press Next.
Have General selected.
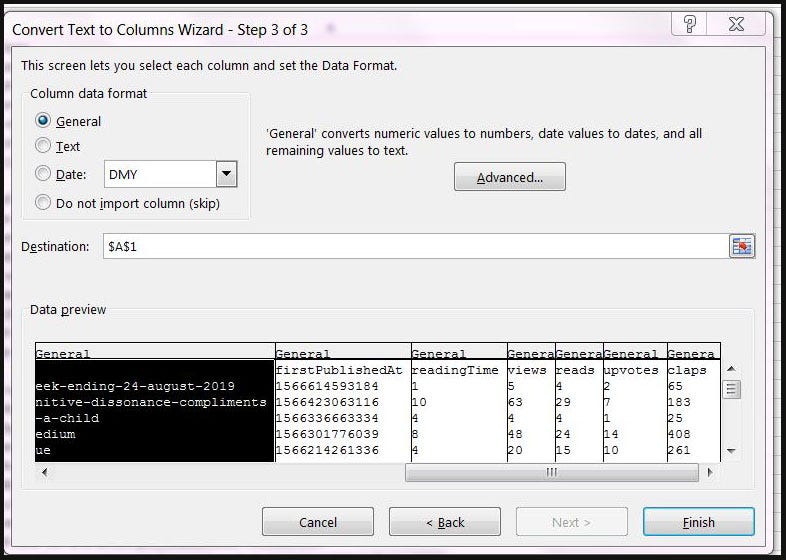
Press Finish. Save as an XLS or XLSx file (choosing Excel document in the file type option when saving).
This will generate some sort of Table with the data split up into 9 columns, as shown below, but note that your column widths may need to be adjusted in order to see all 9 columns.
Column A may go right across your screen (as it did for me), but DON’T cry if this happens to you.
Just carefully place your mouse between column A and column B (minimise the data and scroll to the right if you have to) in the Row with the Letters — — at the exact junction between column A and B (position your mouse on the vertical line between A and B) and drag your mouse to the left to lessen the width of Column A.
Once you have pushed and pulled and coaxed the Columns into behaving, you should be delighted at what you see.
In my great opinion, I do not care about Columns A, C or D.
Together, Columns A and C make up the URL (Uniform Resource Locator) or Web Address for the Story, which I am not interested in.
Column D titled “firstPublishedAt” refers obscurely in “code” to the Publication Date of the Story (and if you can decipher what 1.56672E+12 means, please let us know in a Comment).
Update: More on this Stat at the end of this Article.
readingTime is the estimated reading time in minutes for the Story (as shown at the top of each story). Upvotes is the number of Fans. 😃
You can add Borders to your Table, shown below for Excel. I recommend using Calibri 14 for the Font Type and Font Size. You can press the Ctrl and A keys at the same time to highlight all the data, then change the Font name and size.
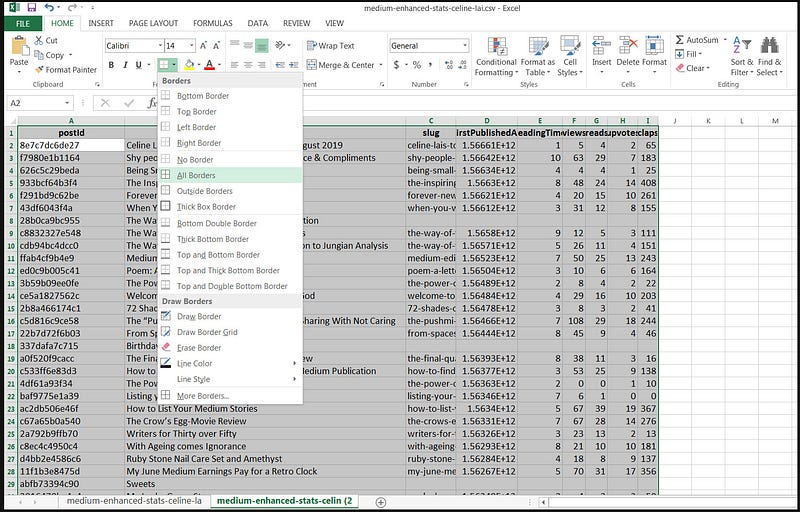
I deleted Columns A, C and D. In Excel, you can this by highlighting the Column by placing your mouse in the Column letter heading, e.g. next to A so that a downward pointing arrow appears and the heading turns green, then clicking the mouse button, to highlight the Column in grey. Then right-click and left-click on Delete.
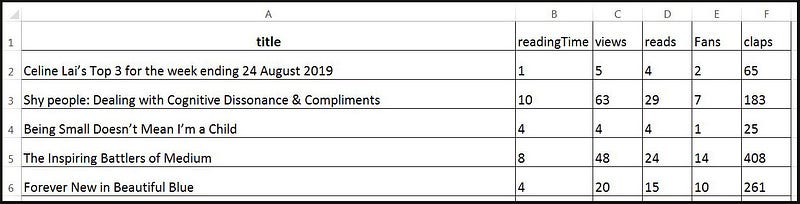
I clicked in the field with upvotes and over typed it with Claps.
This is what my Table looks like. 😃 The Stories are ordered by publication dates, the latest at the top, at the time I took the screenshot.
Add Columns for the Read Ratio and Other Ratios
Last but not least, if you are a quadruple Virgo, as I am (i.e.with 4 “Planets” in Virgo, making you prone to loving data and details), you may like to add a column for the famed Read Ratio (and other Ratios), to your Table!
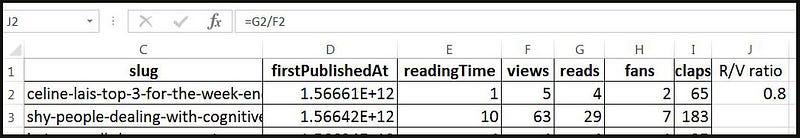
- Add a column for Read Ratio by first naming the Column after Claps, or wherever you want the Column; in this case, I have named Column J shown below as R/V ratio. Type in R/V or Read Ratio or whatever makes sense to you.
- Position (click) your mouse in the first data cell, in this example, shown below J2. Type in the required Excel formula, e.g. in this example =G2/F2 (but using the “Column by letter” divided by “Row by number” which applies to your Table) noting that this means an instruction to Excel to “return data equal to the answer after taking what’s in cell G2 (which is 4) and dividing it by what’s in cell F2 (which is 5). As this translates to 4/5 which is 8/10 or 0.8 the magic result appears in line 2, column J, as 0.8. Howzat!
3.Now you have to make the Formula carry over to all lines, or apply it to all of your Stories. To do that, CLICK in the first cell with the data for the Read Ratio, in this example, click in J2 where 0.8 appears.
Move your mouse to the lowest right corner until a thin + plus comes up, press your mouse button and keeping the mouse button depressed, drag all the way down to the bottom of your Table (or the end of your data rows), then let the mouse go.
Sorry, I don’t have a screenshot of this, because the Paint programme can’t capture an “animation” or action; but I’m sure you will work it out: as the “magic” appears and the formulas apply, the results will appear in the R/V column. To make up for not having a screenshot….here is a picture of a cute mouse instead.

This will fill in the behind the scenes formula for each Row ! Note, they may appear as decimal numbers, as shown below, for fans per reads.
To convert the dot numbers to percentages, highlight the Column and click on the % symbol under the HOME page, as shown below.
To sort by highest number to lowest number in Excel
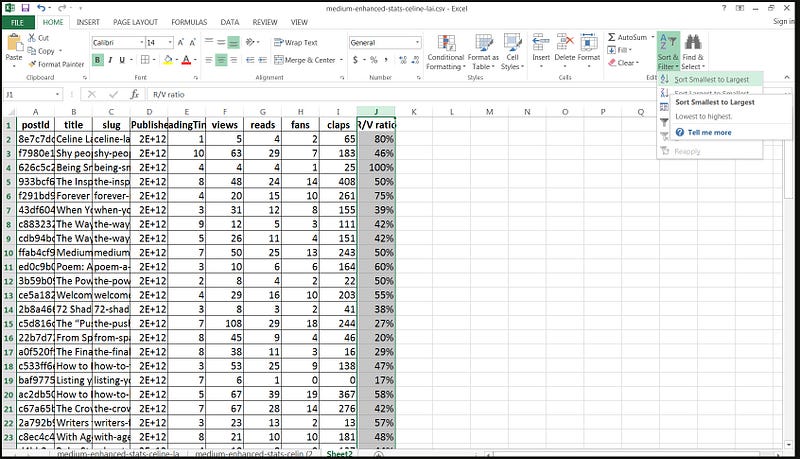
4. To sort by highest R/V to lowest:
Highlight the R/V column by positioning your mouse in the letter (in my example the column J) for the column heading for the data for your Read / Views figures, until a black downward pointing arrow appears.
Left mouse click, which will highlight or select that column.
Click the small arrow under Sort & Filter under the Home tab, shown above.
Click on “Sort Largest to Smallest” or “Sort Smallest to Largest” whichever you want.
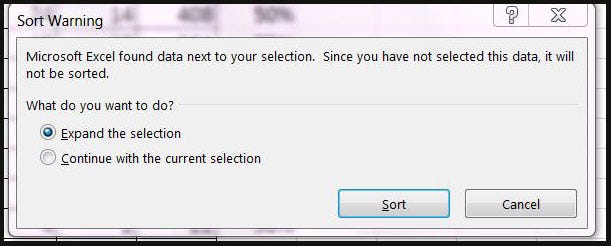
Click on Sort when Expand the selection pops up.
You can sort any of the other Columns in your spreadsheet table( for example, the Claps column ), by following the Steps above for that column. There are other ways of sorting, but the above is the “fail-safe” method for me (as I’m not good at Excel, but I like writing technical instructions and have done a lot of such, which have helped people a lot).
To left align the data in the columns, using Excel, highlight the Column and click on the picture of the “little lines aligned to the left” under the HOME tab, and I recommend click on the 3rd icon from the left in the top row of the Alignment functions, to place data at the bottom. 😛
Here is a snapshot of my final beautiful Table, to which I myself and me added formulas for the 4 ratios in colour below. Who knows what data is being ordered in this table? By this time, after working on this article for 3 days, I needed a Bex and a lie-down.
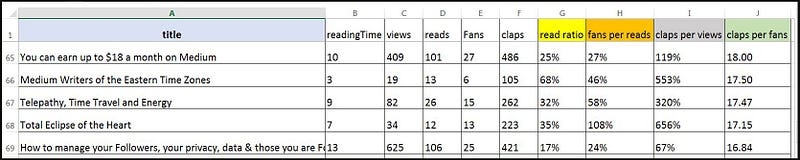
And here are examples of the FORMULAS used for columns G, H, I, and J above. 😺
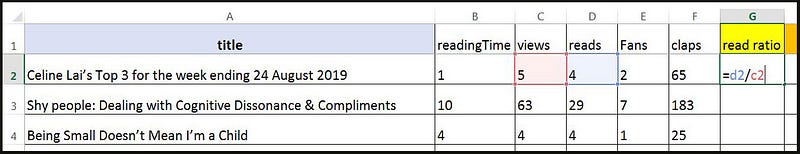
For the Read Ratio enter the equals sign = followed by the Cell Name for “Reads” (which is d2 or column D intersecting row 2) followed by the Division symbol / then followed by the Cell Name for “Views” (which is c2 or column C intersecting row 2). Excel will kindly colour the cells for you.
Don’t forget to then carry over the Formulas to the rest of the Rows, as per the instructions earlier in this article, in Point 3 above the Mouse, in the section headed “Add Columns for the Read Ratio and Other Ratios.”
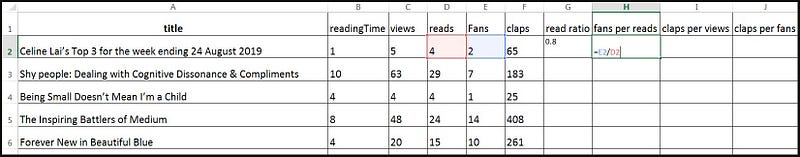
For the Fans Per Reads Ratio, for this example, enter the equals sign = followed by the Cell Name for “Fans” (which is E2 or column E intersecting row 2) followed by the Division symbol / then followed by the Cell Name for “Reads” (which is D2 or column D intersecting row 2).

Following are the example Formulas for some other Ratios which you can add to your Table, if you like.
CLAPS PER VIEWS FORMULA
👏👏👏👏👏👏👏👏👏👏👏👏👏👏👏👏👏👏👏👏👏👏👏👏
CLAPS PER FANS FORMULA
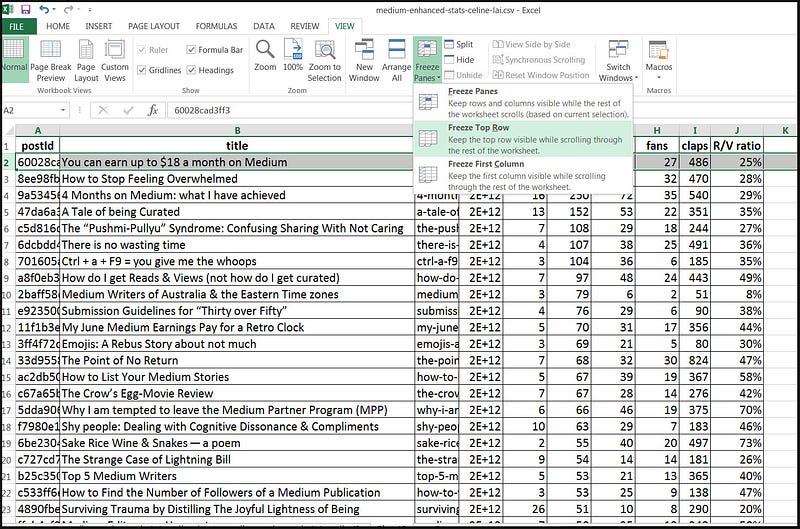
Least but not last (haha) you can freeze or pin the Table Headings in Excel, so that as you scroll down the page, you will still be able to read the Headings for all of the columns!
To freeze the top row and thus keep the headings in view “frozen” or pinned at the top while you scroll down your list — very handy to know which column means what as you peruse your large list, follow the instructions below!
Click on the View tab. Click the arrow next to Freeze Panes.
Click Freeze Top Row. It doesn’t matter where you mouse cursor is. After that, as you scroll down, you will still be able to see the Column Headings.
If you made it this far, congratulations! 😺 😃
A clever and kind Medium writer has told me this about the Published Dates
The Dates are in a Unix Timestamp relative to Epoch Time (01/01/1970). You can create a formula in a column that pulls in the imported timestamp and converts it to a usable date. If you double-click on an Excel cell containing a weird number like “1.64+12” this will expand the data to a string of real numbers, i.e a Unix timestamp.
You can also highlight the column “firstPublishedAt” (by clicking on the letter for the column, e.g. D) and go to the Home tab. Under the “Number” area, click on the little arrow next to “General” and click on “Number.” (See the screenshot under the section about “adding a Border” above for a screenshot.)
If you see a whole lot of hashes #### in any Excel data cell, don’t cry. Just position your mouse on the right-hand border of the column header, e.g. on the border of the letter D at the top row (which is the column header for Column D), and double-click with your mouse. This will expand the column to fit all the data in! Note, to create the column below you don’t need to expand the data or convert it to a number. You can just leave it as it is, if you want to.
Create a new column next to D if it is the Column with the Publication Date data and then enter this formula: =(D2/1000/86400+25569)+(10/24) Note: the 10 means +10 GMT and you have to find out what Time Zone you were in when you published your Stories. Then you custom format the new column by clicking on General above the percentage (see somewhere above for a screenshot) and changing it to Short Date (or to something or other) to get the local date and time that your article got published.

Thank you for reading! Your appreciation is appreciated. You may be interested in the following Stories.


