
Day 36: 60 days of Data Science and Machine Learning Series
Advanced Regression Techniques with project ( Part 1) …
Welcome back peeps. In the last few posts we saw how to implement regression with 3 projects ( can be found in the link below). In this post we will discuss about advanced regression techniques with a project ( part 1).
Some of the other best Series —
100 days : Your Data Science and Machine Learning Degree Series with projects
Complete Data Visualization and Pre-processing Series with projects
Projects Videos —
All the projects, data structures, SQL, algorithms, system design, Data Science and ML , Data Analytics, Data Engineering, , Implemented Data Science and ML projects, Implemented Data Engineering Projects, Implemented Deep Learning Projects, Implemented Machine Learning Ops Projects, Implemented Time Series Analysis and Forecasting Projects, Implemented Applied Machine Learning Projects, Implemented Tensorflow and Keras Projects, Implemented PyTorch Projects, Implemented Scikit Learn Projects, Implemented Big Data Projects, Implemented Cloud Machine Learning Projects, Implemented Neural Networks Projects, Implemented OpenCV Projects,Complete ML Research Papers Summarized, Implemented Data Analytics projects, Implemented Data Visualization Projects, Implemented Data Mining Projects, Implemented Natural Leaning Processing Projects, MLOps and Deep Learning, Applied Machine Learning with Projects Series, PyTorch with Projects Series, Tensorflow and Keras with Projects Series, Scikit Learn Series with Projects, Time Series Analysis and Forecasting with Projects Series, ML System Design Case Studies Series videos will be published on our youtube channel ( just launched).
Subscribe today!
Tech Newsletter —
If you are interested, you can join my newsletter through which I send tech interview tips, techniques, patterns, hacks — Software Development, ML, Data Science, Startups and Technology projects to more than 30K readers. You can subscribe to Tech Brew :
The data for this project can be found at :
Let’s dive in!
Import necessary Libraries
import seaborn as sns
from matplotlib import pyplot as plt
import numpy as np
import pandas as pd

from matplotlib.colors import rgb2hex
import matplotlib.cm as cm
import matplotlib.colors

sns.set(style="darkgrid")
cmap2 = cm.get_cmap('twilight',13)
colors1= []
for i in range(cmap2.N):
    rgb= cmap2(i)[:4]
    colors1.append(rgb2hex(rgb))
    #print(rgb2hex(rgb))
Load the Data
ht_df=pd.read_csv("/Path to the data file/train.csv")
htest = pd.read_csv('/Path to the data file/test.csv')
Get to know your data
# Get the shape ( rows and columns) of the train data
ht_df.shape
Output —
(1460, 81)# Get the shape ( rows and columns) of test data
htest.shapeOutput —
(1459, 80)# Get the Column typesprint("{} Numerical columns, {} Categorial columns".format( list(ht_df.select_dtypes(include=[np.number]).shape)[1],
list(ht_df.select_dtypes(include = ['object']).shape)[1]))Output —
38 Numerical columns, 43 Categorial columns# Get more information about your datasetht_df.info()Output —
<class 'pandas.core.frame.DataFrame'>
RangeIndex: 1460 entries, 0 to 1459
Data columns (total 81 columns):
 #   Column         Non-Null Count  Dtype
---  ------         --------------  -----
 0   Id             1460 non-null   int64
 1   MSSubClass     1460 non-null   int64
 2   MSZoning       1460 non-null   object
 3   LotFrontage    1201 non-null   float64
 4   LotArea        1460 non-null   int64
 5   Street         1460 non-null   object
 6   Alley          91 non-null     object
 7   LotShape       1460 non-null   object
 8   LandContour    1460 non-null   object
 9   Utilities      1460 non-null   object
 10  LotConfig      1460 non-null   object
 11  LandSlope      1460 non-null   object
 12  Neighborhood   1460 non-null   object
 13  Condition1     1460 non-null   object
 14  Condition2     1460 non-null   object
 15  BldgType       1460 non-null   object
 16  HouseStyle     1460 non-null   object
 17  OverallQual    1460 non-null   int64
 18  OverallCond    1460 non-null   int64
 19  YearBuilt      1460 non-null   int64
 20  YearRemodAdd   1460 non-null   int64
 21  RoofStyle      1460 non-null   object
 22  RoofMatl       1460 non-null   object
 23  Exterior1st    1460 non-null   object
 24  Exterior2nd    1460 non-null   object
 25  MasVnrType     1452 non-null   object
 26  MasVnrArea     1452 non-null   float64
 27  ExterQual      1460 non-null   object
 28  ExterCond      1460 non-null   object
 29  Foundation     1460 non-null   object
 30  BsmtQual       1423 non-null   object
 31  BsmtCond       1423 non-null   object
 32  BsmtExposure   1422 non-null   object
 33  BsmtFinType1   1423 non-null   object
 34  BsmtFinSF1     1460 non-null   int64
 35  BsmtFinType2   1422 non-null   object
 36  BsmtFinSF2     1460 non-null   int64
 37  BsmtUnfSF      1460 non-null   int64
 38  TotalBsmtSF    1460 non-null   int64
 39  Heating        1460 non-null   object
 40  HeatingQC      1460 non-null   object
 41  CentralAir     1460 non-null   object
 42  Electrical     1459 non-null   object
 43  1stFlrSF       1460 non-null   int64
 44  2ndFlrSF       1460 non-null   int64
 45  LowQualFinSF   1460 non-null   int64
 46  GrLivArea      1460 non-null   int64
 47  BsmtFullBath   1460 non-null   int64
 48  BsmtHalfBath   1460 non-null   int64
 49  FullBath       1460 non-null   int64
 50  HalfBath       1460 non-null   int64
 51  BedroomAbvGr   1460 non-null   int64
 52  KitchenAbvGr   1460 non-null   int64
 53  KitchenQual    1460 non-null   object
 54  TotRmsAbvGrd   1460 non-null   int64
 55  Functional     1460 non-null   object
 56  Fireplaces     1460 non-null   int64
 57  FireplaceQu    770 non-null    object
 58  GarageType     1379 non-null   object
 59  GarageYrBlt    1379 non-null   float64
 60  GarageFinish   1379 non-null   object
 61  GarageCars     1460 non-null   int64
 62  GarageArea     1460 non-null   int64
 63  GarageQual     1379 non-null   object
 64  GarageCond     1379 non-null   object
 65  PavedDrive     1460 non-null   object
 66  WoodDeckSF     1460 non-null   int64
 67  OpenPorchSF    1460 non-null   int64
 68  EnclosedPorch  1460 non-null   int64
 69  3SsnPorch      1460 non-null   int64
 70  ScreenPorch    1460 non-null   int64
 71  PoolArea       1460 non-null   int64
 72  PoolQC         7 non-null      object
 73  Fence          281 non-null    object
 74  MiscFeature    54 non-null     object
 75  MiscVal        1460 non-null   int64
 76  MoSold         1460 non-null   int64
 77  YrSold         1460 non-null   int64
 78  SaleType       1460 non-null   object
 79  SaleCondition  1460 non-null   object
 80  SalePrice      1460 non-null   int64
dtypes: float64(3), int64(35), object(43)
memory usage: 924.0+ KB
# Get statistical analysis of train dataht_df.describe()# Get information of test data
htest.info()Output —
<class 'pandas.core.frame.DataFrame'>
RangeIndex: 1459 entries, 0 to 1458
Data columns (total 80 columns):
 #   Column         Non-Null Count  Dtype
---  ------         --------------  -----
 0   Id             1459 non-null   int64
 1   MSSubClass     1459 non-null   int64
 2   MSZoning       1455 non-null   object
 3   LotFrontage    1232 non-null   float64
 4   LotArea        1459 non-null   int64
 5   Street         1459 non-null   object
 6   Alley          107 non-null    object
 7   LotShape       1459 non-null   object
 8   LandContour    1459 non-null   object
 9   Utilities      1457 non-null   object
 10  LotConfig      1459 non-null   object
 11  LandSlope      1459 non-null   object
 12  Neighborhood   1459 non-null   object
 13  Condition1     1459 non-null   object
 14  Condition2     1459 non-null   object
 15  BldgType       1459 non-null   object
 16  HouseStyle     1459 non-null   object
 17  OverallQual    1459 non-null   int64
 18  OverallCond    1459 non-null   int64
 19  YearBuilt      1459 non-null   int64
 20  YearRemodAdd   1459 non-null   int64
 21  RoofStyle      1459 non-null   object
 22  RoofMatl       1459 non-null   object
 23  Exterior1st    1458 non-null   object
 24  Exterior2nd    1458 non-null   object
 25  MasVnrType     1443 non-null   object
 26  MasVnrArea     1444 non-null   float64
 27  ExterQual      1459 non-null   object
 28  ExterCond      1459 non-null   object
 29  Foundation     1459 non-null   object
 30  BsmtQual       1415 non-null   object
 31  BsmtCond       1414 non-null   object
 32  BsmtExposure   1415 non-null   object
 33  BsmtFinType1   1417 non-null   object
 34  BsmtFinSF1     1458 non-null   float64
 35  BsmtFinType2   1417 non-null   object
 36  BsmtFinSF2     1458 non-null   float64
 37  BsmtUnfSF      1458 non-null   float64
 38  TotalBsmtSF    1458 non-null   float64
 39  Heating        1459 non-null   object
 40  HeatingQC      1459 non-null   object
 41  CentralAir     1459 non-null   object
 42  Electrical     1459 non-null   object
 43  1stFlrSF       1459 non-null   int64
 44  2ndFlrSF       1459 non-null   int64
 45  LowQualFinSF   1459 non-null   int64
 46  GrLivArea      1459 non-null   int64
 47  BsmtFullBath   1457 non-null   float64
 48  BsmtHalfBath   1457 non-null   float64
 49  FullBath       1459 non-null   int64
 50  HalfBath       1459 non-null   int64
 51  BedroomAbvGr   1459 non-null   int64
 52  KitchenAbvGr   1459 non-null   int64
 53  KitchenQual    1458 non-null   object
 54  TotRmsAbvGrd   1459 non-null   int64
 55  Functional     1457 non-null   object
 56  Fireplaces     1459 non-null   int64
 57  FireplaceQu    729 non-null    object
 58  GarageType     1383 non-null   object
 59  GarageYrBlt    1381 non-null   float64
 60  GarageFinish   1381 non-null   object
 61  GarageCars     1458 non-null   float64
 62  GarageArea     1458 non-null   float64
 63  GarageQual     1381 non-null   object
 64  GarageCond     1381 non-null   object
 65  PavedDrive     1459 non-null   object
 66  WoodDeckSF     1459 non-null   int64
 67  OpenPorchSF    1459 non-null   int64
 68  EnclosedPorch  1459 non-null   int64
 69  3SsnPorch      1459 non-null   int64
 70  ScreenPorch    1459 non-null   int64
 71  PoolArea       1459 non-null   int64
 72  PoolQC         3 non-null      object
 73  Fence          290 non-null    object
 74  MiscFeature    51 non-null     object
 75  MiscVal        1459 non-null   int64
 76  MoSold         1459 non-null   int64
 77  YrSold         1459 non-null   int64
 78  SaleType       1458 non-null   object
 79  SaleCondition  1459 non-null   object
dtypes: float64(11), int64(26), object(43)
memory usage: 912.0+ KB
# Get statistical analysis of test datahtest.describe()# Check Missing Values Percentagedf_na=[f for features in ht_df.columns if
ht_df[features].isnull().sum()>1]for f in df_na:
print(f, np.round(ht_df[f].isnull().mean(), 4), ' % Missing values\n')Data Visualization
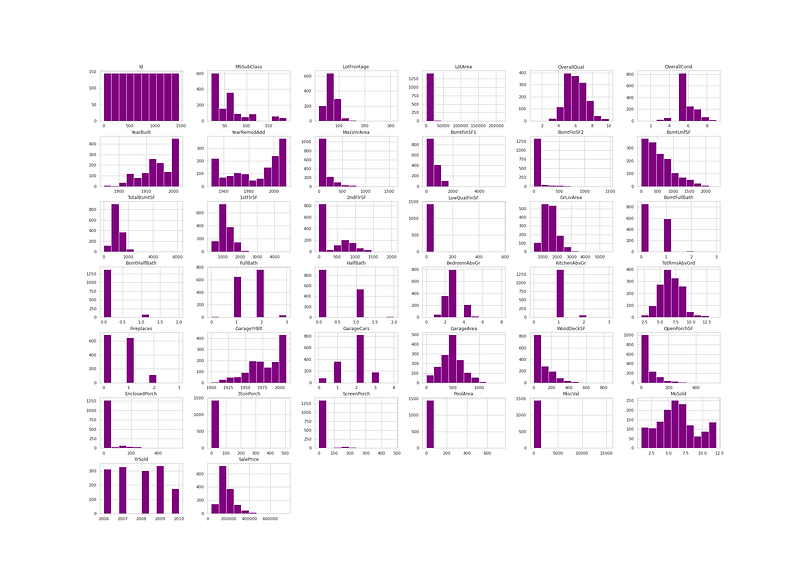
ht_df.hist(figsize=(30,22),color='purple',stacked=True)
plt.show()
Output —
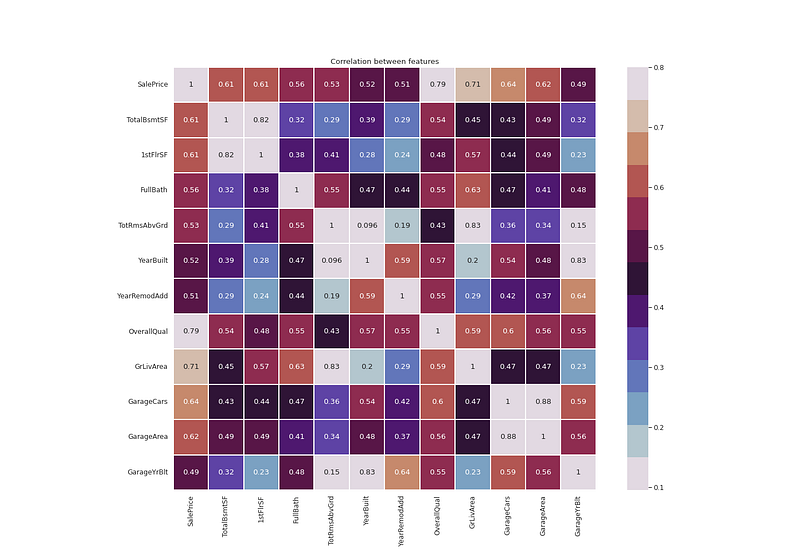
# Build heatmapsns.set(font_scale=1.10)
plt.figure(figsize=(20, 14))
h_map=ht_df[["SalePrice", "TotalBsmtSF","1stFlrSF","FullBath",
"TotRmsAbvGrd","YearBuilt","YearRemodAdd","OverallQual","GrLivArea","GarageCars","GarageArea","GarageYrBlt"]].corr()sns.heatmap(h_map, vmax=.8, linewidths=0.02,square=True,annot=True,cmap=cmap2,linecolor="white")
plt.title('Correlation between features')
plt.show()Output —
# Sale price distributionplt.figure(figsize=(20, 14))
sns.distplot(ht_df['SalePrice'], color='purple', kde=True)
plt.title("Distribution of Sale Price")
plt.ylabel("Number of Occurences")
plt.xlabel("Sale Price")
plt.grid(False)
plt.show()Output —
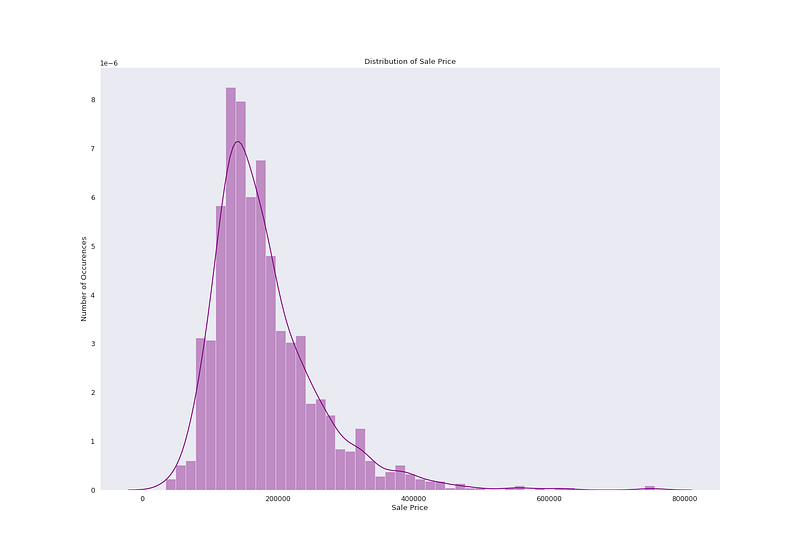
# Check Skewness and Kurtosis
ht_df['SalePrice'].skew()
ht_df['SalePrice'].kurt()
Output —
1.8828757597682129
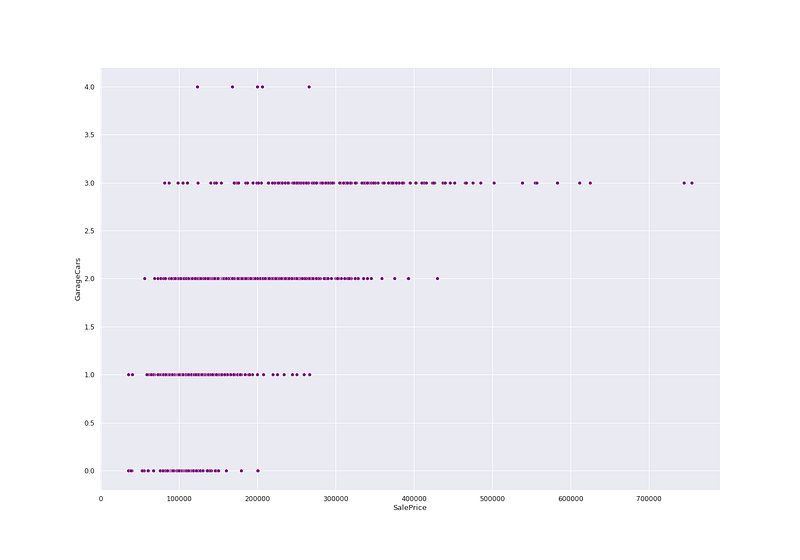
6.536281860064529# Find relation between SalePrice and GarageCarsplt.figure(figsize=(20, 14))
sns.scatterplot(ht_df['SalePrice'],ht_df['GarageCars'],color='purple')
plt.show()Output —
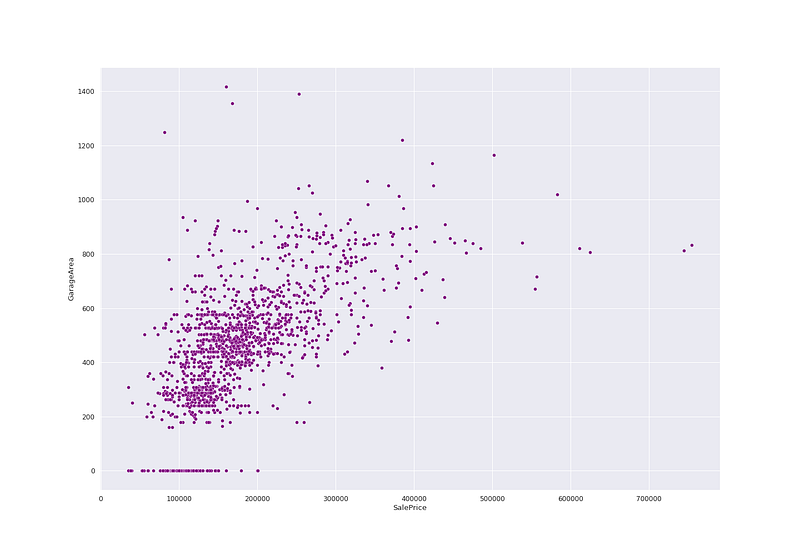
# Sale price vs Garage Area
plt.figure(figsize=(20, 14))
sns.scatterplot(ht_df['SalePrice'],ht_df['GarageArea'],color='purple')

plt.show()
Output —
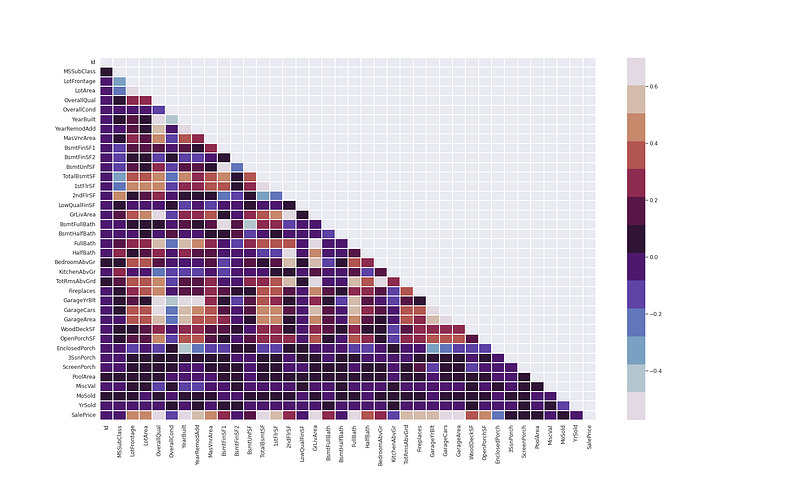
# Calculate correlations
corr = ht_df.corr(method='spearman')
m = np.zeros_like(corr)
m[np.triu_indices_from(m)] = True
plt.figure(figsize=(15, 10))
sns.heatmap(corr,
vmax=.7,
mask=m,
fmt='.2f',
linewidths=.1, cmap=cmap2)
plt.show()Output —
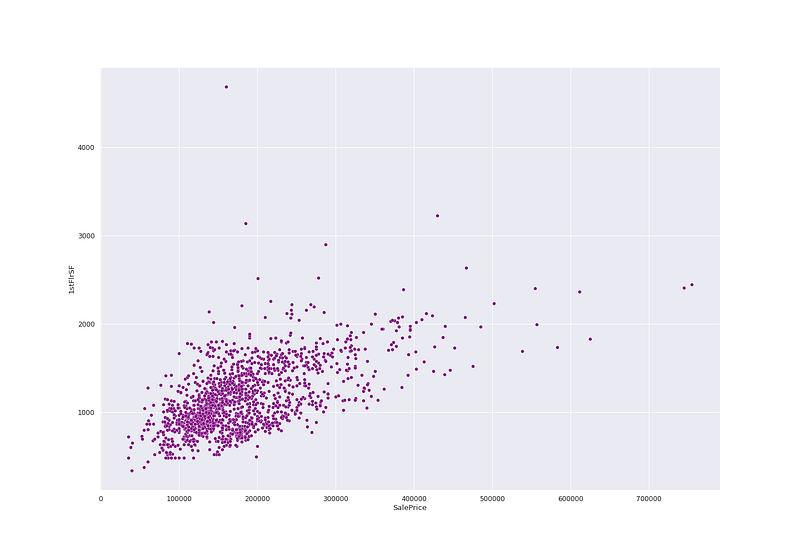
#Sale Price vs 1st Floor SFplt.figure(figsize=(20, 14))
sns.scatterplot(ht_df['SalePrice'],ht_df['1stFlrSF'],color='purple')
plt.show()Output —
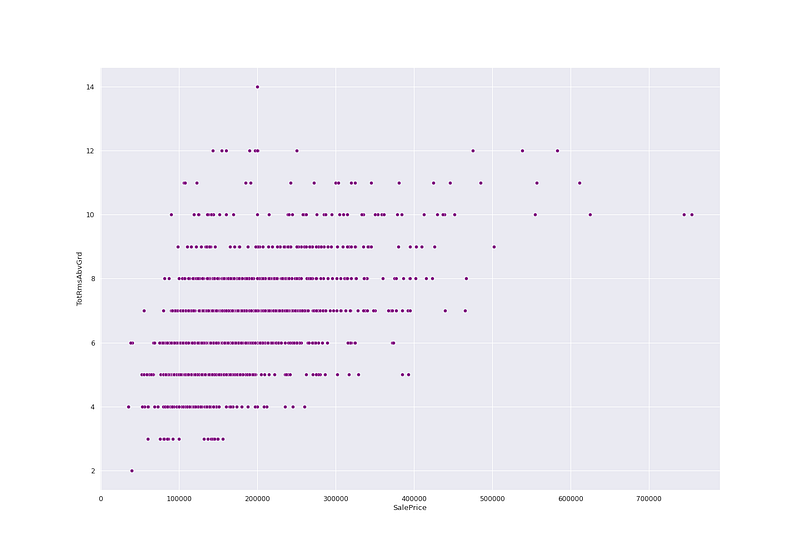
# Salev Price Vs Total Rooms Abv Groundplt.figure(figsize=(20, 14))
sns.scatterplot(ht_df['SalePrice'],ht_df['TotRmsAbvGrd'],color='purple')
plt.show()Output —
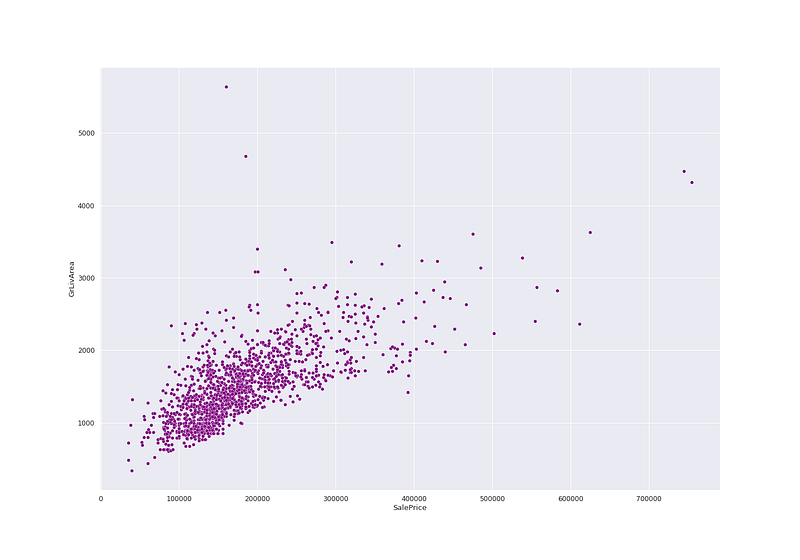
# Sale Price vs GrLivAreaplt.figure(figsize=(20, 14))
sns.scatterplot(ht_df['SalePrice'],ht_df['GrLivArea'],color='purple')
plt.show()Output —
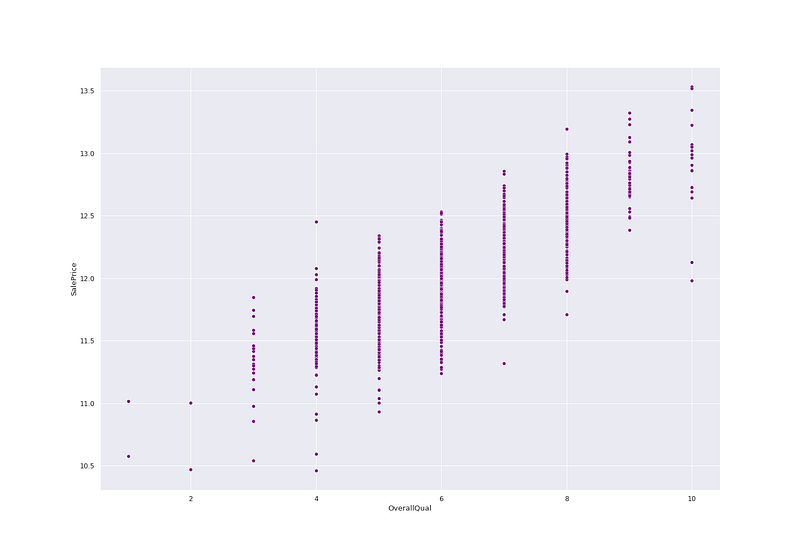
# Sale Price vs OverallQualplt.figure(figsize=(20, 14))
sns.scatterplot(ht_df['OverallQual'],np.log(ht_df.SalePrice),color='purple')
plt.show()Output —
# Saleprice vs Total Bsmt SF
plt.figure(figsize=(20, 14))
sns.scatterplot(ht_df['SalePrice'],ht_df['TotalBsmtSF'],color='purple')

plt.show()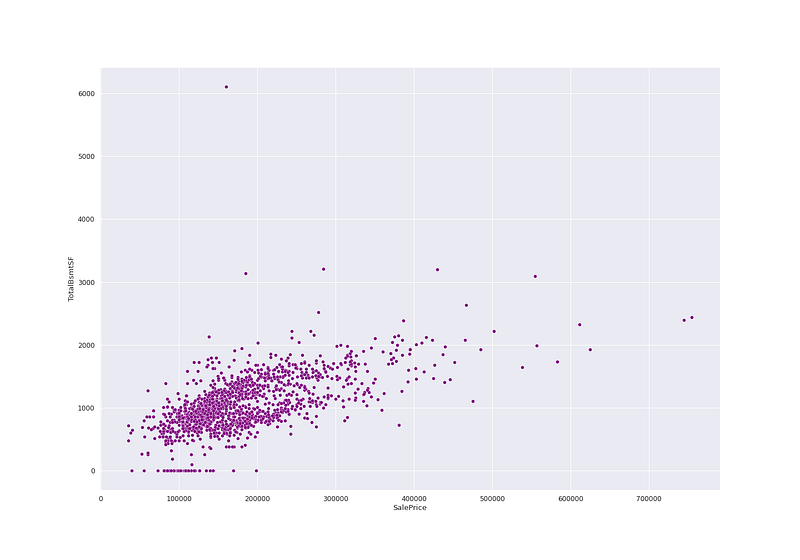
Day 37 : Part 2 of this project : Coming soon!
Follow and Stay tuned. Keep coding :)
For other projects, tune to —
Build Machine Learning Pipelines( With Code)
Recurrent Neural Network with Keras
Clustering Geolocation Data in Python using DBSCAN and K-Means
Facial Expression Recognition using Keras
Hyperparameter Tuning with Keras Tuner
Custom Layers in Keras
That’s it fellas. Peace out and keep coding :)
Stay Tuned and of-course let me end this post with a quote by Steve Jobs ;)
“You have to be burning with an idea, or a problem, or a wrong that you want to right. If you’re not passionate enough from the start, you’ll never stick it out.”


