Free AI web copilot to create summaries, insights and extended knowledge, download it at here
13667
Abstract
aSFdrdpkw.png)"></div>
</div>
</div>
</a>
</div><p id="f5c8">The data for this project can be found in the link below —</p><div id="599b" class="link-block">
<a href="https://github.com/Pikachu0405/Customer-Personality-Analysis">
<div>
<div>
<h2>GitHub — Pikachu0405/Customer-Personality-Analysis</h2>
<div><h3>Customer Personality Analysis is a detailed analysis of a company’s ideal customers. It helps a business to better…</h3></div>
<div><p>github.com</p></div>
</div>
<div>
<div style="background-image: url(https://miro.readmedium.com/v2/resize:fit:320/0*reNDDN-vVqkLW2eX)"></div>
</div>
</div>
</a>
</div><p id="206a">Lets dive in —</p><h2 id="8344">Feature Engineering</h2><div id="7bb6"><pre><span class="hljs-comment"># Grouping Education </span>
<span class="hljs-built_in">df</span>[<span class="hljs-string">'Education'</span>]=<span class="hljs-built_in">df</span>[<span class="hljs-string">'Education'</span>].str.replace(<span class="hljs-string">'Graduation'</span>,<span class="hljs-string">'Higher Education'</span>)
<span class="hljs-built_in">df</span>[<span class="hljs-string">'Education'</span>]=<span class="hljs-built_in">df</span>[<span class="hljs-string">'Education'</span>].str.replace(<span class="hljs-string">'PhD'</span>,<span class="hljs-string">'Higher Education'</span>)
<span class="hljs-built_in">df</span>[<span class="hljs-string">'Education'</span>]=<span class="hljs-built_in">df</span>[<span class="hljs-string">'Education'</span>].str.replace(<span class="hljs-string">'Master'</span>,<span class="hljs-string">'Higher Education'</span>)
<span class="hljs-built_in">df</span>[<span class="hljs-string">'Education'</span>]=<span class="hljs-built_in">df</span>[<span class="hljs-string">'Education'</span>].str.replace(<span class="hljs-string">'2n Cycle'</span>,<span class="hljs-string">'Higher Education'</span>)</pre></div><div id="dd64"><pre><span class="hljs-meta"># Goruping Marital Status</span></pre></div><div id="0fc8"><pre>df<span class="hljs-selector-attr">[<span class="hljs-string">'Marital_Status'</span>]</span>=df<span class="hljs-selector-attr">[<span class="hljs-string">'Marital_Status'</span>]</span><span class="hljs-selector-class">.str</span><span class="hljs-selector-class">.replace</span>(<span class="hljs-string">'Married'</span>,<span class="hljs-string">'In A Relationship'</span>)
df<span class="hljs-selector-attr">[<span class="hljs-string">'Marital_Status'</span>]</span>=df<span class="hljs-selector-attr">[<span class="hljs-string">'Marital_Status'</span>]</span><span class="hljs-selector-class">.str</span><span class="hljs-selector-class">.replace</span>(<span class="hljs-string">'Together'</span>,<span class="hljs-string">'In A Relationship'</span>)
df<span class="hljs-selector-attr">[<span class="hljs-string">'Marital_Status'</span>]</span>=df<span class="hljs-selector-attr">[<span class="hljs-string">'Marital_Status'</span>]</span><span class="hljs-selector-class">.str</span><span class="hljs-selector-class">.replace</span>(<span class="hljs-string">'Divorced'</span>,<span class="hljs-string">'Single'</span>)
df<span class="hljs-selector-attr">[<span class="hljs-string">'Marital_Status'</span>]</span>=df<span class="hljs-selector-attr">[<span class="hljs-string">'Marital_Status'</span>]</span><span class="hljs-selector-class">.str</span><span class="hljs-selector-class">.replace</span>(<span class="hljs-string">'Widow'</span>,<span class="hljs-string">'Single'</span>)
df<span class="hljs-selector-attr">[<span class="hljs-string">'Marital_Status'</span>]</span>=df<span class="hljs-selector-attr">[<span class="hljs-string">'Marital_Status'</span>]</span><span class="hljs-selector-class">.str</span><span class="hljs-selector-class">.replace</span>(<span class="hljs-string">'Alone'</span>,<span class="hljs-string">'Single'</span>)
df<span class="hljs-selector-attr">[<span class="hljs-string">'Marital_Status'</span>]</span>=df<span class="hljs-selector-attr">[<span class="hljs-string">'Marital_Status'</span>]</span><span class="hljs-selector-class">.str</span><span class="hljs-selector-class">.replace</span>(<span class="hljs-string">'Absurd'</span>,<span class="hljs-string">'Single'</span>)
df<span class="hljs-selector-attr">[<span class="hljs-string">'Marital_Status'</span>]</span>=df<span class="hljs-selector-attr">[<span class="hljs-string">'Marital_Status'</span>]</span><span class="hljs-selector-class">.str</span><span class="hljs-selector-class">.replace</span>(<span class="hljs-string">'YOLO'</span>,<span class="hljs-string">'Single'</span>)</pre></div><div id="b224"><pre><span class="hljs-meta"># Grouping Kids</span></pre></div><div id="126a"><pre><span class="hljs-built_in">df</span>[<span class="hljs-string">'Total_child'</span>]=<span class="hljs-built_in">df</span>[<span class="hljs-string">'Kidhome'</span>] +<span class="hljs-built_in">df</span>[<span class="hljs-string">'Teenhome'</span>]</pre></div><div id="7f5c"><pre><span class="hljs-meta"># Campaign</span></pre></div><div id="88f8"><pre><span class="hljs-built_in">df</span>[<span class="hljs-string">'Camp_total'</span>]=<span class="hljs-built_in">df</span>[<span class="hljs-string">'AcceptedCmp1'</span>]+<span class="hljs-built_in">df</span>[<span class="hljs-string">'AcceptedCmp2'</span>]+<span class="hljs-built_in">df</span>[<span class="hljs-string">'AcceptedCmp3'</span>] +<span class="hljs-built_in">df</span>[<span class="hljs-string">'AcceptedCmp4'</span>]+<span class="hljs-built_in">df</span>[<span class="hljs-string">'AcceptedCmp5'</span>] +<span class="hljs-built_in">df</span>[<span class="hljs-string">'Response'</span>]</pre></div><div id="fbe1"><pre><span class="hljs-meta"># Removing Outliers</span></pre></div><div id="e129"><pre><span class="hljs-attribute">df</span>=df.loc[np.abs(stats.zscore(df[<span class="hljs-string">'Income'</span>]))<3]
df.reset_index(<span class="hljs-attribute">inplace</span>=<span class="hljs-literal">True</span>)
<span class="hljs-attribute">df</span>=df.drop(columns=[<span class="hljs-string">'index'</span>])
df.shape</pre></div><p id="32fb">Output —</p><div id="e1e6"><pre>(<span class="hljs-number">2232</span><span class="hljs-punctuation">,</span> <span class="hljs-number">32</span>)</pre></div><div id="370c"><pre><span class="hljs-comment"># Remove unnecessary columns and choose necessary ones</span></pre></div><div id="2bbe"><pre><span class="hljs-attr">cols</span>=[<span class="hljs-string">'Age'</span>, <span class="hljs-string">'Education'</span>, <span class="hljs-string">'Marital_Status'</span>, <span class="hljs-string">'Income'</span>,<span class="hljs-string">'Recency'</span>
, <span class="hljs-string">'NumDealsPurchases'</span>, <span class="hljs-string">'NumWebPurchases'</span>,<span class="hljs-string">'NumCatalogPurchases'</span>,
<span class="hljs-string">'NumStorePurchases'</span>, <span class="hljs-string">'NumWebVisitsMonth'</span>, <span class="hljs-string">'Complain'</span>,<span class="hljs-string">'Camp_total'</span>, <span class="hljs-string">'Total_child'</span>,<span class="hljs-string">'Total_purchase'</span>]
<span class="hljs-attr">c_df</span>=df[cols]</pre></div><div id="8b5a"><pre><span class="hljs-comment"># Label Encoding the Data ( Education and Marital Status Column)</span></pre></div><div id="3dcb"><pre>l=LabelEncoder()
c_df[<span class="hljs-string">'Education'</span>]=c_df<span class="hljs-string">[['Education']]</span>.apply(l.fit_transform)
c_df[<span class="hljs-string">'Marital_Status'</span>]=c_df<span class="hljs-string">[['Marital_Status']]</span>.apply(l.fit_transform)</pre></div><div id="d461"><pre><span class="hljs-meta"># Standard Scaling</span></pre></div><div id="cd56"><pre><span class="hljs-attr">ss</span>=StandardScaler()
<span class="hljs-attr">c_df_final</span>=ss.fit_transform(c_df)</pre></div><div id="afcb"><pre><span class="hljs-meta"># Optimum no of Clusters</span></pre></div><div id="30d9"><pre>l1=<span class="hljs-selector-attr">[]</span>
<span class="hljs-keyword">for</span> <span class="hljs-selector-tag">i</span> <span class="hljs-keyword">in</span> <span class="hljs-built_in">range</span>(<span class="hljs-number">1</span>,<span class="hljs-number">13</span>):
k_mean=<span class="hljs-built_in">KMeans</span>(n_clusters=<span class="hljs-selector-tag">i</span>,random_state=<span class="hljs-number">42</span>,init=<span class="hljs-string">"k-means++"</span>)
k_mean<span class="hljs-selector-class">.fit</span>(c_df_final)
l1<span class="hljs-selector-class">.append</span>(k_mean.inertia_)</pre></div><div id="3837"><pre>plt<span class="hljs-selector-class">.plot</span>(<span class="hljs-built_in">range</span>(<span class="hljs-number">1</span>,<span class="hljs-number">13</span>),l1)
plt<span class="hljs-selector-class">.scatter</span>(<span class="hljs-built_in">range</span>(<span class="hljs-number">1</span>,<span class="hljs-number">13</span>),l1,<span class="hljs-attribute">color</span>=<span class="hljs-string">"red"</span>)
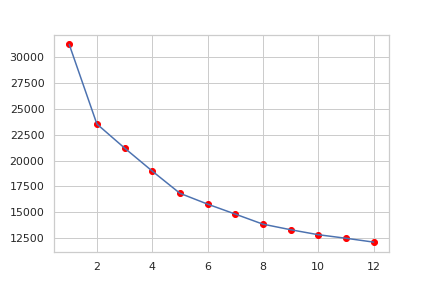
plt<span class="hljs-selector-class">.show</span>()</pre></div><p id="4d76">Output —</p><figure id="24c0"><img src="https://cdn-images-1.readmedium.com/v2/resize:fit:800/1*zYKG2oAi6m_57q9YKnGR9Q.png"><figcaption></figcaption></figure><p id="15ae"><b>K-means clustering</b> method is used and can be summarized as —</p><p id="dd2f">i. Divide into number of cluster K</p><p id="020b">ii. Find the centroid of the current partition</p><p id="ef9d">iii. Calculate the distance each points to Centroids</p><p id="ad77">iv. Group based on minimum distance</p><p id="ce38">v. After re-grouping/re-allotting the points, find the new centroid of the new cluster</p><figure id="9190"><img src="https://cdn-images-1.readmedium.com/v2/resize:fit:800/0*7tMszH39fZhXsAIb.png"><figcaption>Pic credits : Pinterest</figcaption></figure><div id="5b0d"><pre><span class="hljs-meta"># Kmeans ( 4 Clusters )</span></pre></div><div id="3776"><pre>km=<span class="hljs-built_in">KMeans</span>(n_clusters=<span class="hljs-number">4</span>,random_state=<span class="hljs-number">0</span>,init=<span class="hljs-string">"k-means++"</span>)
km<span class="hljs-selector-class">.fit</span>(c_df_final)
clusters=km<span class="hljs-selector-class">.predict</span>(c_df_final)
c_df<span class="hljs-selector-attr">[<span class="hljs-string">'cluster_no'</span>]</span> = clusters</pre></div><div id="c7f7"><pre><span class="hljs-meta">#plot</span></pre></div><div id="2ae0"><pre>plt<span class="hljs-selector-class">.figure</span>(figsize=(<span class="hljs-number">12</span>,<span class="hljs-number">9</span>))
plt<span class="hljs-selector-class">.scatter</span>(df<span class="hljs-selector-attr">[<span class="hljs-string">'Income'</span>]</span>,df<span class="hljs-selector-attr">[<span class="hljs-string">'Total_purchase'</span>]</span>,c=clusters, cmap=<span class="hljs-string">'icefire'</span>)
plt<span class="hljs-selector-class">.xlabel</span>(<span class="hljs-string">'Income'</span>)
plt<span class="hljs-selector-class">.ylabel</span>(<span class="hljs-string">'Total Purchase'</span>)
plt<span class="hljs-selector-class">.grid</span>(False)
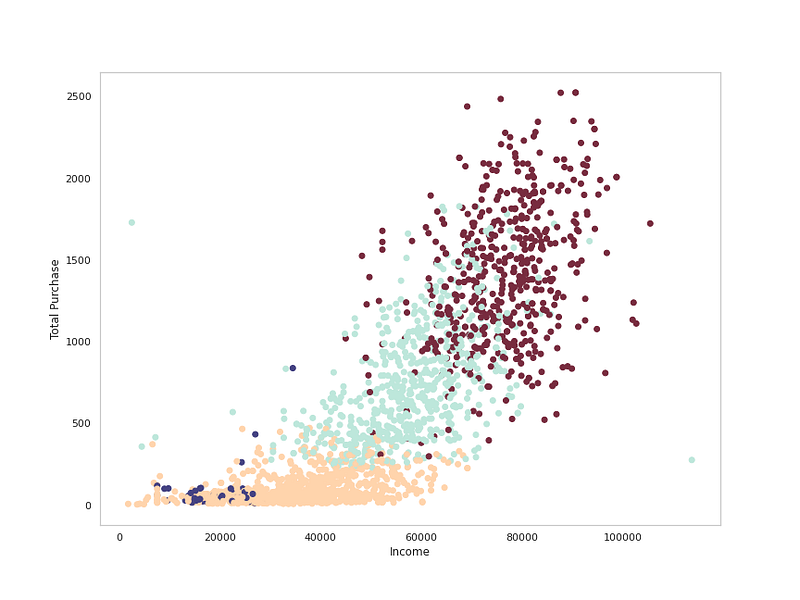
plt<span class="hljs-selector-class">.show</span>()</pre></div><p id="97b2">Output —</p><figure id="8211"><img src="https://cdn-images-1.readmedium.com/v2/resize:fit:800/1*GBN-F-DSj5ugiaBqSj5uVQ.png"><figcaption></figcaption></figure><div id="c0e1"><pre>c_df<span class="hljs-selector-attr">[<span class="hljs-string">'cluster_no'</span>]</span><span class="hljs-selector-class">.value_counts</span>()</pre></div><p id="c639">Output —</p><div id="7d48"><pre><span class="hljs-attribute">3</span> <span class="hljs-number">978</span>
<span class="hljs-attribute">0</span> <span class="hljs-number">650</span>
<span class="hljs-attribute">2</span> <span class="hljs-number">550</span>
<span class="hljs-attribute">1</span> <span class="hljs-number">54</span>
<span class="hljs-attribute">Name</span>: cluster_no, dtype: int64</pre></div><div id="8d50"><pre>print(<span class="hljs-string">"Cluster 0 Total Spending: "</span>, c_df.loc[c_df[<span class="hljs-string">'cluster_no'</span>]== <span class="hljs-number">0</span> ,[<span class="hljs-string">'Total_purchase'</span>] ].mean()[<span class="hljs-string">'Total_purchase'</span>])
print(<span class="hljs-string">"Cluster 1 Total Spending: "</span>,c_df.loc[c_df[<span class="hljs-string">'cluster_no'</span>]== <span class="hljs-number">1</span> ,[<span class="hljs-string">'Total_purchase'</span>] ].mean()[<span class="hljs-string">'Total_purchase'</span>])
print(<span class="hljs-string">"Cluster 2 Total Spending: "</span>,c_df.loc[c_df[<span class="hljs-string">'cluster_no'</span>]== <span class="hljs-number">2</span> ,[<span class="hljs-string">'Total_purchase'</span>] ].mean()[<span class="hljs-string">'Total_purchase'</span>])
print(<span class="hljs-string">"Cluster 3 Total Spending: "</span>,c_df.loc[c_df[<span class="hljs-string">'cluster_no'</span>]== <span class="hljs-number">3</span> ,[<span class="hljs-string">'Total_purchase'</span>] ].mean()[<span class="hljs-string">'Total_purchase'</span>])
print(<span class="hljs-string">"Cluster 0 Income: "</span>,c_df.loc[c_df[<span class="hljs-string">'cluster_no'</span>]== <span class="hljs-number">0</span> ,[<span class="hljs-string">'Income'</span>] ].mean()[<span class="hljs-string">'Income'</span>])
print(<span clas
Options
s="hljs-string">"Cluster 1 Income: "</span>,c_df.loc[c_df[<span class="hljs-string">'cluster_no'</span>]== <span class="hljs-number">1</span> ,[<span class="hljs-string">'Income'</span>] ].mean()[<span class="hljs-string">'Income'</span>])
print(<span class="hljs-string">"Cluster 2 Income: "</span>,c_df.loc[c_df[<span class="hljs-string">'cluster_no'</span>]== <span class="hljs-number">2</span> ,[<span class="hljs-string">'Income'</span>] ].mean()[<span class="hljs-string">'Income'</span>])
print(<span class="hljs-string">"Cluster 3 Income: "</span>,c_df.loc[c_df[<span class="hljs-string">'cluster_no'</span>]== <span class="hljs-number">3</span> ,[<span class="hljs-string">'Income'</span>] ].mean()[<span class="hljs-string">'Income'</span>])</pre></div><p id="0763">Output —</p><div id="b09e"><pre><span class="hljs-attribute">Cluster</span> <span class="hljs-number">0</span> Total Spending: <span class="hljs-number">742</span>.<span class="hljs-number">8215384615385</span>
<span class="hljs-attribute">Cluster</span> <span class="hljs-number">1</span> Total Spending: <span class="hljs-number">81</span>.<span class="hljs-number">79629629629629</span>
<span class="hljs-attribute">Cluster</span> <span class="hljs-number">2</span> Total Spending: <span class="hljs-number">1397</span>.<span class="hljs-number">7272727272727</span>
<span class="hljs-attribute">Cluster</span> <span class="hljs-number">3</span> Total Spending: <span class="hljs-number">97</span>.<span class="hljs-number">84253578732107</span>
<span class="hljs-attribute">Cluster</span> <span class="hljs-number">0</span> Income: <span class="hljs-number">57967</span>.<span class="hljs-number">39193765622</span>
<span class="hljs-attribute">Cluster</span> <span class="hljs-number">1</span> Income: <span class="hljs-number">20306</span>.<span class="hljs-number">25925925926</span>
<span class="hljs-attribute">Cluster</span> <span class="hljs-number">2</span> Income: <span class="hljs-number">76211</span>.<span class="hljs-number">46728257304</span>
<span class="hljs-attribute">Cluster</span> <span class="hljs-number">3</span> Income: <span class="hljs-number">35346</span>.<span class="hljs-number">9910711649</span></pre></div><div id="86e6"><pre><span class="hljs-meta"># Kmeans 5 clusters</span></pre></div><div id="d289"><pre>km=<span class="hljs-built_in">KMeans</span>(n_clusters=<span class="hljs-number">5</span>,random_state=<span class="hljs-number">0</span>,init=<span class="hljs-string">"k-means++"</span>)
km<span class="hljs-selector-class">.fit</span>(c_df_final)
clusters=km<span class="hljs-selector-class">.predict</span>(c_df_final)
c_df<span class="hljs-selector-attr">[<span class="hljs-string">'cluster_no'</span>]</span> = clusters</pre></div><div id="5f02"><pre><span class="hljs-meta">#plot</span></pre></div><div id="822e"><pre>plt<span class="hljs-selector-class">.figure</span>(figsize=(<span class="hljs-number">12</span>,<span class="hljs-number">9</span>))
plt<span class="hljs-selector-class">.scatter</span>(df<span class="hljs-selector-attr">[<span class="hljs-string">'Income'</span>]</span>,df<span class="hljs-selector-attr">[<span class="hljs-string">'Total_purchase'</span>]</span>,c=clusters, cmap=<span class="hljs-string">'icefire'</span>)
plt<span class="hljs-selector-class">.xlabel</span>(<span class="hljs-string">'Income'</span>)
plt<span class="hljs-selector-class">.ylabel</span>(<span class="hljs-string">'Total Purchase'</span>)
plt<span class="hljs-selector-class">.grid</span>(False)
plt<span class="hljs-selector-class">.show</span>()
</pre></div><p id="384e">Output —</p><figure id="855a"><img src="https://cdn-images-1.readmedium.com/v2/resize:fit:800/1*hC618SHzqNQs6fPnmE-_iQ.png"><figcaption></figcaption></figure><div id="2a50"><pre>c_df<span class="hljs-selector-attr">[<span class="hljs-string">'cluster_no'</span>]</span><span class="hljs-selector-class">.value_counts</span>()</pre></div><p id="65c8">Output —</p><div id="ab78"><pre><span class="hljs-attribute">2</span> <span class="hljs-number">956</span>
<span class="hljs-attribute">3</span> <span class="hljs-number">533</span>
<span class="hljs-attribute">1</span> <span class="hljs-number">520</span>
<span class="hljs-attribute">0</span> <span class="hljs-number">169</span>
<span class="hljs-attribute">4</span> <span class="hljs-number">54</span>
<span class="hljs-attribute">Name</span>: cluster_no, dtype: int64</pre></div><div id="86dd"><pre>print(<span class="hljs-string">"Cluster 0 Total Spending: "</span>, c_df.loc[c_df[<span class="hljs-string">'cluster_no'</span>]== <span class="hljs-number">0</span> ,[<span class="hljs-string">'Total_purchase'</span>] ].mean()[<span class="hljs-string">'Total_purchase'</span>])
print(<span class="hljs-string">"Cluster 1 Total Spending: "</span>,c_df.loc[c_df[<span class="hljs-string">'cluster_no'</span>]== <span class="hljs-number">1</span> ,[<span class="hljs-string">'Total_purchase'</span>] ].mean()[<span class="hljs-string">'Total_purchase'</span>])
print(<span class="hljs-string">"Cluster 2 Total Spending: "</span>,c_df.loc[c_df[<span class="hljs-string">'cluster_no'</span>]== <span class="hljs-number">2</span> ,[<span class="hljs-string">'Total_purchase'</span>] ].mean()[<span class="hljs-string">'Total_purchase'</span>])
print(<span class="hljs-string">"Cluster 3 Total Spending: "</span>,c_df.loc[c_df[<span class="hljs-string">'cluster_no'</span>]== <span class="hljs-number">3</span> ,[<span class="hljs-string">'Total_purchase'</span>] ].mean()[<span class="hljs-string">'Total_purchase'</span>])
print(<span class="hljs-string">"Cluster 4 Total Spending: "</span>,c_df.loc[c_df[<span class="hljs-string">'cluster_no'</span>]== <span class="hljs-number">4</span> ,[<span class="hljs-string">'Total_purchase'</span>] ].mean()[<span class="hljs-string">'Total_purchase'</span>])
print(<span class="hljs-string">"Cluster 0 Income: "</span>,c_df.loc[c_df[<span class="hljs-string">'cluster_no'</span>]== <span class="hljs-number">0</span> ,[<span class="hljs-string">'Income'</span>] ].mean()[<span class="hljs-string">'Income'</span>])
print(<span class="hljs-string">"Cluster 1 Income: "</span>,c_df.loc[c_df[<span class="hljs-string">'cluster_no'</span>]== <span class="hljs-number">1</span> ,[<span class="hljs-string">'Income'</span>] ].mean()[<span class="hljs-string">'Income'</span>])
print(<span class="hljs-string">"Cluster 2 Income: "</span>,c_df.loc[c_df[<span class="hljs-string">'cluster_no'</span>]== <span class="hljs-number">2</span> ,[<span class="hljs-string">'Income'</span>] ].mean()[<span class="hljs-string">'Income'</span>])
print(<span class="hljs-string">"Cluster 3 Income: "</span>,c_df.loc[c_df[<span class="hljs-string">'cluster_no'</span>]== <span class="hljs-number">3</span> ,[<span class="hljs-string">'Income'</span>] ].mean()[<span class="hljs-string">'Income'</span>])
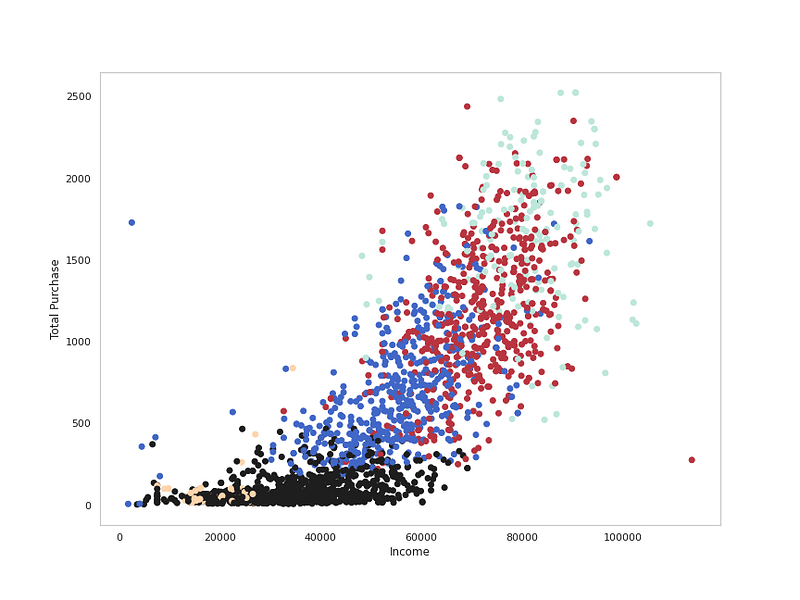
print(<span class="hljs-string">"Cluster 4 Income: "</span>,c_df.loc[c_df[<span class="hljs-string">'cluster_no'</span>]== <span class="hljs-number">4</span> ,[<span class="hljs-string">'Income'</span>] ].mean()[<span class="hljs-string">'Income'</span>])</pre></div><p id="d2ab">Output —</p><div id="99a6"><pre><span class="hljs-attribute">Cluster</span> <span class="hljs-number">0</span> Total Spending: <span class="hljs-number">1609</span>.<span class="hljs-number">9763313609467</span>
<span class="hljs-attribute">Cluster</span> <span class="hljs-number">1</span> Total Spending: <span class="hljs-number">691</span>.<span class="hljs-number">651923076923</span>
<span class="hljs-attribute">Cluster</span> <span class="hljs-number">2</span> Total Spending: <span class="hljs-number">95</span>.<span class="hljs-number">36715481171548</span>
<span class="hljs-attribute">Cluster</span> <span class="hljs-number">3</span> Total Spending: <span class="hljs-number">1171</span>.<span class="hljs-number">4033771106942</span>
<span class="hljs-attribute">Cluster</span> <span class="hljs-number">4</span> Total Spending: <span class="hljs-number">81</span>.<span class="hljs-number">79629629629629</span>
<span class="hljs-attribute">Cluster</span> <span class="hljs-number">0</span> Income: <span class="hljs-number">80067</span>.<span class="hljs-number">56361747805</span>
<span class="hljs-attribute">Cluster</span> <span class="hljs-number">1</span> Income: <span class="hljs-number">55016</span>.<span class="hljs-number">08366946681</span>
<span class="hljs-attribute">Cluster</span> <span class="hljs-number">2</span> Income: <span class="hljs-number">35305</span>.<span class="hljs-number">193794559906</span>
<span class="hljs-attribute">Cluster</span> <span class="hljs-number">3</span> Income: <span class="hljs-number">71806</span>.<span class="hljs-number">60789008475</span>
<span class="hljs-attribute">Cluster</span> <span class="hljs-number">4</span> Income: <span class="hljs-number">20306</span>.<span class="hljs-number">25925925926</span></pre></div><p id="fe79"><b><i>ML Regression Project 1 : Coming soon</i></b></p><p id="23ac">Follow and Stay tuned. Keep coding :)</p><h1 id="a69d">For other projects, tune to —</h1><p id="b31f"><b>Build Machine Learning Pipelines( With Code)</b></p><div id="5b37" class="link-block">
<a href="https://medium.datadriveninvestor.com/build-machine-learning-pipelines-with-code-part-1-bd3ed7152124">
<div>
<div>
<h2>Build Machine Learning Pipelines( With Code) — Part 1</h2>
<div><h3>Complete implementation…</h3></div>
<div><p>medium.datadriveninvestor.com</p></div>
</div>
<div>
<div style="background-image: url(https://miro.readmedium.com/v2/resize:fit:320/0*KdToBD8RDMBH4jXM.png)"></div>
</div>
</div>
</a>
</div><p id="946c"><b>Recurrent Neural Network with Keras</b></p><div id="607d" class="link-block">
<a href="https://medium.datadriveninvestor.com/recurrent-neural-network-with-keras-b5b5f6fe5187">
<div>
<div>
<h2>Recurrent Neural Network with Keras</h2>
<div><h3>Project Implementation and cheatsheet…</h3></div>
<div><p>medium.datadriveninvestor.com</p></div>
</div>
<div>
<div style="background-image: url(https://miro.readmedium.com/v2/resize:fit:320/0*xs3Dya3qQBx6IU7C.png)"></div>
</div>
</div>
</a>
</div><p id="56e1"><b>Clustering Geolocation Data in Python using DBSCAN and K-Means</b></p><div id="2b3e" class="link-block">
<a href="https://medium.datadriveninvestor.com/clustering-geolocation-data-in-python-using-dbscan-and-k-means-3705d9f44522">
<div>
<div>
<h2>Clustering Geolocation Data in Python using DBSCAN and K-Means</h2>
<div><h3>Project Implementation…</h3></div>
<div><p>medium.datadriveninvestor.com</p></div>
</div>
<div>
<div style="background-image: url(https://miro.readmedium.com/v2/resize:fit:320/0*0uPCZnohdaPCO4NN.png)"></div>
</div>
</div>
</a>
</div><p id="a29c"><b>Facial Expression Recognition using Keras</b></p><div id="ccaa" class="link-block">
<a href="https://medium.datadriveninvestor.com/facial-expression-recognition-using-keras-cbdd661a0a54">
<div>
<div>
<h2>Facial Expression Recognition using Keras</h2>
<div><h3>Project Implementation…</h3></div>
<div><p>medium.datadriveninvestor.com</p></div>
</div>
<div>
<div style="background-image: url(https://miro.readmedium.com/v2/resize:fit:320/0*CGch7hzdjg1fpgKy.jpg)"></div>
</div>
</div>
</a>
</div><p id="0db7"><b>Hyperparameter Tuning with Keras Tuner</b></p><div id="6dff" class="link-block">
<a href="https://medium.datadriveninvestor.com/hyperparameter-tuning-with-keras-tuner-3a609d3fd85b">
<div>
<div>
<h2>Hyperparameter Tuning with Keras Tuner</h2>
<div><h3>Project Implementation….</h3></div>
<div><p>medium.datadriveninvestor.com</p></div>
</div>
<div>
<div style="background-image: url(https://miro.readmedium.com/v2/resize:fit:320/0*jlaEz8AZaptNWHEr.png)"></div>
</div>
</div>
</a>
</div><p id="fed8"><b>Custom Layers in Keras</b></p><div id="e4fd" class="link-block">
<a href="https://medium.datadriveninvestor.com/custom-layers-in-keras-de5f793217aa">
<div>
<div>
<h2>Custom Layers in Keras</h2>
<div><h3>Code implementation …</h3></div>
<div><p>medium.datadriveninvestor.com</p></div>
</div>
<div>
<div style="background-image: url(https://miro.readmedium.com/v2/resize:fit:320/0*1IH67KJadqeqeO01.png)"></div>
</div>
</div>
</a>
</div><p id="2ea9"><b><i>That’s it fellas. Peace out and keep coding :)</i></b></p><p id="ec55">Stay Tuned and of-course let me end this post with a quote by Steve Jobs ;)</p><p id="5004" type="7">“Remembering that you are going to die is the best way I know to avoid the trap of thinking you have something to lose. You are already naked. There is no reason not to follow your heart.”</p></article></body>