Free AI web copilot to create summaries, insights and extended knowledge, download it at here
1761
Abstract
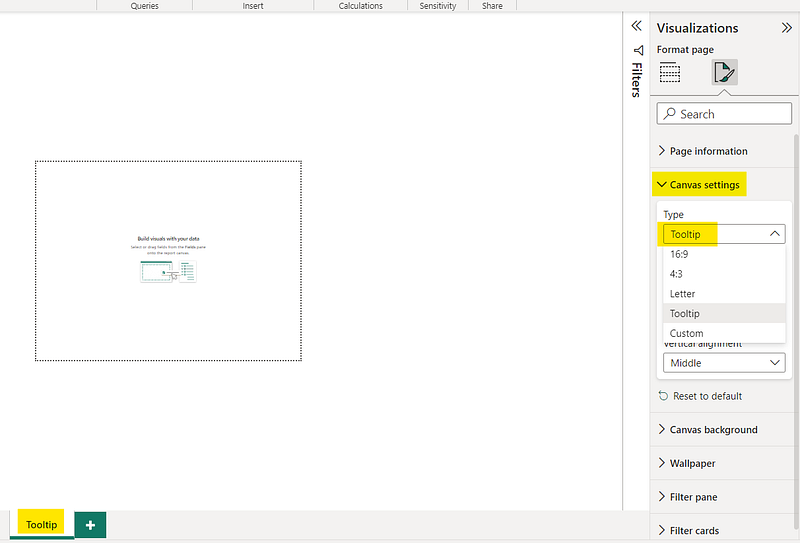
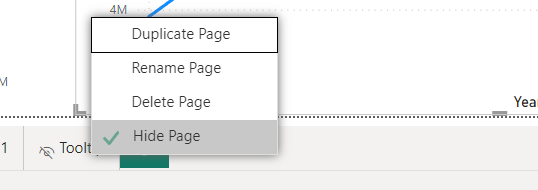
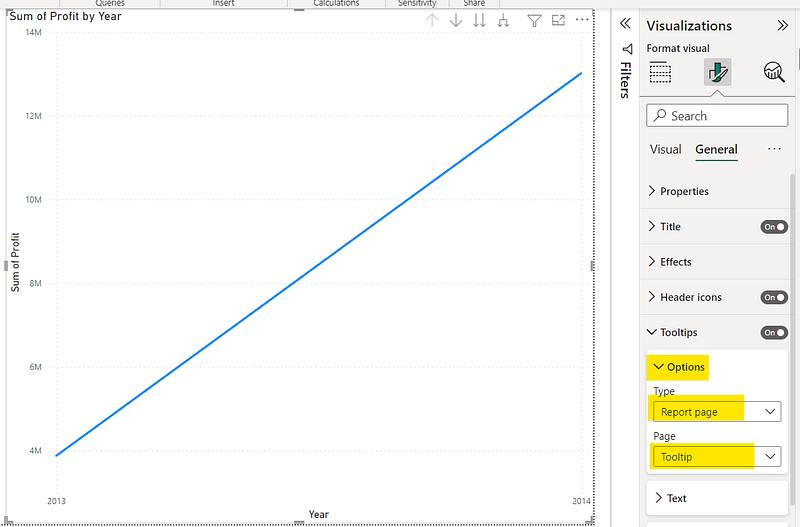
4OXtqO8Vhw.png"><figcaption></figcaption></figure><p id="f1de">Make sure to set the visibility of the <b>“Tooltip” </b>page to hidden for it to not appear as a directly accessible report page.</p><figure id="e0e3"><img src="https://cdn-images-1.readmedium.com/v2/resize:fit:800/1*OWMqZCbw9fSBaA4VHj1faQ.png"><figcaption></figcaption></figure><p id="03db">3. Set the <b>“Tooltip” </b>page as the tooltip in the respective visual by changing the visualization settings.</p><figure id="0fb8"><img src="https://cdn-images-1.readmedium.com/v2/resize:fit:800/1*ca7XRCZghNeKiV6lQen0ww.png"><figcaption></figcaption></figure><p id="0951">That’s it! Now if you hover over the data points of the visual, the custom tooltip we created will appear.</p><p id="de59">Hope this was useful! Thanks for reading and do let me know any other Power BI topics/features you need me to cover in the comments!</p><p id="7d55"><b>More articles on Power BI (full list <a href="https://medium.com/@krishnihw/list/power-bi-2e19d2237f90">here</a>)</b>,</p><ul><li><a href="https://readmedium.com/space-saving-slicer-panel-power-bi-dcd2ae346c10">Space saving Slicer Panel — Power BI</a></li><li><a href="https://readmedium.com/power-bi-show-hide-table-fields-based-on-user-selection-7f9e147b26de">How to Show/Hide fields dynamically in Power BI</a></li><li><a href="https://readmedium.com/how-to-create-a-pop-up-window-in-power-bi-a-5-step-guide-d87830445d19">Creating a pop up window in Power BI</a></li><li><a href="https://readmedium.com/sending-emails-using-power-automate-for-power-bi-zero-coding-db315419253f">Sending emails using Power Automate for Power BI — ZERO CODING</a></li><li><a href="https://readmedium.com/power-bi-filtering-using-slicers-f712ebe53f6c">Power BI: Filtering us
Options
ing Slicers</a></li><li><a href="https://medium.datadriveninvestor.com/how-to-create-a-simple-power-bi-report-in-15-mins-6351acefc301">How to create a Power BI report in 15 mins : For absolute beginners</a></li></ul><p id="2554">If you are interested in <b><i>Machine Learning</i></b>, check out <a href="https://medium.com/@krishnihw/list/machine-learning-5db3a9d0dc83">this list</a>.</p><div id="7d84" class="link-block">
<a href="https://medium.datadriveninvestor.com/space-saving-slicer-panel-power-bi-dcd2ae346c10">
<div>
<div>
<h2>Space saving Slicer Panel — Power BI</h2>
<div><h3>Having a lot of slicers in your report page takes up space which you could put to better use. A simple solution for…</h3></div>
<div><p>medium.datadriveninvestor.com</p></div>
</div>
<div>
<div style="background-image: url(https://miro.readmedium.com/v2/resize:fit:320/1*Gv3srQHg5KbWvwofm26DkA.gif)"></div>
</div>
</div>
</a>
</div><div id="dcc9" class="link-block">
<a href="https://readmedium.com/my-first-months-earnings-medium-partner-program-4a9aec432497">
<div>
<div>
<h2>I earned 7.67 in 3 Weeks — Medium</h2>
<div><h3>I was accepted to the Medium Partner Program exactly 3 weeks back. During these 3 weeks I earned …</h3></div>
<div><p>medium.com</p></div>
</div>
<div>
<div style="background-image: url(https://miro.readmedium.com/v2/resize:fit:320/0*1d7n8ejj1ECleAWg)"></div>
</div>
</div>
</a>
</div></article></body>