
Exploring Highcharts Drawing Capabilities
A step-by-step guide on Highcharts custom graphs
Introduction
Highcharts is an enterprise-grade JavaScript charting library based on SVG. It comes with excellent documentation and innumerable examples. The only drawback is that the license is proprietary. It is free for personal/non-commercial uses, but you must pay for commercial applications.
Besides plotting charts, Highcharts allows direct access to the rendering layer to draw primitive shapes like buttons, circles, rectangles, paths, or text directly on a chart, or independent from any chart.
Let’s take a look at how it works.
A Basic Chart
We are going to use a Vite application to explore Highcharts. The following command creates a React project:
% yarn create vite react-custom-graphs --template react
% cd react-custom-graphs
Install highcharts and highcharts-react-official.
% yarn add highcharts highcharts-react-officialAfter the installation, these packages become part of dependencies in package.json:
"dependencies": {
  "highcharts": "^11.1.0",
  "highcharts-react-official": "^3.2.0"
}
We have the working environment set to explore Highcharts.
As we have explained in a previous article, it is recommended to include the following imports for every chart:
import Highcharts from 'highcharts';
import HighchartsReact from 'highcharts-react-official';
import HighchartsExporting from 'highcharts/modules/exporting';
import HighchartsAccessibility from 'highcharts/modules/accessibility';highcharts: It is the JavaScript charting library.highcharts-react-official: It is the official Highcharts-supported wrapper for React.highcharts/modules/exporting: It is the Highcharts exporting module that provides a menu with export-related menu items toView in full screen,Print chart,Download PNG image,Download JPEG image,Download PDF document, andDownload SVG vector image.highcharts/modules/accessibility: It is the Highcharts accessibility module that provides accessibility for the generated chart HTML.
Modify index.html to make the application titled Exploring Highcharts:
<!doctype html>
<html lang="en">
  <head>
    <meta charset="UTF-8" />
    <link rel="icon" type="image/svg+xml" href="/vite.svg" />
    <meta name="viewport" content="width=device-width, initial-scale=1.0" />
    <title>Exploring Highcharts</title>
  </head>
  <body>
    <div id="root"></div>
    <script type="module" src="/src/main.jsx"></script>
  </body>
</html>
Here is the modified src/App.js that draws a line chart:
import Highcharts from 'highcharts';
import HighchartsReact from 'highcharts-react-official';
import HighchartsExporting from 'highcharts/modules/exporting';
import HighchartsAccessibility from 'highcharts/modules/accessibility';
HighchartsExporting(Highcharts);
HighchartsAccessibility(Highcharts);

const getOptions = () => ({
  chart: {
    type: 'line',
    width: 800,
    height: 600,
  },
  title: {
    text: 'Line Chart',
  },
  yAxis: {
    title: {
      text: 'Values',
    },
  },
  series: [
    {
      data: [1, 2, 1, 4, 3, 6],
    },
    {
      data: [2, 7, 0, 4, 6, 2],
    },
  ],
  credits: {
    enabled: false,
  },
});

function App() {

  return (
    <div id="container">
      <HighchartsReact highcharts={Highcharts} options={getOptions()} />
    </div>
  )
}

export default App;
Execute yarn dev, and we see the line chart.
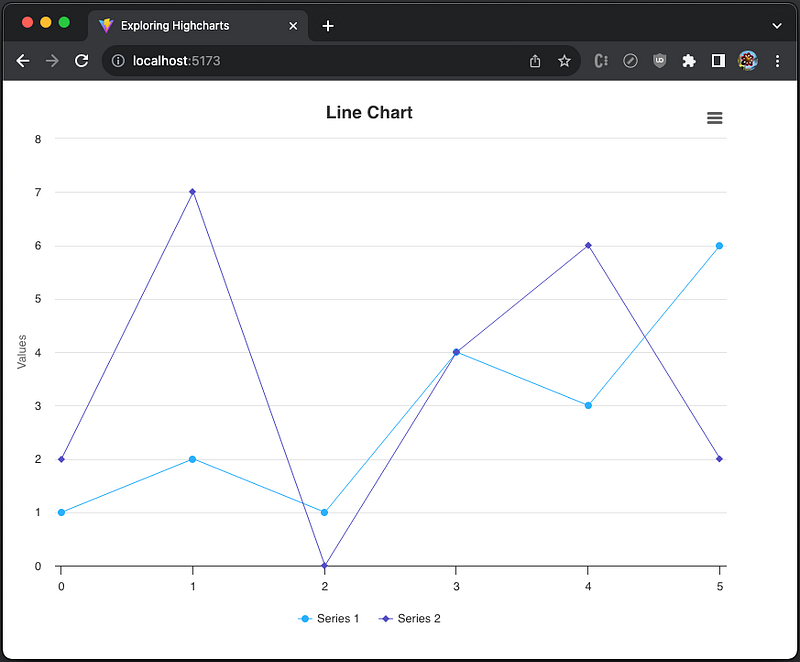
Chart With Buttons
Highcharts allows direct access to the rendering layer to draw primitive shapes like buttons, circles, rectangles, paths or text directly on a chart. Highcharts.SVGRenderer supports the following API to add buttons:
button(text, x, y, callback [, theme] [, hoverState] [, selectState] [, disabledState] [, shape] [, useHTML])

text: string - The text or HTML to draw.

x: number - The x position of the button's left side.

y: number - The y position of the button's top side.

callback: Highcharts.EventCallbackFunction.<Highcharts.SVGElement> - The function to execute on button click or touch.

theme?: Highcharts.SVGAttributes - SVG attributes for the normal state.

hoverState?: Highcharts.SVGAttributes - SVG attributes for the hover state.

selectState?: Highcharts.SVGAttributes - SVG attributes for the pressed state.

disabledState?: Highcharts.SVGAttributes - SVG attributes for the disabled state.

shape?: Highcharts.SymbolKeyValue - The shape type. The default value is rect.

useHTML?: boolean - Whether to use HTML to render the label. The default value is false.
Here is the modified src/App.js:
import Highcharts from 'highcharts';
import HighchartsReact from 'highcharts-react-official';
import HighchartsExporting from 'highcharts/modules/exporting';
import HighchartsAccessibility from 'highcharts/modules/accessibility';
HighchartsExporting(Highcharts);
HighchartsAccessibility(Highcharts);

const getOptions = () => ({
  chart: {
    type: 'line',
    width: 800,
    height: 600,
    events: {
      load: function () {
        const chart = this;
        const renderer = chart.renderer;

        // the button to switch to a line chart
        const lineButton = renderer
          .button(
            'Line', // text
            chart.plotLeft, // x
            10, // y
            function () {
              // called upon clicking the line button
              chart.series.map((item) =>
                item.update({
                  type: 'line',
                })
              );
            }
          )
          .add();

        // the button to switch to a column chart
        renderer
          .button(
            'Column', // text
            chart.plotLeft + lineButton.width + 10, // x
            10, // y
            function () {
              // called upon clicking the column button
              chart.series.map((item) =>
                item.update({
                  type: 'column',
                })
              );
            }
          )
          .add();
      },
    },
  },
  title: {
    text: 'Custom Chart',
  },
  yAxis: {
    title: {
      text: 'Values',
    },
  },
  series: [
    {
      data: [1, 2, 1, 4, 3, 6],
    },
    {
      data: [2, 7, 0, 4, 6, 2],
    },
  ],
  credits: {
    enabled: false,
  },
});

function App() {
  return (
    <div id="container">
      <HighchartsReact highcharts={Highcharts} options={getOptions()} />
    </div>
  );
}

export default App;
Execute yarn dev, and we see that the chart type changes upon clicking the Line or Column button.
Chart With Shapes
Highcharts can draw primitive shapes without any chart. Highcharts.SVGRenderer supports the following API to add text:
text( [str] [, x] [, y] [, useHTML])

str?: string - The text of (subset) HTML to draw.

x?: number - The x position of the text's lower left corner.

y?: number - The y position of the text's lower left corner.

useHTML?: boolean - Use HTML to render the text. The default value is false.
Highcharts.SVGRenderer supports the following API to add rectangles:
rect( [x] [, y] [, width] [, height] [, r] [, strokeWidth])

x?: number - Left position.

y?: number - Top position.

width?: number - Width of the rectangle.

height?: number - Height of the rectangle.

r?: number - Border corner radius.

strokeWidth?: number - A stroke width can be supplied to allow crisp drawing.
Highcharts.SVGRenderer supports the following API to add circles:
circle( [x] [, y] [, r])

x?: number - The center x position.

y?: number - The center y position.

r?: number - The radius.
Highcharts.SVGRenderer supports the following API to add labels:
label(str, x [, y] [, shape] [, anchorX] [, anchorY] [, useHTML] [, baseline] [, className])

str: string - The initial text string or (subset) HTML to render.

x: number - The x position of the label's left side.

y?: number - The y position of the label's top side or baseline, depending on the baseline parameter.

shape?: string - The shape of the label's border/background, if any. Defaults to rect. Other possible values are callout or other shapes defined in Highcharts.SVGRenderer#symbols.

anchorX?: number - In case the shape has a pointer, like a flag, this is the coordinates it should be pinned to.

anchorY?: number - In case the shape has a pointer, like a flag, this is the coordinates it should be pinned to.

useHTML?: boolean - Whether to use HTML to render the label. The default value is false.

baseline?: boolean - Whether to position the label relative to the text baseline, like renderer.text, or to the upper border of the rectangle. The default value is false.

className?: string - Class name for the group.
Highcharts.SVGRenderer supports the following API to add paths:
path( [path])
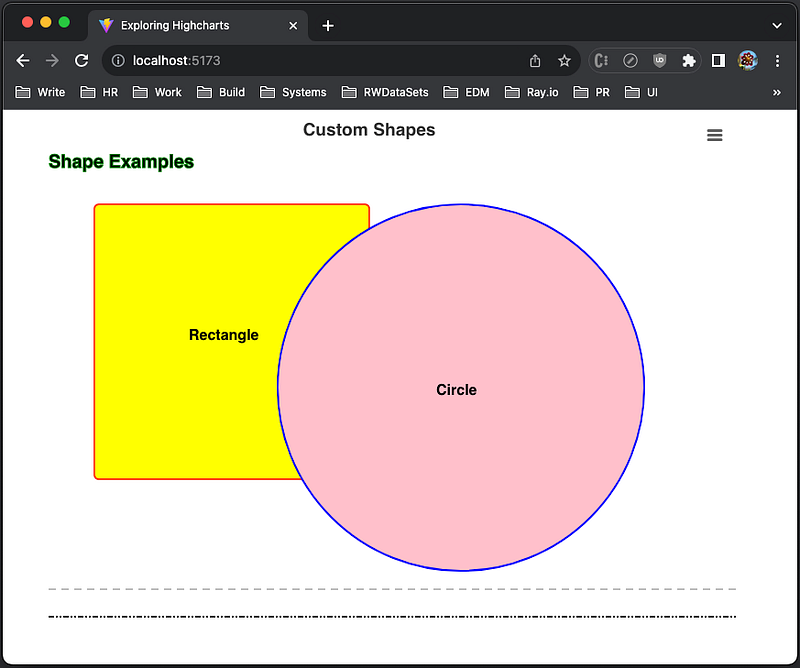
path: Highcharts.SVGPathArray - An SVG path definition in array form.Here is the modified src/App.js:
import Highcharts from 'highcharts';
import HighchartsReact from 'highcharts-react-official';
import HighchartsExporting from 'highcharts/modules/exporting';
import HighchartsAccessibility from 'highcharts/modules/accessibility';
HighchartsExporting(Highcharts);
HighchartsAccessibility(Highcharts);

const getOptions = () => ({
  chart: {
    type: 'line',
    width: 800,
    height: 600,
    events: {
      load: function () {
        const chart = this;
        const renderer = chart.renderer;

        // add text
        renderer
          .text('Shape Examples', 50, 60)
          .css({
            fontWeight: 'bold',
            fontSize: '20px',
            stroke: 'green',
          })
          .add();

        // add a rectangle
        renderer
          .rect(100, 100, 300, 300, 5)
          .attr({
            'stroke-width': 2,
            stroke: 'red',
            fill: 'yellow',
          })
          .add();

        // add a label over the above rectangle
        renderer
          .label('Rectangle', 200, 230)
          .css({
            fontWeight: 'bold',
            fontSize: '16px',
          })
          .add();

        // add a circle
        renderer
          .circle(500, 300, 200)
          .attr({
            'stroke-width': 2,
            stroke: 'blue',
            fill: 'pink',
          })
          .add();

        // add a label over the above circle
        renderer
          .label('Circle', 470, 290)
          .css({
            fontWeight: 'bold',
            fontSize: '16px',
          })
          .add();

        // add a line with the dash style
        renderer
          .path(['M', 50, 520, 'L', 800, 520])
          .attr({
            'stroke-width': 2,
            stroke: 'silver',
            dashstyle: 'dash',
          })
          .add();

        // add a line with the ShortDashDotDot style
        renderer
          .path(['M', 50, 550, 'L', 800, 550])
          .attr({
            'stroke-width': 2,
            stroke: 'black',
            dashstyle: 'ShortDashDotDot',
          })
          .add();
      },
    },
  },
  title: {
    text: 'Custom Shapes',
  },
  credits: {
    enabled: false,
  },
});

function App() {
  return (
    <div id="container">
      <HighchartsReact highcharts={Highcharts} options={getOptions()} />
    </div>
  );
}

export default App;
Execute yarn dev, and we see text, a rectangle, a circle, two labels, and two paths.
Node-Based Graphs
In a previews article, we have used React Flow to build interactive node-based graphs. With Highcharts, we have all the building blocks to create our own node-based graphs.
Here is the modified src/App.js that uses labels and paths to create a node-based graph:
import Highcharts from 'highcharts';
import HighchartsReact from 'highcharts-react-official';
import HighchartsExporting from 'highcharts/modules/exporting';
import HighchartsAccessibility from 'highcharts/modules/accessibility';
HighchartsExporting(Highcharts);
HighchartsAccessibility(Highcharts);

const SHADOW_SIZE = 3;

// first node
const node1 = {
  text: 'Node 1',
  x: 100,
  y: 100,
  width: 100,
  height: 50,
};

// second node
const node2 = {
  text: 'Node 2',
  x: 600,
  y: 500,
  width: 100,
  height: 50,
};

// the starting point of the arrow connecting node1 to node2
const arrowStart = {
  x: node1.x + node1.width / 2 + SHADOW_SIZE,
  y: node1.y + node1.height + SHADOW_SIZE * 2,
};

// the ending point of the arrow connecting node1 to node2
const arrowEnd = {
  x: node2.x + node2.width / 2 + SHADOW_SIZE,
  y: node2.y - SHADOW_SIZE,
};

// add a label with specific text, position, dimension
const addLabel = (renderer, { text, x, y, width, height }) =>
  renderer
    .label(text, x, y)
    .css({
      fontWeight: 'bold',
      fontSize: '16px',
      color: 'white',
    })
    .attr({
      fill: 'blue',
      r: 5, // border radius
      'text-align': 'center',
      width,
      height,
    })
    .add()
    .shadow(true); // default showdow size is 3

const getOptions = () => ({
  chart: {
    type: 'line',
    width: 800,
    height: 600,
    events: {
      load: function () {
        const chart = this;
        const renderer = chart.renderer;

        // add the first label
        addLabel(renderer, node1);

        // add the second label
        addLabel(renderer, node2);

        // add the arrow from node1 to node2
        renderer
          .path([
            // arrow line
            'M',
            arrowStart.x,
            arrowStart.y,
            'L',
            arrowEnd.x,
            arrowEnd.y,
            // arrow end
            'L',
            arrowEnd.x - 12, // can be calculated based on the line slope
            arrowEnd.y - 2, // can be calculated based on the line slope
            'M',
            arrowEnd.x,
            arrowEnd.y,
            'L',
            arrowEnd.x - 7, // can be calculated based on the line slope
            arrowEnd.y - 10, // can be calculated based on the line slope
          ])
          .attr({
            'stroke-width': 2,
            stroke: 'gray',
          })
          .add();
      },
    },
  },
  title: {
    text: 'Node-Based Graph',
  },
  credits: {
    enabled: false,
  },
});

function App() {
  return (
    <div id="container">
      <HighchartsReact highcharts={Highcharts} options={getOptions()} />
    </div>
  );
}

export default App;
Execute yarn dev, and we see the node-based graph.

The arrow line has been dynamically calculated based on node1 and node2 positions. However, the arrow head paths are hardcoded.
Calculating the arrow head paths based on the line slope would work. Alternatively, we can draw a curve line to make the arrow predictably pointing straight up or down.
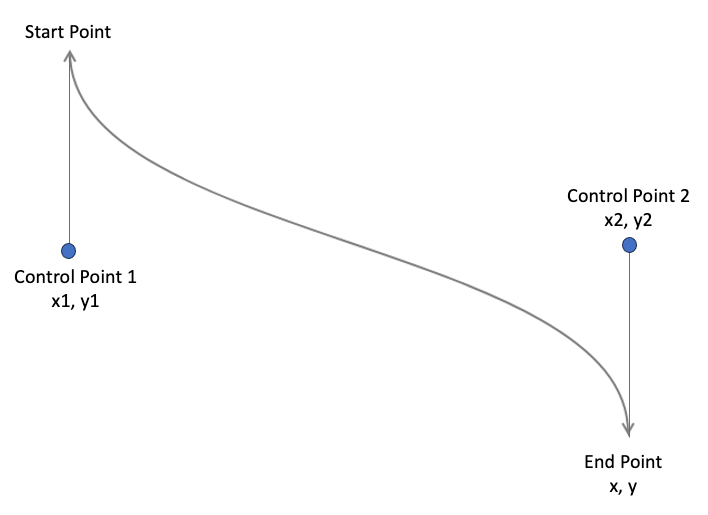
Here is how to draw the cubic Bézier curve line in SVG:
C (x1 y1 x2 y2 x y) draws a cubic Bézier curve from the current point to (x, y) using (x1, y1) as the control point 1 at the beginning of the curve and (x2, y2) as the control point 2 at the end of the curve.
Here is the modified src/App.js:
import Highcharts from 'highcharts';
import HighchartsReact from 'highcharts-react-official';
import HighchartsExporting from 'highcharts/modules/exporting';
import HighchartsAccessibility from 'highcharts/modules/accessibility';
HighchartsExporting(Highcharts);
HighchartsAccessibility(Highcharts);
const SHADOW_SIZE = 3;
const ARROW_LENGTH = 10;
const ARROW_ANGLE = Math.PI / 6;
const ARROW_X = ARROW_LENGTH * Math.sin(ARROW_ANGLE);
const ARROW_Y = ARROW_LENGTH * Math.cos(ARROW_ANGLE);
const node1 = {
text: 'Node 1',
x: 100,
y: 100,
width: 100,
height: 50,
};
const node2 = {
text: 'Node 2',
x: 600,
y: 500,
width: 100,
height: 50,
};
// add an arrow that connects node1 to node2
const addArrow = (renderer, node1, node2, isDoubleEnded) => {
const arrowStart = {
x: node1.x + node1.width / 2 + SHADOW_SIZE,
y: node1.y + node1.height + SHADOW_SIZE * 2,
};
const arrowEnd = {
x: node2.x + node2.width / 2 + SHADOW_SIZE,
y: node2.y - SHADOW_SIZE,
};
const initPath = isDoubleEnded
// the beginning arrow if it is double ended
? [
'M',
arrowStart.x - ARROW_X,
arrowStart.y + ARROW_Y,
'L',
arrowStart.x,
arrowStart.y,
'L',
arrowStart.x + ARROW_X,
arrowStart.y + ARROW_Y,
]
: [];
renderer
.path([
...initPath,
// arrow line
'M',
arrowStart.x,
arrowStart.y,
'C',
arrowStart.x,
(arrowStart.y + arrowEnd.y) / 2,
arrowEnd.x,
(arrowStart.y + arrowEnd.y) / 2,
arrowEnd.x,
arrowEnd.y,
// the ending arrow
'L',
arrowEnd.x - ARROW_X,
arrowEnd.y - ARROW_Y,
'M',
arrowEnd.x,
arrowEnd.y,
'L',
arrowEnd.x + ARROW_X,
arrowEnd.y - ARROW_Y,
])
.attr({
'stroke-width': 2,
stroke: 'gray',
})
.add();
};
// add a label with specific text, position, dimension
const addLabel = (renderer, { text, x, y, width, height }) =>
renderer
.label(text, x, y)
.css({
fontWeight: 'bold',
fontSize: '16px',
color: 'white',
})
.attr({
fill: 'blue',
r: 5, // border radius
'text-align': 'center',
width,
height,
})
.add()
.shadow(true);
const getOptions = () => ({
chart: {
type: 'line',
width: 800,
height: 600,
events: {
load: function () {
const chart = this;
const renderer = chart.renderer;
// add the first label
addLabel(renderer, node1);
// add the second label
addLabel(renderer, node2);
// add the double-ended arrow
addArrow(renderer, node1, node2, true);
},
},
},
title: {
text: 'Node-Based Graph',
},
credits: {
enabled: false,
},
});
function App() {
return (
<div id="container">
<HighchartsReact highcharts={Highcharts} options={getOptions()} />
</div>
);
}
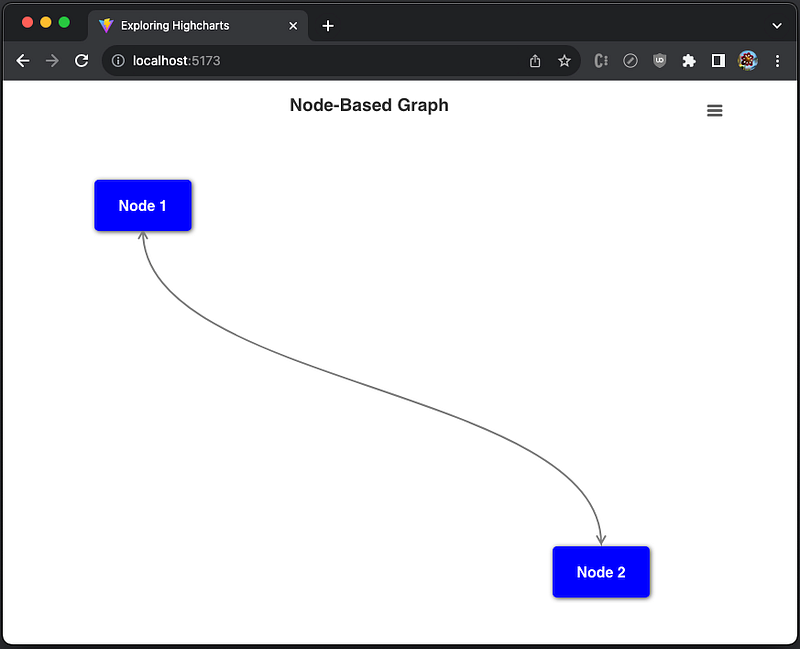
export default App;Execute yarn dev, and we see the node-based graph with a curve double-ended arrow.
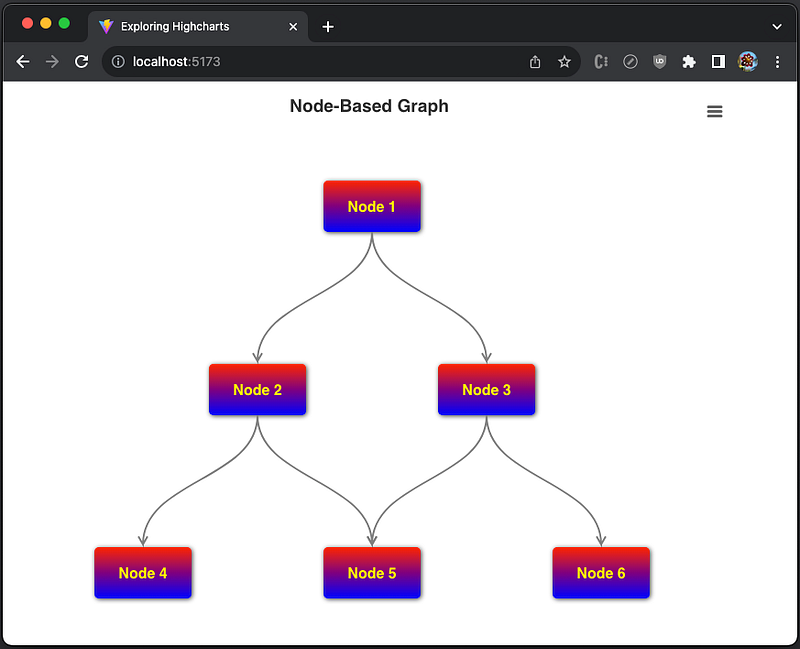
We can modify App.js to draw more nodes and arrows:
import Highcharts from 'highcharts';
import HighchartsReact from 'highcharts-react-official';
import HighchartsExporting from 'highcharts/modules/exporting';
import HighchartsAccessibility from 'highcharts/modules/accessibility';
HighchartsExporting(Highcharts);
HighchartsAccessibility(Highcharts);
const SHADOW_SIZE = 3;
const ARROW_LENGTH = 10;
const ARROW_ANGLE = Math.PI / 6;
const ARROW_X = ARROW_LENGTH * Math.sin(ARROW_ANGLE);
const ARROW_Y = ARROW_LENGTH * Math.cos(ARROW_ANGLE);
const nodes = [
{
text: 'Node 1',
x: 350,
y: 100,
width: 100,
height: 50,
},
{
text: 'Node 2',
x: 225,
y: 300,
width: 100,
height: 50,
},
{
text: 'Node 3',
x: 475,
y: 300,
width: 100,
height: 50,
},
{
text: 'Node 4',
x: 100,
y: 500,
width: 100,
height: 50,
},
{
text: 'Node 5',
x: 350,
y: 500,
width: 100,
height: 50,
},
{
text: 'Node 6',
x: 600,
y: 500,
width: 100,
height: 50,
},
];
// add an arrow that connects node1 to node2
const addArrow = (renderer, node1, node2, isDoubleEnded) => {
const arrowStart = {
x: node1.x + node1.width / 2 + SHADOW_SIZE,
y: node1.y + node1.height + SHADOW_SIZE * 2,
};
const arrowEnd = {
x: node2.x + node2.width / 2 + SHADOW_SIZE,
y: node2.y - SHADOW_SIZE,
};
const initPath = isDoubleEnded
? // the beginning arrow if it is double ended
[
'M',
arrowStart.x - ARROW_X,
arrowStart.y + ARROW_Y,
'L',
arrowStart.x,
arrowStart.y,
'L',
arrowStart.x + ARROW_X,
arrowStart.y + ARROW_Y,
]
: [];
renderer
.path([
...initPath,
// arrow line
'M',
arrowStart.x,
arrowStart.y,
'C',
arrowStart.x,
(arrowStart.y + arrowEnd.y) / 2,
arrowEnd.x,
(arrowStart.y + arrowEnd.y) / 2,
arrowEnd.x,
arrowEnd.y,
// the ending arrow
'L',
arrowEnd.x - ARROW_X,
arrowEnd.y - ARROW_Y,
'M',
arrowEnd.x,
arrowEnd.y,
'L',
arrowEnd.x + ARROW_X,
arrowEnd.y - ARROW_Y,
])
.attr({
'stroke-width': 2,
stroke: 'gray',
})
.add();
};
// add a label with specific text, position, dimension
const addLabel = (renderer, { text, x, y, width, height }) =>
renderer
.label(text, x, y)
.css({
fontWeight: 'bold',
fontSize: '16px',
color: 'white',
})
.attr({
fill: 'blue',
r: 5, // border radius
'text-align': 'center',
width,
height,
})
.add()
.shadow(true);
const getOptions = () => ({
chart: {
type: 'line',
width: 800,
height: 600,
events: {
load: function () {
const chart = this;
const renderer = chart.renderer;
// add all nodes
nodes.map((node) => addLabel(renderer, node));
// add arrows
addArrow(renderer, nodes[0], nodes[1]);
addArrow(renderer, nodes[0], nodes[2]);
addArrow(renderer, nodes[1], nodes[3]);
addArrow(renderer, nodes[1], nodes[4]);
addArrow(renderer, nodes[2], nodes[4]);
addArrow(renderer, nodes[2], nodes[5]);
},
},
},
title: {
text: 'Node-Based Graph',
},
credits: {
enabled: false,
},
});
function App() {
return (
<div id="container">
<HighchartsReact highcharts={Highcharts} options={getOptions()} />
</div>
);
}
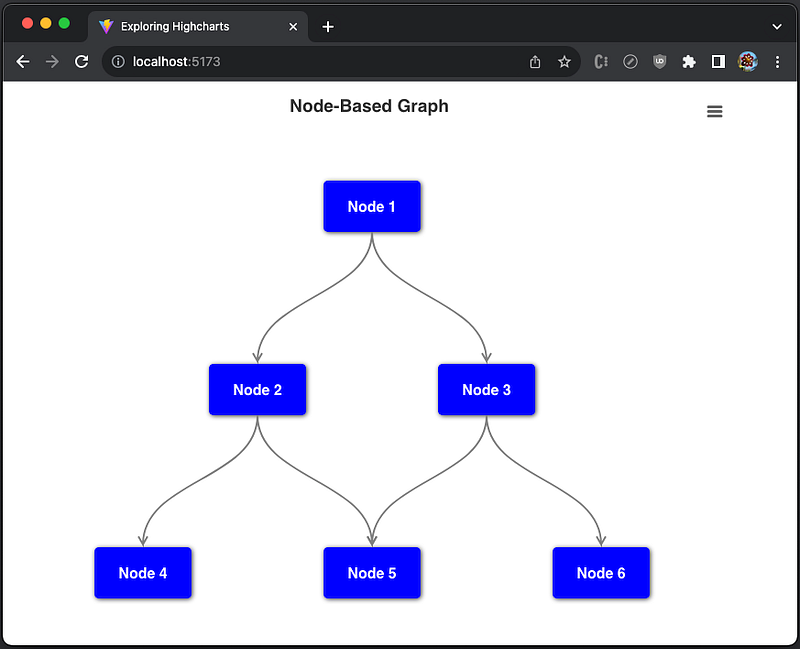
export default App;Execute yarn dev, and we see the node-based graph with many nodes and arrows.
The final example is located at this repository.
Conclusion
Highcharts is an enterprise-grade JavaScript charting library based on SVG. It comes with excellent documentation and innumerable examples.
In this article, we have provided step-by-step guide on Highcharts custom graphs
We have also written articles on other Highcharts types:
- In this article:
line,spline,area,areaspline,column,bar,pie,scatter,scatter3d,heatmap,treemap, andgauge. - In this article:
bubble,packedbubble,streamgraph, andcylinder. - In this article:
sankeydiagram,arcdiagram,dependencywheel, andnetworkgraph. - In this article:
parallelCoordinates. - In this article:
timeline.
Highcharts is free for personal/non-commercial uses, but you must pay for commercial applications. If your budget allows, Highcharts is highly recommended.
Thanks for reading.
Thanks, S Sreeram and team, for working with me on Domino products.
Want to Connect?

If you are interested, check out my directory of web development articles.
In Plain English
Thank you for being a part of our community! Before you go:
- Be sure to clap and follow the writer! 👏
- You can find even more content at PlainEnglish.io 🚀
- Sign up for our free weekly newsletter. 🗞️
- Follow us on Twitter(X), LinkedIn, YouTube, and Discord.


