
Unlocking Potential: 7 Features to Elevate User Experience in Your Power BI Dashboards
Transforming Data Interpretation: Enhancing Engagement, Insight, and Accessibility in Power BI Dashboards

Introduction
The digital age has magnified the importance of data, but the real power lies in how we interpret and act on that data. A dashboard’s primary role isn’t merely about displaying numbers — it’s about crafting an immersive and intuitive experience that translates complex data sets into actionable insights. As you strive to enhance your Power BI dashboard’s utility and impact, it’s crucial to understand and integrate certain features that elevate the user experience.
1. Actionable Alerts and Notifications
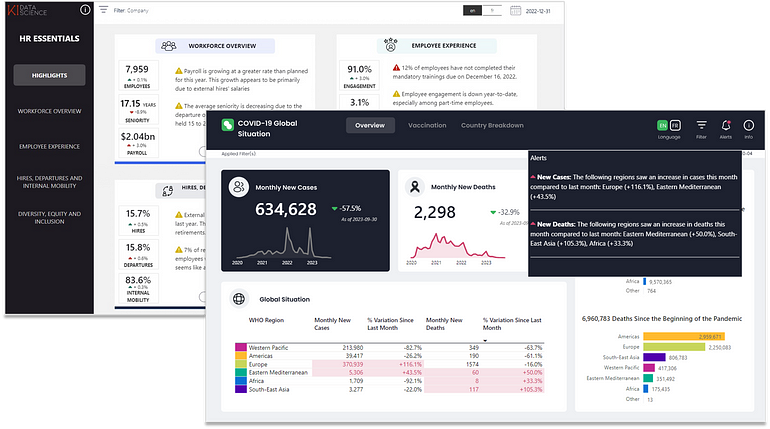
In today’s fast-paced business environment, staying updated is key. A dashboard that actively scans for significant data changes, anomalies, or critical thresholds can be an invaluable asset. Upon detection, the system should not only alert users but also suggest potential courses of action, thereby fostering a proactive approach. It’s not just about knowing what’s happening — it’s about responding efficiently and effectively.
See how you can develop and integrate alerts within your Power BI dashboard in my article Alerts in Action: Powering Real-Time Insights by Integrating Custom Alerts in Power BI.
2. Self-Training Capabilities
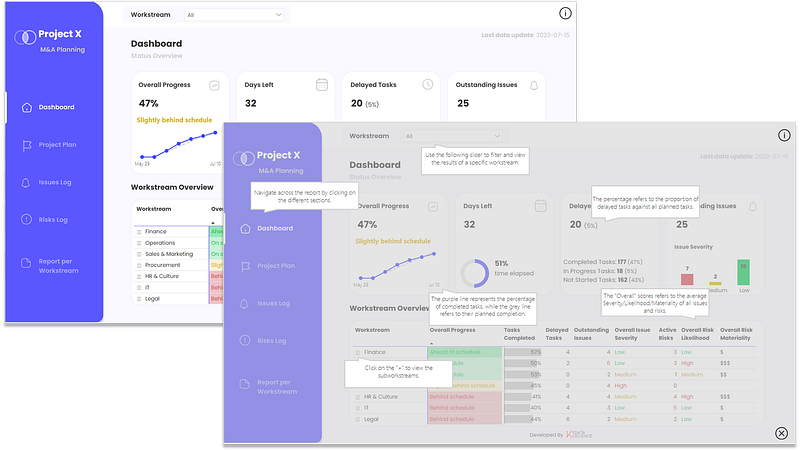
Not every user approaches a dashboard with the same level of expertise. Built-in tutorials or interactive guides serve as a bridge, allowing novices to approach data analysis with confidence. By promoting self-reliance, you reduce external dependencies, streamline the onboarding process, and ensure that every user, regardless of their prior knowledge, derives value from your platform.
You can leverage the use of bookmarks to integrate information views within your dashboard. Guy in Cube has a great video on how to achieve this (view here).
3. Filter Panes
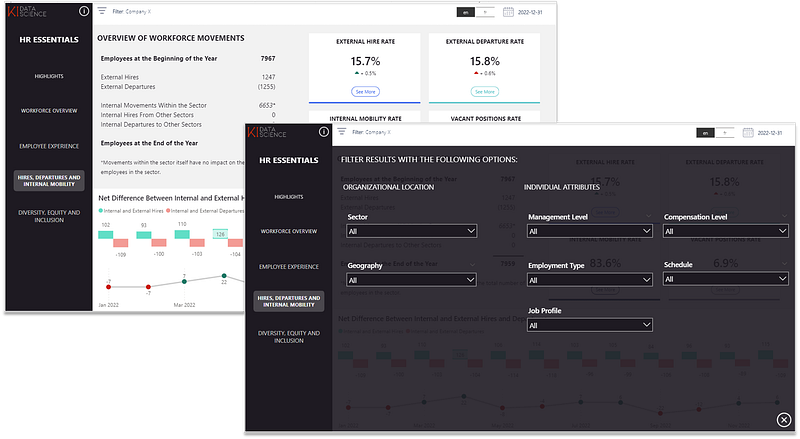
Data is multidimensional, and its true essence is captured when users can view it from various perspectives. Dynamic filter panes, or slicers, empower users to dissect, analyze, and customize their data visualizations.
But with great power comes great responsibility — it’s vital to ensure users are always aware of the filters they’ve applied, preventing potential misinterpretations.
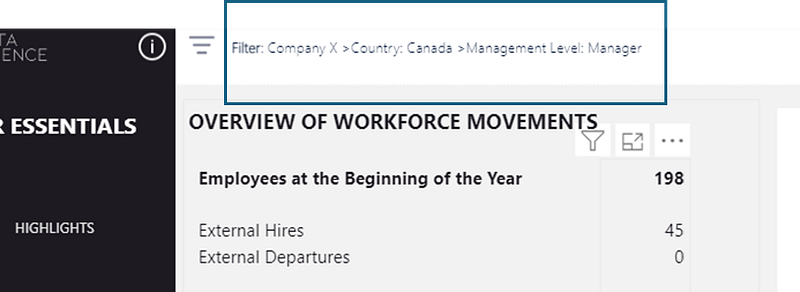
I go into depth in the following article Streamline Data Exploration with a Custom Slicer/Filter Pane in Power BI on how to develop slicers panes in Power BI and showcase how to integrate the information of which slicers have been applied in your report.
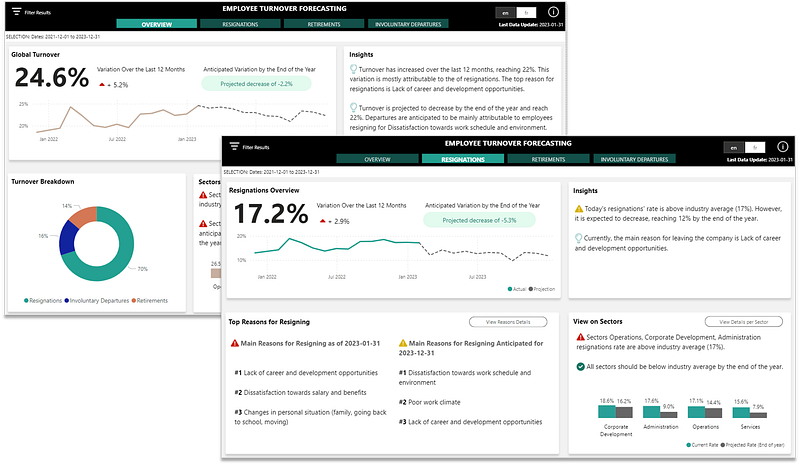
4. Executive Analysis View
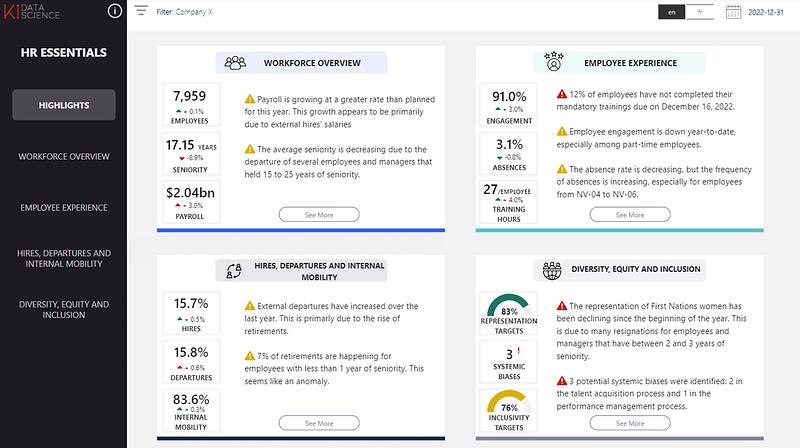
While in-depth analysis is crucial, executives often seek summarized insights for quick decision-making. Crafting a section dedicated to these high-level insights ensures that top-tier decision-makers have immediate access to the data they need most, without sifting through extensive details. However, the option for a deeper dive should always remain accessible.
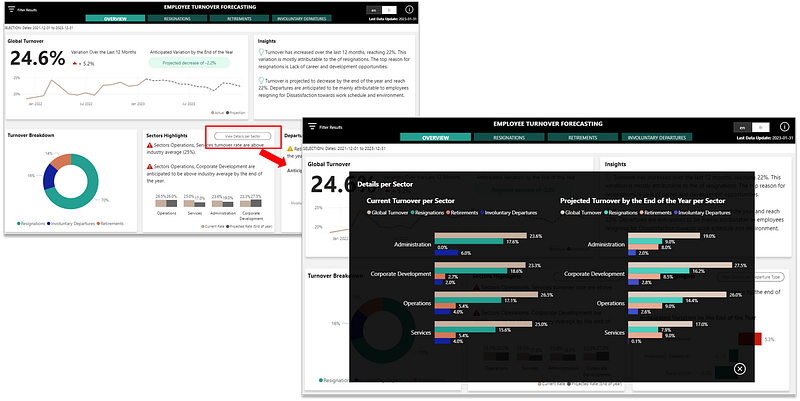
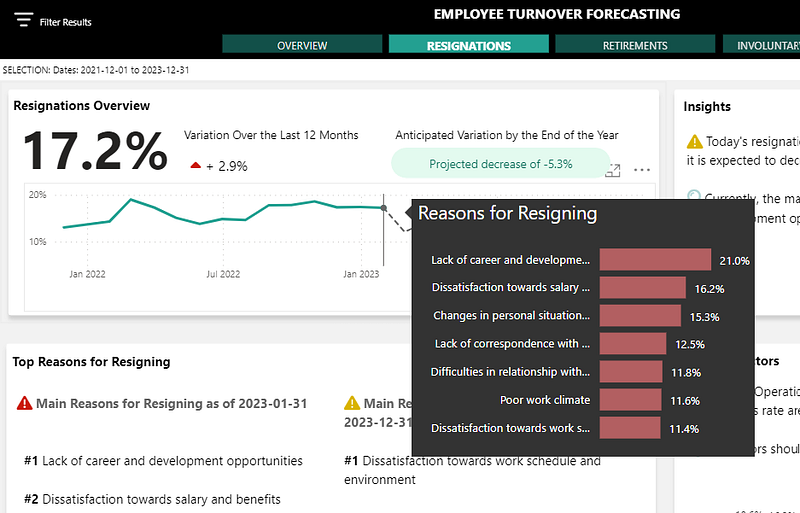
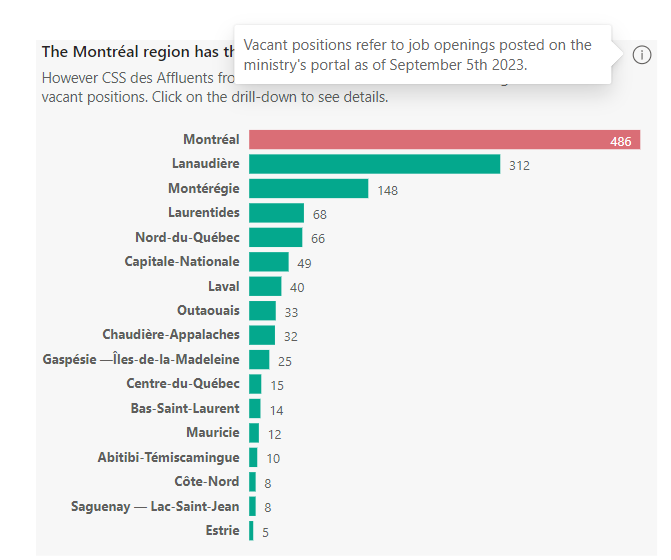
5. Deep Dive Accessibility
True understanding often lies beneath the surface. Users should be able to peel back the layers of data, delving into the intricate details that weave the bigger picture. Traditional drill-downs are one avenue, but there are others. Bookmarks can elegantly reveal hidden content, tooltips can provide context, and intuitive icons can guide users, ensuring that in-depth analysis is never more than a click away. Here are a few examples:
- Leverage bookmarks to show and hide additional content on a strategic indicator.
- Use tooltips to display more info when a user hovers over a chart.
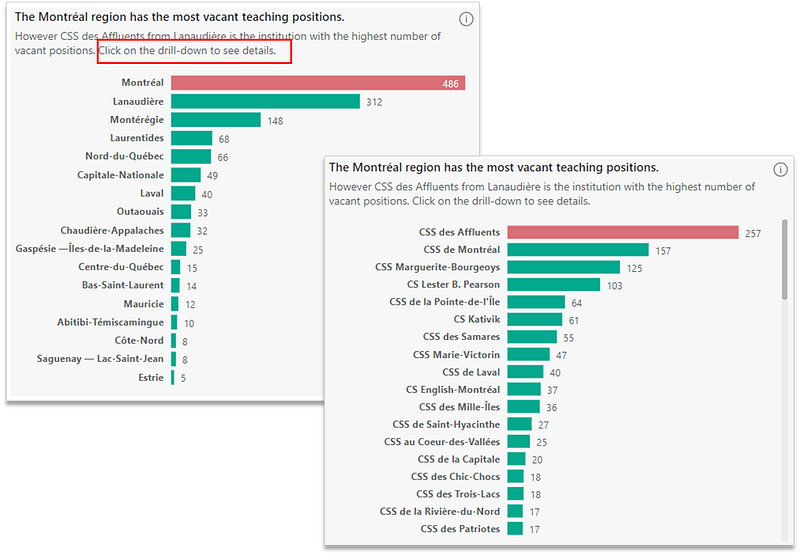
- If you do use drill-downs, be sure to inform users of this feature and even guide them in using it.
6. Embedded Analysis Guidelines
Data can be ambiguous. However, by embedding guidelines, tooltips, and dynamic insights directly into your dashboard, you transform ambiguity into clarity. It’s like having an expert by your side, guiding you through the intricacies of each metric, explaining their relevance, and hinting at the bigger implications.
This can be achieved in multiple ways. Sometimes using dynamic text in DAX measures can help achieve this like in the following example:
You can also help your users data interpretation by maximizing the utility of titles and subtiles. See more how this can be achieved in my article Elevate Your Power BI Bar Charts with 6 Simple Improvements.
7. Multilingual Accessibility
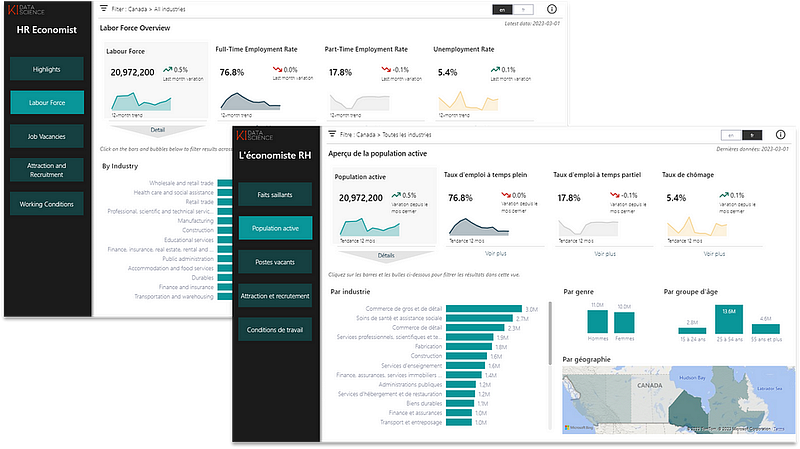
In a globalized world, it’s essential to communicate without borders. A dashboard that speaks only one language limits its reach. By incorporating multilingual support, you invite a broader audience, ensuring that your insights resonate across cultures and geographies.
Thanks to field parameters in Power BI, you can easily integrate translated views to your dashboard. Read my article Enhancing Accessibility: Developing Translated Views in Multilingual Power BI Reports to learn how.
Conclusion
A dashboard isn’t just a tool — it’s a storyteller, a guide, and a strategic partner. By integrating these enhancements, you ensure that your BI tool evolves into a more intuitive, user-centric platform. From immediate updates to global accessibility, these features ensure that every user, regardless of their location, expertise, or role, can extract meaningful insights from your dashboard, driving informed and strategic decision-making.
Your feedback fuels my content! Engage through comments, and if you find value in such insights, your claps encourage more of this content. Thank you for your readership!
Connect or follow me here:
Don’t forget to subscribe to
👉 Power BI Publication
👉 Power BI Newsletter
and join our Power BI community
👉 Power BI Masterclass


