
Elevate Your Power BI Bar Charts with 6 Simple Improvements
The Art of Subtle Enhancements: Transforming Standard Visuals into Engaging Data Stories
Introduction
Data visualization is a powerful tool that, when done right, can transform raw data into insightful stories. Bar charts are commonly used in Power BI because of their straightforward design and ease of interpretation. However, there are several tweaks one can employ to elevate these charts from simple visualizations to more engaging and insightful displays.
Here are six small yet impactful adjustments you can make to your bar charts in Power BI to enhance user experience.
For the presented example, we will be using data sourced from the Quebec Ministry of Education Portal on vacant teaching positions in the Quebec province of Canada.
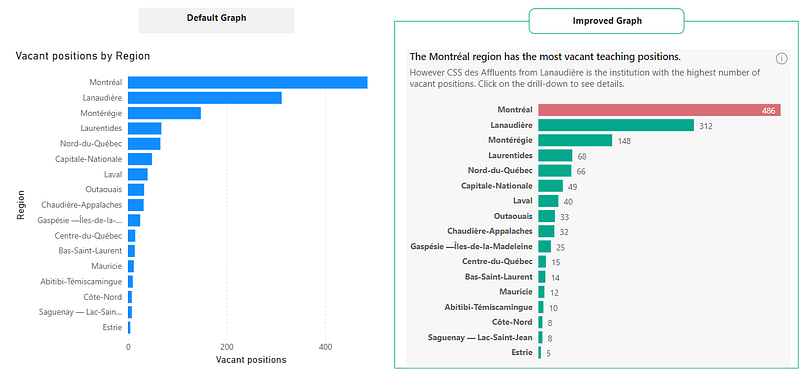
Here is what the visualization will look like:
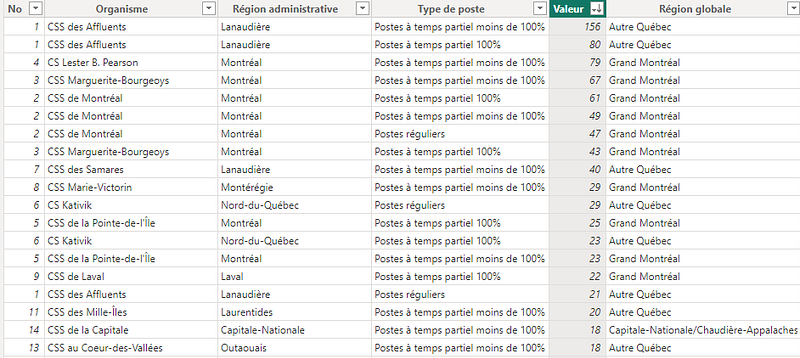
And here is what the data table looks like:
1. Use Intuitive Titles Reflecting the Core Insight
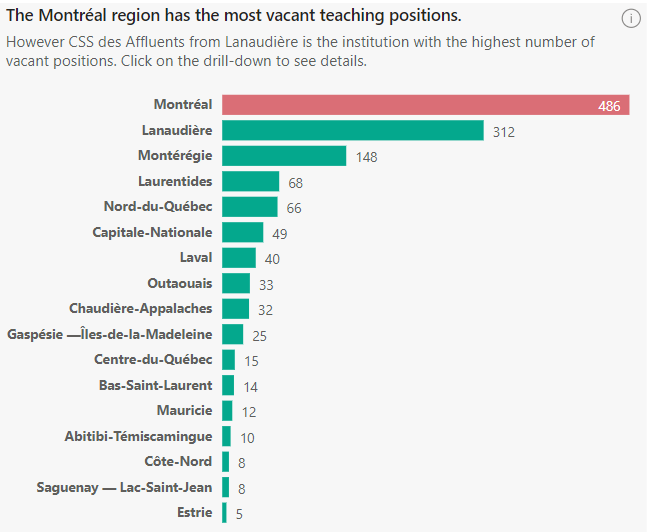
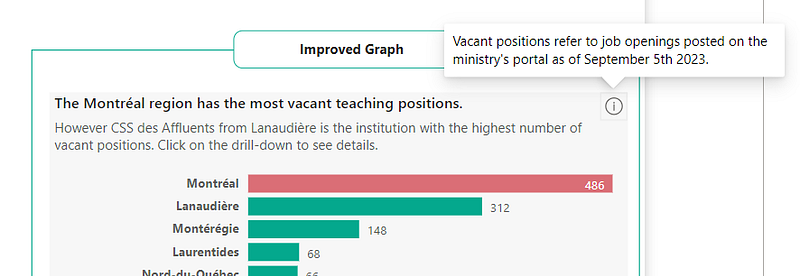
The title of your chart shouldn’t just describe what the chart shows, but rather highlight its main insight. Ask yourself: What’s the one message I want the reader to take away? Instead of a generic title like “Vacant positions by Region,” consider something more insightful like “The Montreal region has the most vacant teaching position.”
In Power BI, create the following DAX measure:
Title =
VAR _TopValue =
CALCULATE(
MAXX(
DISTINCT('Postes vacants'[Région administrative]),
[Vacant positions]
)
)
VAR _TopRegion =
CALCULATE(
FIRSTNONBLANK(DISTINCT('Postes vacants'[Région administrative]),1),
FILTER(
DISTINCT('Postes vacants'[Région administrative]),
[Vacant positions] = _TopValue
)
)
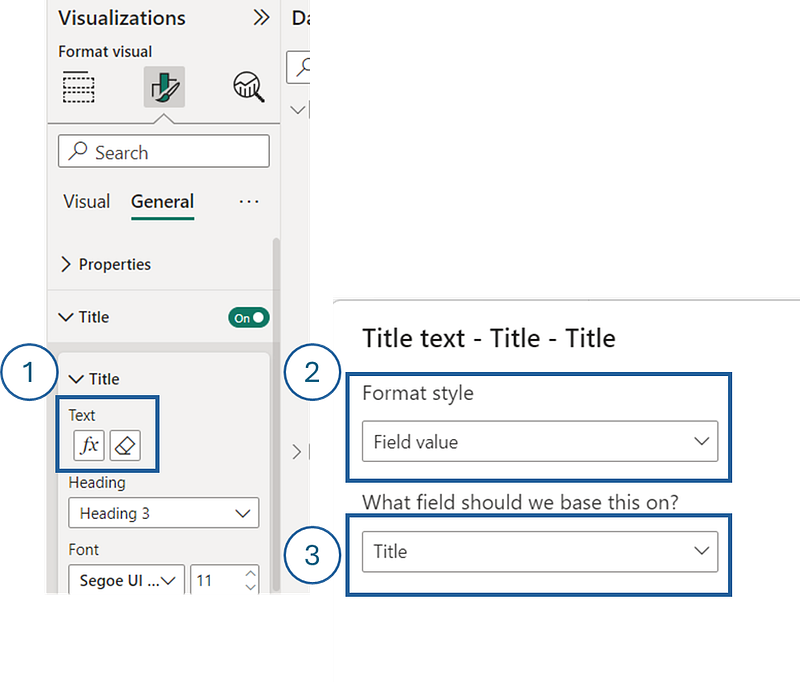
RETURN "The " & _TopRegion & " region has the most vacant teaching positions. " Add the measure to the title of the visual:
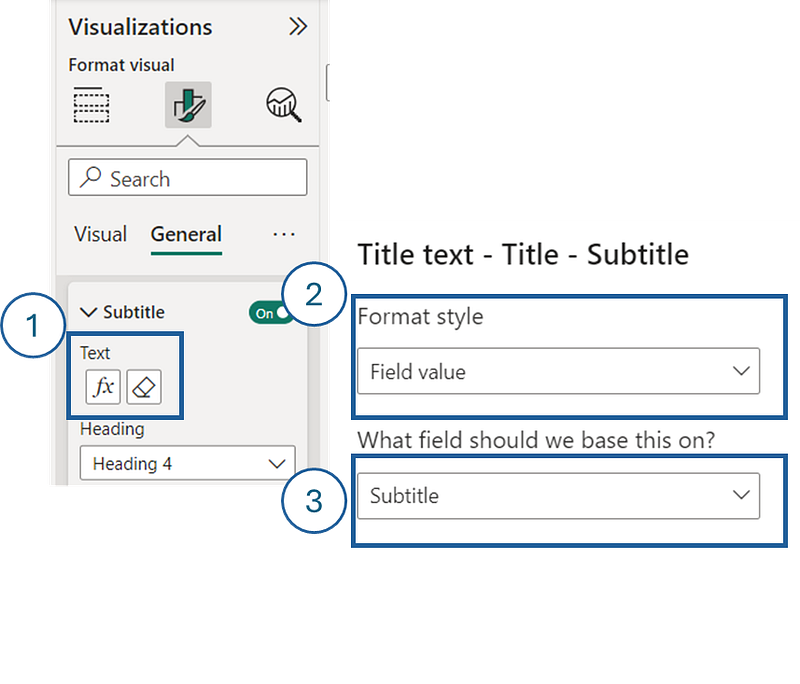
2. Maximize Utility of the Subtitle
The subtitle functionality in Power BI is often underutilized. It’s not just for further descriptions; use it to guide users in their data exploration journey. For instance, following our previous title example, a subtitle like that provides information on the drill-down option can be an inviting nudge for the user.
In Power BI, create the following DAX measure:
Subtitle =
VAR _TopValueOrganisme =
  CALCULATE(
          MAXX(
              DISTINCT('Postes vacants'[Organisme]),
              [Vacant positions]
          )
      )
VAR _TopOrganisme =
  CALCULATE(
        FIRSTNONBLANK(DISTINCT('Postes vacants'[Organisme]),1),
        FILTER(
            DISTINCT('Postes vacants'[Organisme]),
            [Vacant positions] = _TopValueOrganisme
        )
    )
VAR _TopRegion =
    CALCULATE(
        FIRSTNONBLANK('Postes vacants'[Région administrative],1),
        FILTER(
            'Postes vacants',
            'Postes vacants'[Organisme] = _TopOrganisme
        )
    )
RETURN
    IF(
        _TopRegion <> [Top Overall Region],
        "However " & _TopRegion & " from " & _TopRegion & " is the institution with the highest number of vacant positions. Click on the drill-down to see details.",
        [Top Organisme] & " from " & _TopRegion & " is the institution with the highest number of vacant positions. Click on the drill-down to see details."
    )
Add the measure to the subtitle of the visual:
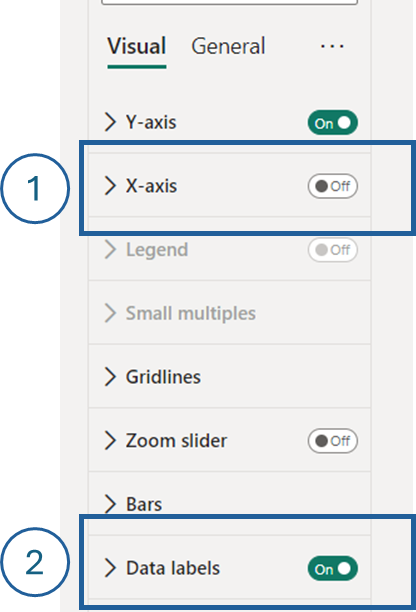
3. Prioritize Data Legibility
If your chart design allows for ample space, consider adding data labels directly to your bars. By doing so, you can potentially remove the axis, which in turn declutters the chart. This direct labeling makes it more straightforward for users to discern exact values without the need to trace back to an axis.
In Power BI, turn off the X-axis and turn on the Data labels:
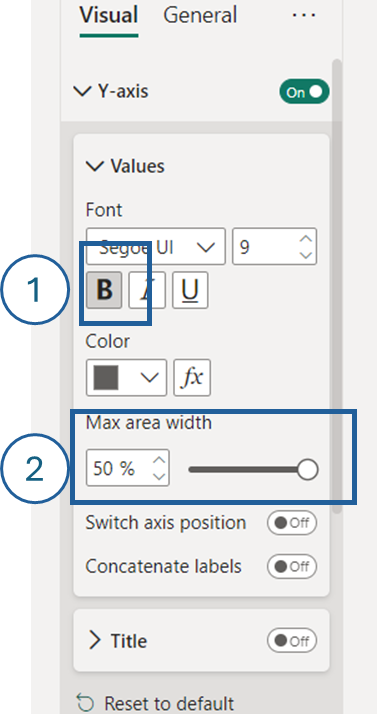
4. Bold the Categories Axis
While this may seem like a mere aesthetic choice, having a bolder categories axis can provide a clearer visual boundary for the data. It distinguishes the categories from the data bars, ensuring that the user’s attention is focused on the most critical parts of the chart.
In Power BI, bold the Y-axis and increase its max area width to 50%:
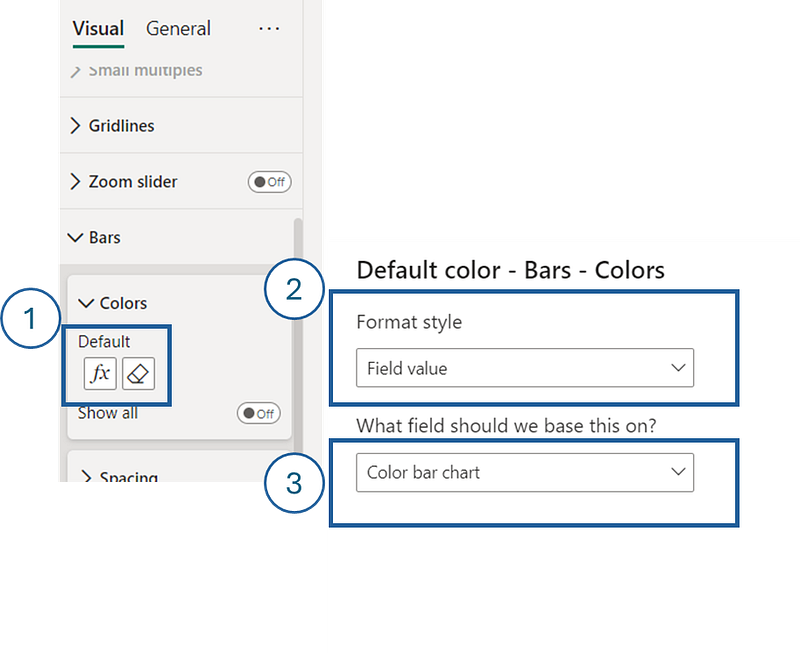
5. Employ Strategic Color Formatting
Colors can serve as a language in data visualization. They can guide attention, indicate patterns, and emphasize outliers. Instead of using colors arbitrarily, be deliberate. For instance, if one region’s sales are substantially higher than others, coloring that specific bar a distinct shade can draw immediate attention to that insight.
In Power BI, create the following DAX measure:
Color bar chart =
VAR _TopRegion = CALCULATE([Top Value],ALL('Postes vacants'[Région administrative],'Postes vacants'[Organisme]))
VAR _Color =
    IF(
        [Vacant positions] = _TopRegion, "#DA6E76",
        "#04A88D"
    )
RETURN _Color
Add the measure to the bar’s color of the visual:
6. Incorporate Metric Definitions with the Info Button
Leverage Power BI’s tooltip feature via the info button to provide additional clarity on showcased metrics. For instance, in our example, we detailed the specific nature of the “vacant positions” mentioned.
In Power BI, add the info button visual:
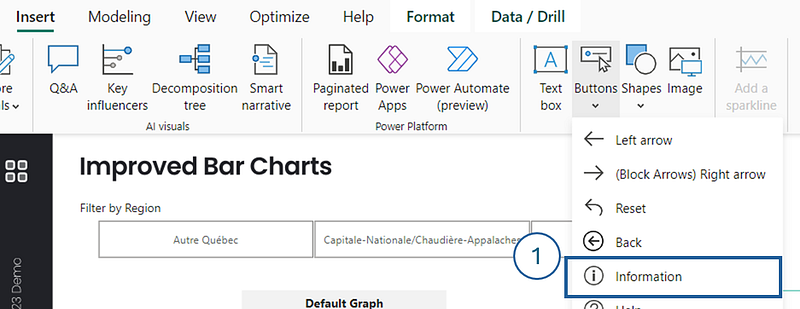
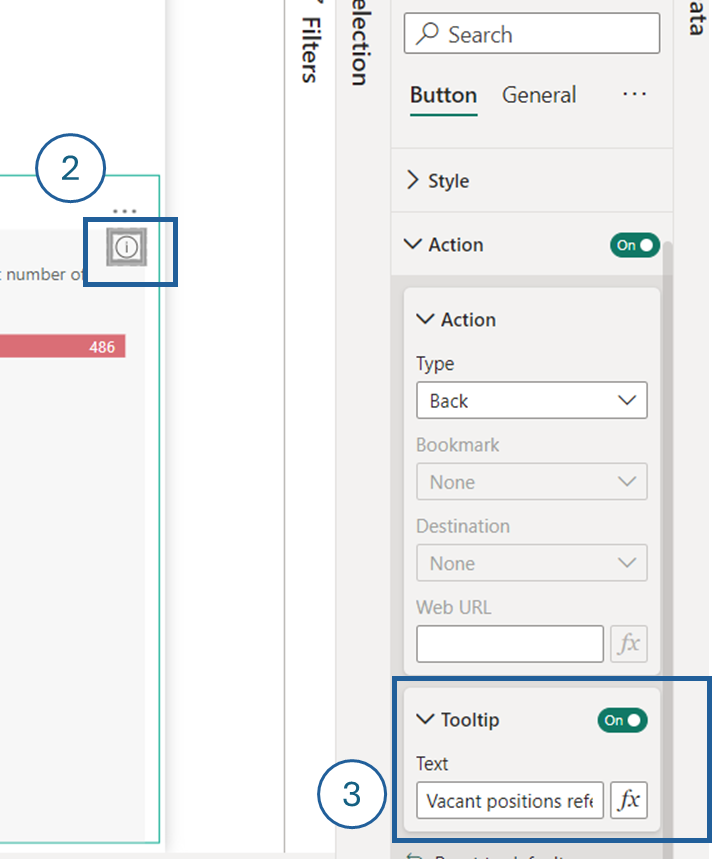
Place the button at the proper location. Turn on the tool tip and insert the required text. As you can see, you could also define this text as a measure, like we did for the title and subtitle.
Conclusion
In conclusion, while bar charts in Power BI are naturally effective, these tweaks can further optimize them for clarity, insight, and user engagement. As with any visualization tool, always be sure to keep your audience in mind, aiming to provide them with the most clear and actionable insights from your data.
Don’t forget to subscribe to
👉 Power BI Publication
👉 Power BI Newsletter
and join our Power BI community
👉 Power BI Masterclass