
This market is F@#&*d!!! Where’s the exit???
More calm, duuudely reflections on the market and investing

1. The idiocy of the crowds…
Last week I showed a similar chart of the S&P500 stock index since March 23 of this year — I updated it to include the most recent week of data — and it shows the absolutely insane upward-rocketing trend continuing despite the calamity our country is experiencing thanks to the ineptitude and criminal behavior of our country’s leader:
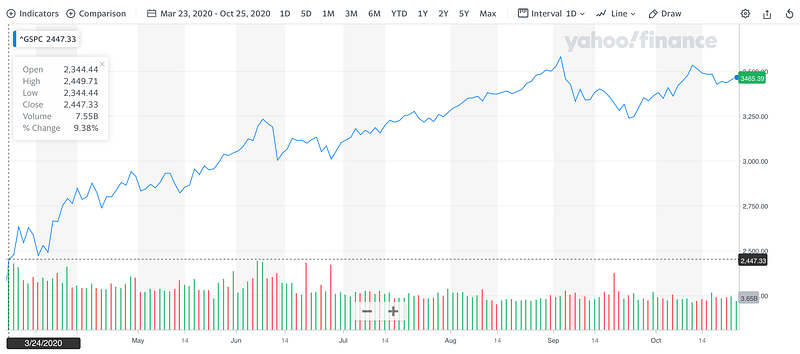
Hopefully, we’re all convinced now that the above stock market response to the current pandemic and resulting economic meltdown is not a rational crowd response — and in fact is a market responding irrationally to the Federal Reserve’s unprecedented cash infusion — ordered by President Nero who is twiddling his very tiny thumbs while the country burns. If you had not seen my previous post, check it out here.
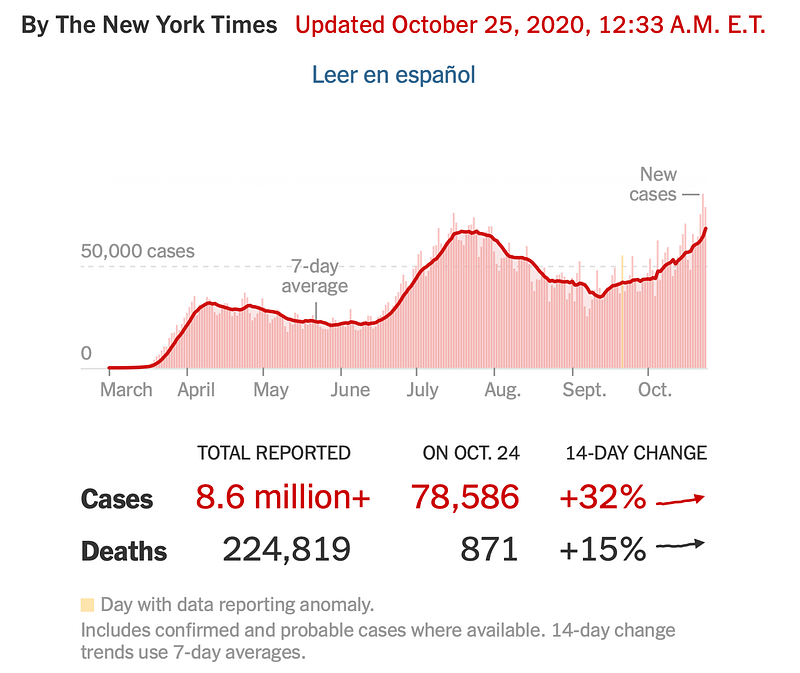
Here is also an updated look at the coronavirus cases which has skyrocketed up even more than what I showed just last week — we now have a new record of over 80 thousand new cases in one day — which really shows how great America is:
If anyone is still convinced that crowds demonstrate some form of wisdom, please educate me on this. I’m totally mystified. I watched, as I’m sure many of you did, as a crowd of millions of investors poured billions of dollars into companies with no plans or customers and having only a few coders and a domain name with a .com at the end, and all of that bidding up of stock prices ended up vaporizing trillions of dollars instantly around the year 2000.
I thought that people would learn, but almost instantly after the dot com crash, home prices began a long inexorable climb up, and I started hearing people investing in houses and saying fundamentally stupid things like “home prices never go down” or amazing variations and permutations of stupidity that was pawned off as “housing wisdom”. And in Less Than A Decade from one blazing act of market stupidity at the turn of the century, We The Freakin’ People did the exact same thing with homes, which again lost us trillions of dollars in evaporated wealth around 2007–9.
And we are now doing the same a decade after the Housing Crash, with the Pandemic Bubble.
We are truly idiots, the crowd of us.
But if you have good examples of the wisdom of crowds, please let me know — I’ll keep an open mind. I want to be convinced that we are smarter than this.
But meanwhile, let’s try to stick to data and see what it can tell us.
2. The hardest-hit sectors…
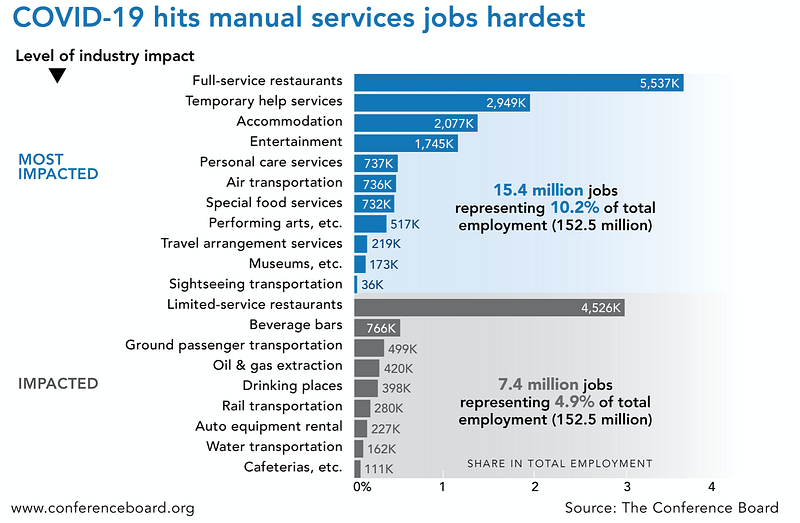
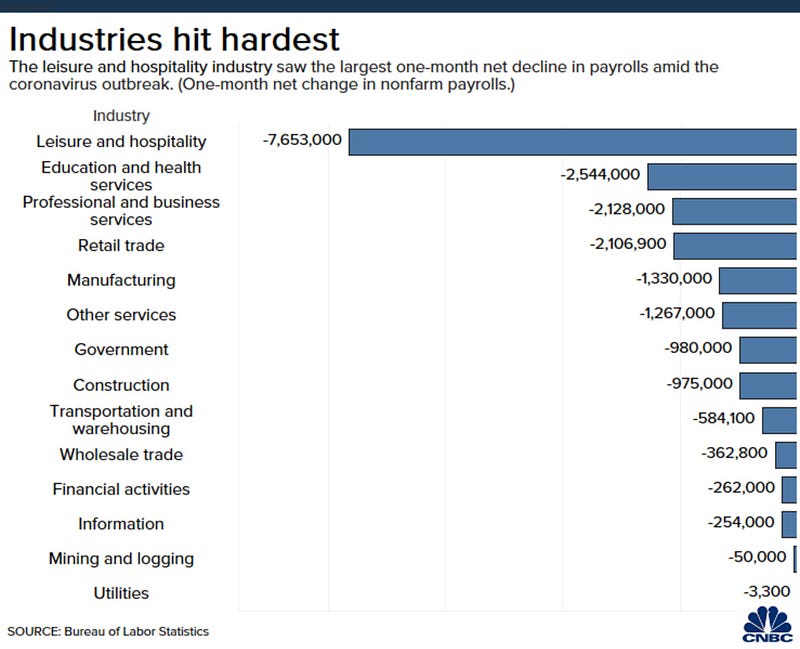
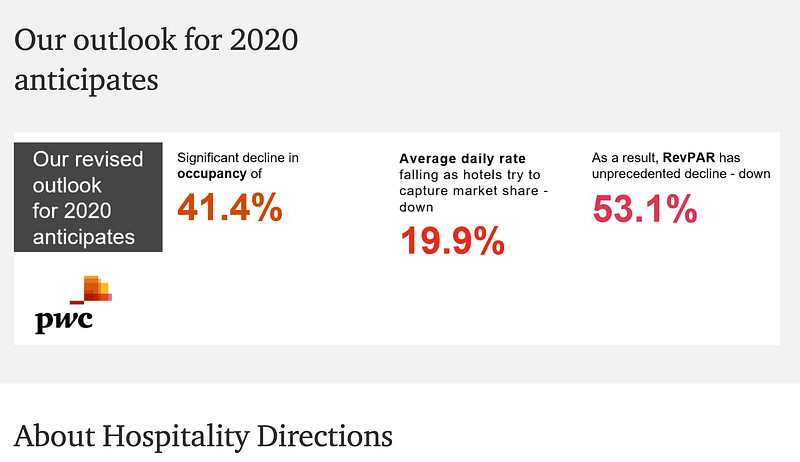
I thought this week I would share some other interesting data. What are some of the most hard-hit areas of the economy here in the US? If you thought “must be leisure and hospitality” then the data supports your wisdom. This is the sector that has suffered the largest job losses by far.
The industry consulting group Price Waterhouse Consulting has the following brutal outlook on the hospitality industry for 2020:
And we know that the investor looks to future returns as the basis for their valuation of a stock. And with such a catastrophic business downturn, the stocks must likewise be hammered, right? So how are the stocks for the hospitality and leisure industry doing? Check out this chart:
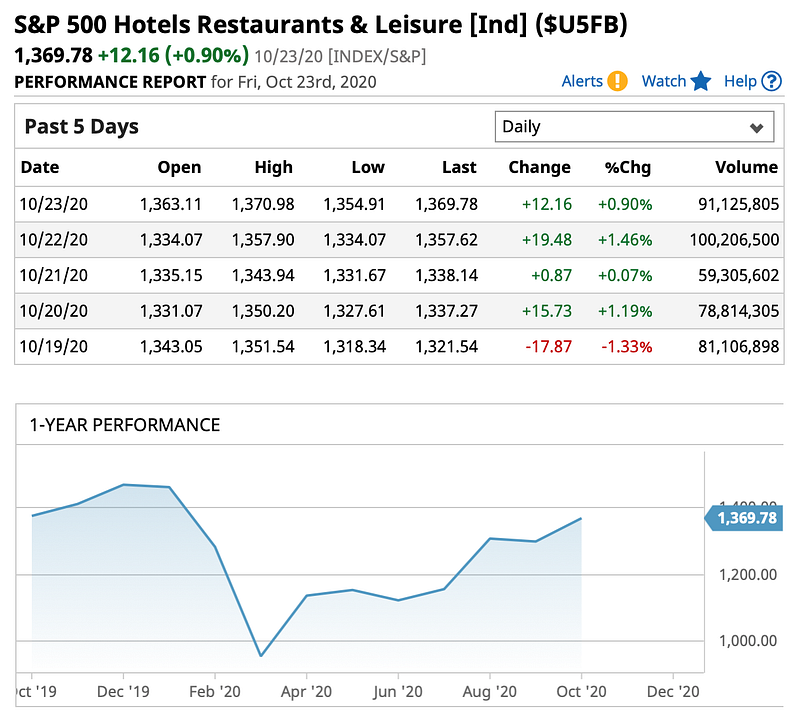
How is that possible? We see a similar crash back in February to March, and the same insane increase as the rest of the stock market from late March until today. How does a greater than 40% reduction in hotel occupancy and more than 50% reduction in revenues, and tens of millions of lost jobs, lead to such insanely rising stock prices?
How does the hospitality and leisure segment of the stock market at least compare to the S&P 500 index overall (which of course includes the hospitality and leisure segment)? Check out this comparison:
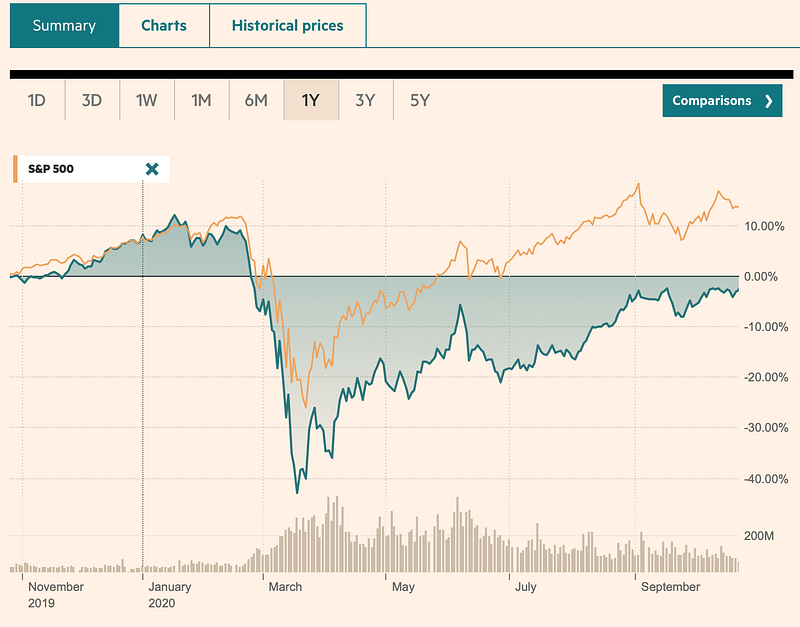
The above chart is a 1-year historical chart, and it shows that the S&P500 overall is valued at over 10% above last year — a fantastic 1-year return for the overall stock market during a normal year. Are we doing 10% better than last year? NO! The hospitality and leisure industry is a mere couple percent lower than a year ago — which is well within normal volatility for an expected normal year. Is the hospitality and leisure industry only a couple percent worse than last year? NO! This stock performance is not what you expect during a pandemic. Do you see that -40% trough back in March of 2020? The Mariana’s Trench of stock returns? That is the correct stock market response to the conflagration engulfing the hospitality and leisure industry right now. That -40% or more is where we should be today. NOT this glue-sniffing, pill-popping, hallucinatory valuation which is a mere 2–3% lower than a year ago.
Now a few of you might be thinking: aren’t you, Science Duuude, expending a little too much emotion over the hospitality and leisure industry here? And in some respects, you would be right. That industry comprises a tiny fraction of the total S&P500.
One of the best sites for viscerally understanding this, for visualizing what for most of us are very amorphous concepts of “the stock market” or “the S&P500”… is a site called visualcapitalist.com. The following is just one of the phenomenal visual tools they provide for us numbnuts who make up the market, to help us understand how the S&P500 stock index is built for example:
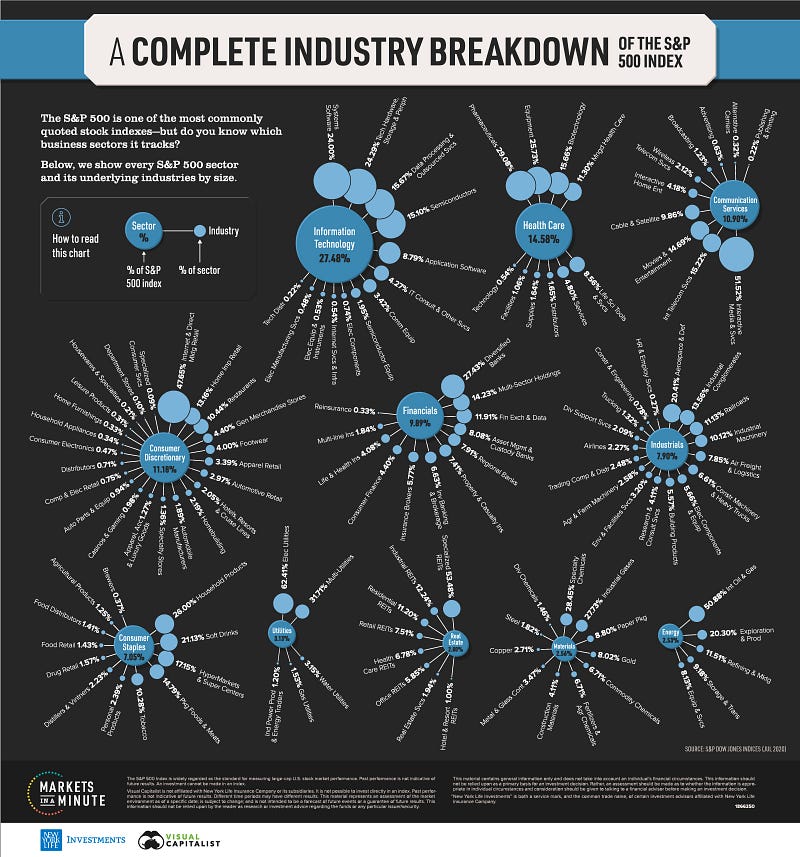
Using this, we can look in the Consumer Discretionary segment which is 11.2% of the index. We can see that Hotels, Resorts, and Cruise Lines makes up 2% of the Consumer Discretionary sector or 0.22% of the index as a whole. Not even a rounding error. Restaurants make up about 10% of the sector, so about 1% of the index. Leisure products make up 0.3% of the sector, and my calculator doesn’t even go that low, OK maybe it does, we’ll call it about 0.033% of the index.
All told, the hospitality and leisure industry, which we all think (and now know) has taken the biggest hit from the coronavirus pandemic, is a tiny proportion of the stock market, so its relatively poor performance has little effect on the index as a whole. Yet we are talking tens of millions of jobs lost in this industry.
This industry has an outsized effect on all of us. Because jobs associated with this industry are some of the lowest-paying jobs among the different industries, the number of people associated with lost business in this industry is affected out of proportion to how the industry is represented in the stock market. There is a big disconnect between the stock market, the real jobs in the economy, and our everyday lives. Each of us lives in a town or city with restaurants, hotels, and other entertainment venues. Many of us or our neighbors are employed in these companies, whether the business is listed on a stock exchange or not… and most are not. Many are mom-and-pop, single-location companies.
The jobs impact graph that I showed above shows a much more important metric and view of this industry than does the stock chart. But the stock chart is what we often stare at because that reflects our investment portfolios, and therefore our retirement as well as our feelings of wealth (or poverty).
But… those tens of millions of lost low-wage jobs in the graph will translate later into lost sales for, let’s say, electronics, cars, health insurance, and on up the line — the industries that we are more likely to invest in or focus on — suddenly the impact of these job losses is bigger than just the tiny hospitality and leisure industry itself.
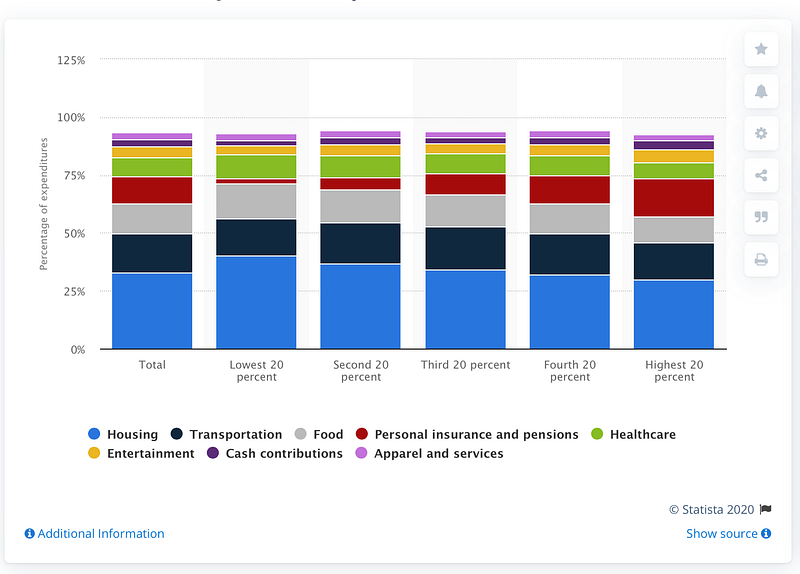
Recall that low-wage workers have to spend every penny they earn on products and services and almost none is saved for a freakin’ investment portfolio. Note in the next figure, for the lowest income quartile, there is almost nothing spent on personal insurance and pensions — savings. Investments. The future. None of that. Almost everything is thrown right back into the economy for housing, transportation, food, healthcare… the big areas of our economy.
Professional types (of whom I classify myself), duuudes who have a portfolio typically don’t give a crap about those who don’t have one, because we think they don’t work hard enough to deserve one, or are otherwise undeserving. Somehow, the professional or investing class has gotten a misinformed and short-sighted perspective that business expenses, costs, are more important than revenues. That it is more important to reduce wages and control costs than it is to increase wages and increase revenues from those same people. Hopefully, we’re all smart enough not to think like that, or have learned that such thinking is short-sighted, uninformed, and incorrect. Hopefully, if this pandemic does anything, is fix that misguided and backward thinking.
3. The golden-child sectors…
I don’t want to be a complete and total wet blanket about the stupidity of our markets. We (I) can try to be a little more optimistic, even ignoring that the markets currently are totally inflated by the idiocy of the President and those who enable him and try to see which areas are performing well. OK, we can do that. I can. Actually, let me outsource that effort:
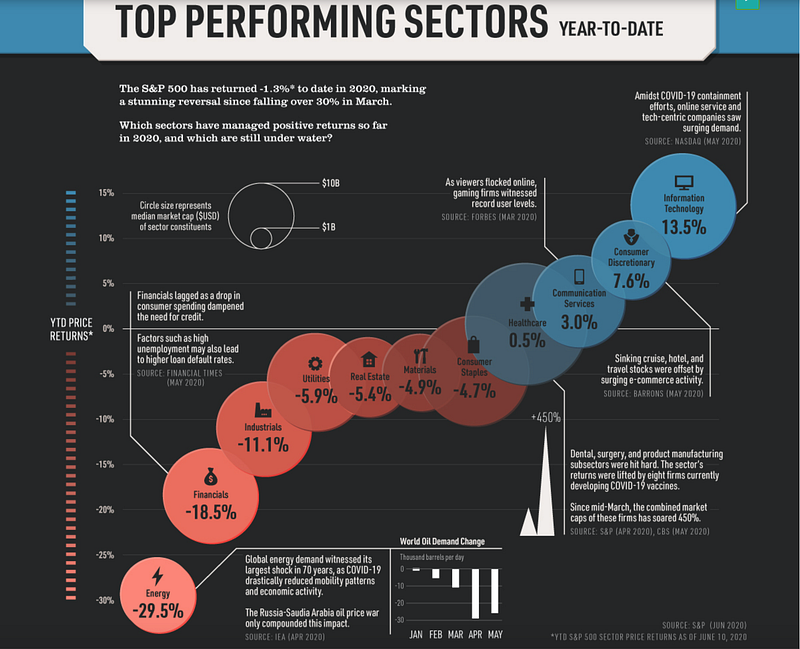
You can see from the chart above that Information technology, as of July 2020, returned about 13.5% as a sector since the start of the year, compared to the market suffering a 30% crushing in late March. Consumer Discretionary returned about 7.5%, followed by Communication Services at 3%.
Who are some of the best performing S&P500 stocks? Well, that depends acutely on the day as things are so volatile, but let’s take a very recent ranking in October 2020:
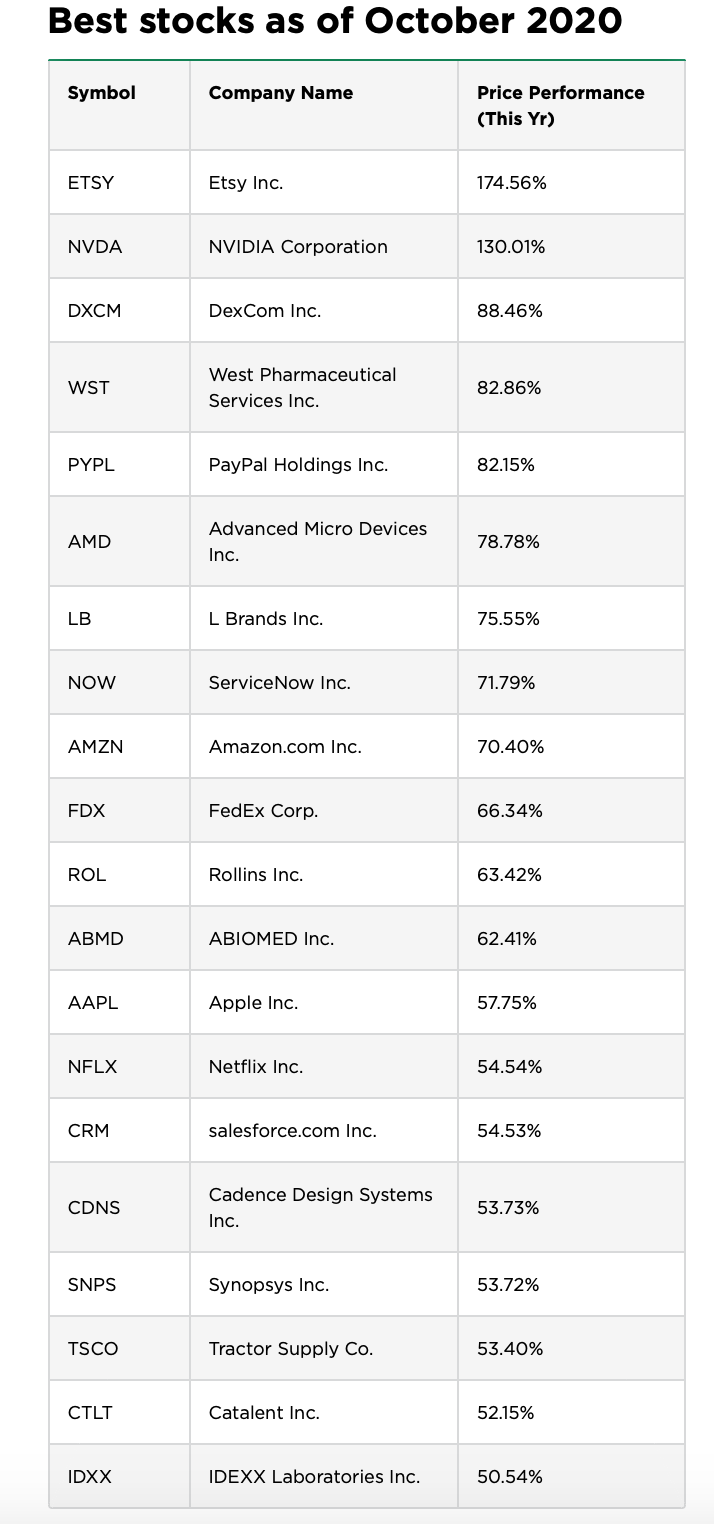
Now that is interesting, isn’t it? The top-performing S&P500 stock is Etsy, a company that hawks crafts online — a consumer discretionary company as labeled by the good folks at S&P. But let’s play with this a little.
Going down the line, we can find which industry each company is a part of, using this online list here. We can also find what weighting each company represents in the S&P index, using this online list here. And we can multiply the Price Performance by the index weighting. Why do we do this? Because the weighting represents how much of the index each company represents. Apple, for example, even though it is one of 500 companies, represents about 6.5% of the index because of its size and stock price. If every company was given equal weighting, each would have 0.2% weight. Etsy, on the other hand, represents less than 0.1% of the index. So although Etsy has increased by 175% in stock price, the impact of that is scaled down because it is such a small company compared to Apple. Adding these new data to the list above, we create a little spreadsheet below:
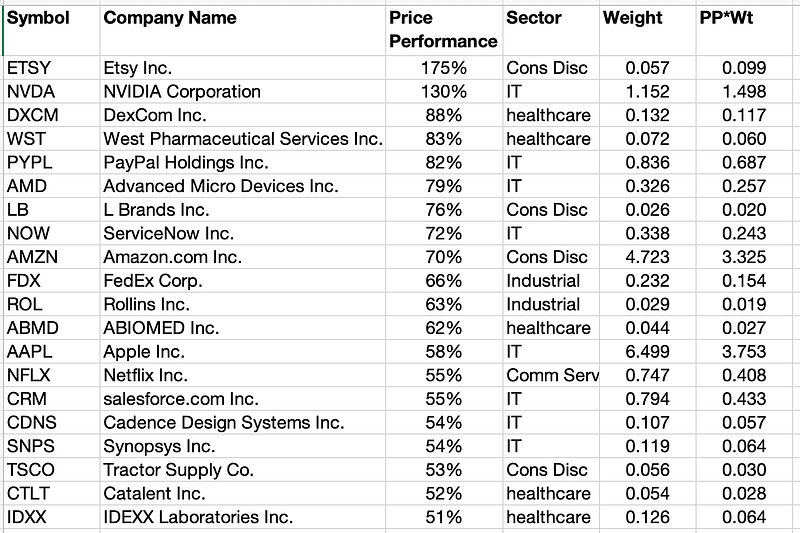
When that list is ordered by the absolute price performance in the 3rd column, we see IT scattered randomly throughout the consumer discretionary, industrial, and healthcare companies in the original list.
But, if we re-order that list of best-performing S&P500 stocks, and make it in descending order from the best index-weighted return of the S&P500 stocks, we get the following list:
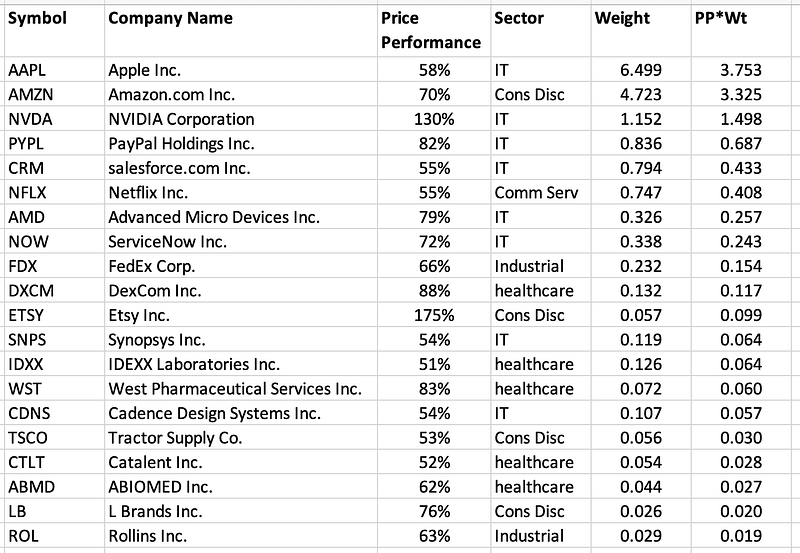
Now we see something pretty fascinating. IT is clustered mostly towards the top now. Furthermore, we have to question the labeling of Amazon and Netflix as consumer discretionary and communication services companies, respectively. Anyone who looks at how these companies operate will recognize that they are as much information technology companies as Apple, NVDIA, and others.
So how are AAPL and AMZN doing, the two companies who are by far outperforming the rest of the S&P by weight-adjusted returns? Let’s look at a couple of quick metrics like revenue:
AAPL revenue and growth charts
We see Apple is performing just fine for such a massive company, one selling an expensive discretionary electronic device like the iPhone. Despite a 30% contraction of the US GDP, Apple in contrast has actually seen a little bit of growth, at least as of their last reporting quarter in June of this year. So, Apple deserves to be doing pretty well (though we can argue whether a 58% price increase is appropriate this year, but that’s another conversation).
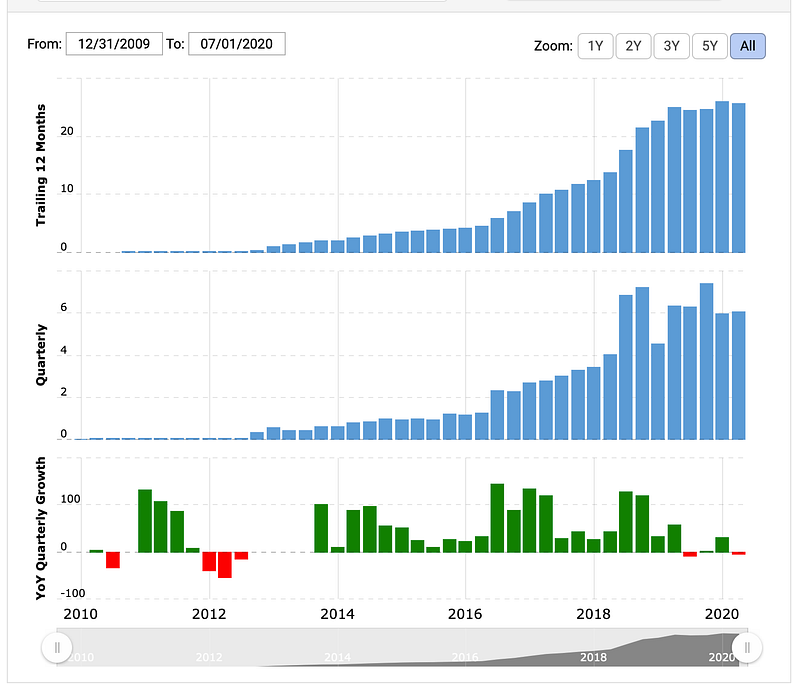
Let’s take a look at Amazon here:
AMZN revenue and growth charts
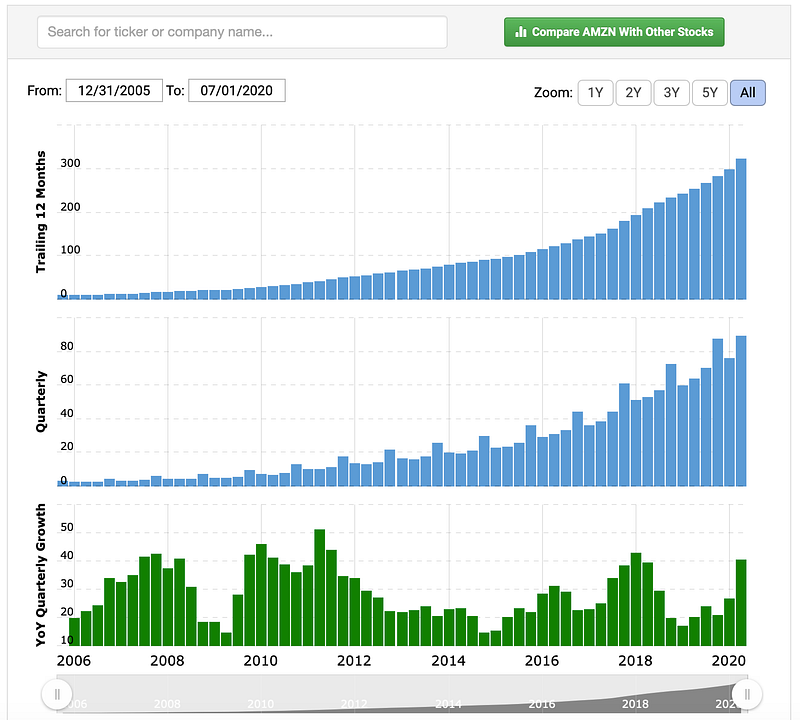
Amazon, in contrast, is tearing the roof off the building and notched over 40% year over year quarterly growth.
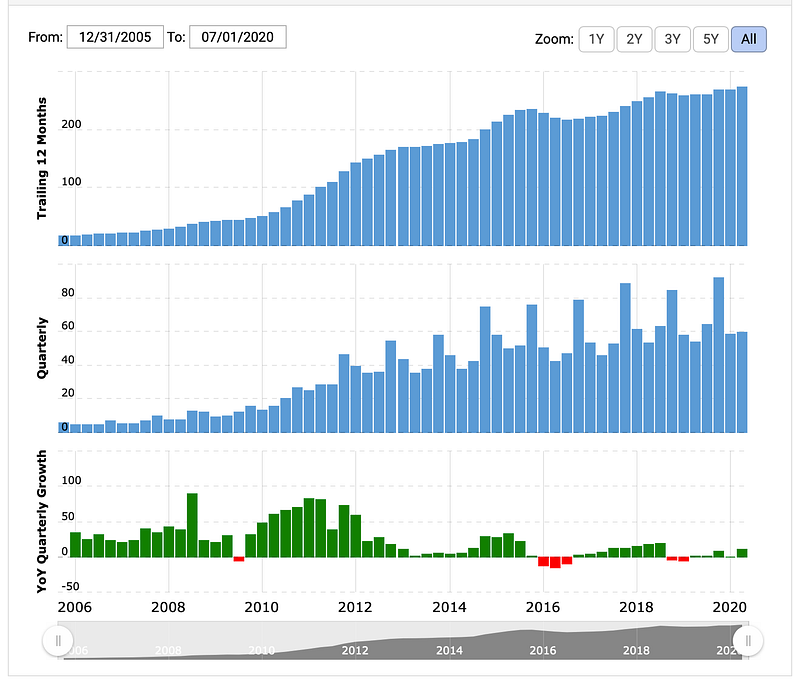
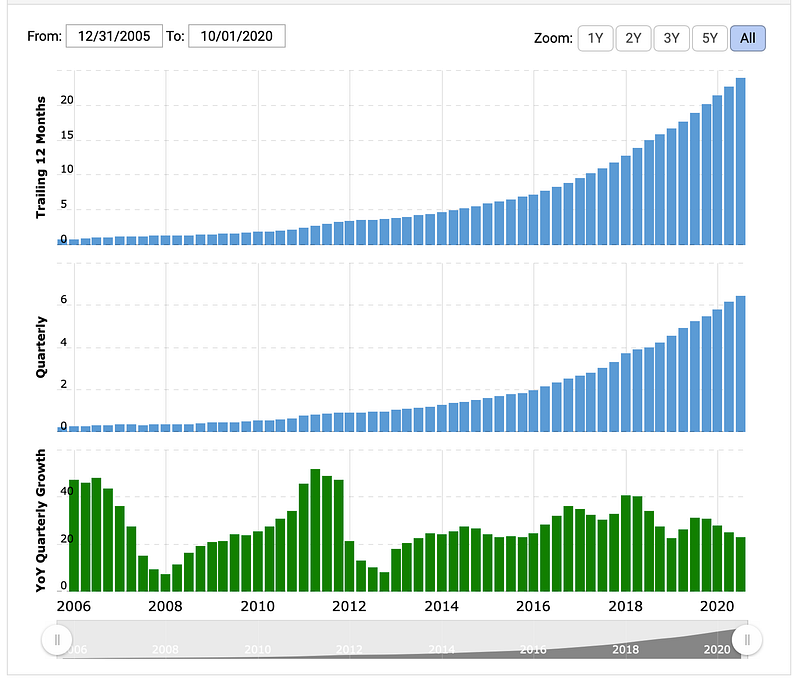
NVIDIA, similarly recorded about 50% YoY quarterly growth. Paypal exceeded 22% growth. Salesforce almost reached 29% growth. Netflix (one of my favorite companies along with Apple and Amazon), hit 22.7% growth.
NFLX revenue and growth charts
Another of my favorite companies is Tesla, particularly because no one seems to like them. I take particular pleasure, I think the formal term is being contrarian, in profiting in companies other investors seem to especially dislike or pour hate onto or feel unusual emotion towards:
TSLA revenue and growth charts
These are companies we should NOT be surprised are doing well during this shredded economy. Apple, Amazon, Netflix, and even the youngest of the group, Tesla, have demonstrated in past recessions that they can grow significantly during a recession when most other companies are shrinking, losing revenues, laying off thousands of employees, in desperate survival mode. But during the housing crash and subsequent recession, the worst since the Great Depression, each of the companies I named grew. And they are doing so now again.
What was that you said? Why are those companies so special that they can grow revenues at insane rates during recessions when other companies are dying?
Who do you think I am? Warren Buffett? Paul Krugman? Adam Smith? I’m just a duuude. I’ve made a small observation, and am sharing it with you. That there are companies, that despite the conflagration burning down our economic house, now and in the past, seem to be fire-proof. Seem to even thrive amid the flames. And have a history of doing so. Granted, these don’t have Sears and Roebuck’s history (what, did you say Sears is dead?).
These are the companies we want to be invested in, during good times and in bad.
Long term buy and hold, with a few good companies like these (AAPL, AMZN, NFLX, TSLA…), gives you the buffer to endure during tough times like these we’re in now. Nothing about trying to optimize returns or blow the roof off. Just a low-stress way to a higher probability for excellent returns than any other method out there. Long term buy and hold (LTHB).
Good luck out there, and good wisdom to y’all!
4. Thank you…
Thank you for reading, and please share! If you enjoyed this, or even if you didn’t, please read last week’s ruminations here:
And here:
I have a deep dive on Tesla, that although triggered by the recent quarterly report, I think has longer legs that his quarter:
I did a review of Netflix here I think is worth your time:
And I have a series on Starlink since it is such a fascinating company changing quickly: