
Getting Insights from 3,000+ Clinical Trials in a Knowledge Graph
Build an analytic platform with Google Healthcare Natural Language API, the Unified Medical Language System, and Neo4j

Clinical trials are the cornerstone of biomedical progress. They validate the safety and effectiveness of novel diagnostics, therapeutics, and preventive strategies on human volunteers. Each trial generates a trove of data, meticulously documenting experimental protocols and patient outcomes. However, this wealth of knowledge is often scattered across diverse databases and encoded by various terminologies. These data silos hinder collaborative research, hide valuable insights, and ultimately slow down the pace of medical advancements.
In my previous articles, Clinical Trials as Graphs and Vectors and Build a Chatbot for Clinical Trials Across Multiple Data Sources, I have described my full-stack clinical trial knowledge graph. Its data came from clinicaltrials.gov, a prominent database for clinical trial data. While serving as proof-of-concept demonstrations, the two projects only worked with a small dataset of roughly 70 trials. However, we must analyze a larger dataset to discover statistical trends and patterns. Furthermore, we can use Google Healthcare Natural Language API to recognize named entities from raw texts (NER) and map them to some well-established biomedical ontologies, such as the Unified Medical Language System (UMLS). Finally, we can enrich the knowledge graph with other data sources, such as the Global Burden of Disease (GBD).
The code for this project is hosted on my GitHub repository here.
1. Data and architecture
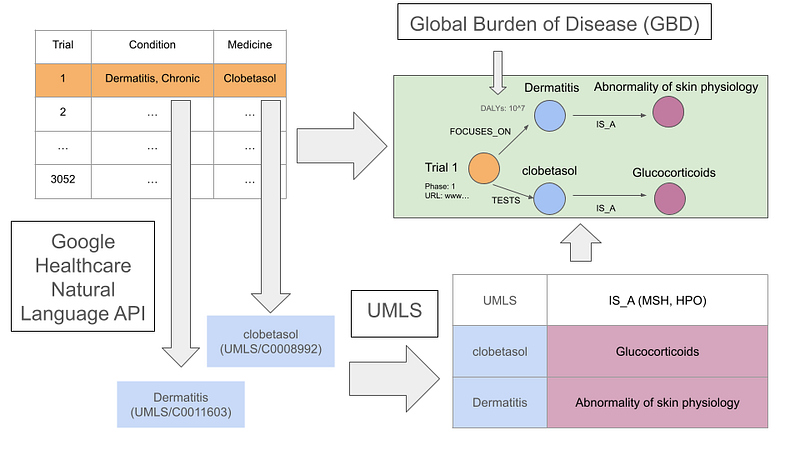
On the one hand, this project’s clinical trial data was provided by a consortium of clinical study sponsors from clinicalstudydatarequest.com (CSDR). The TSV data contains information on 3,052 trials. It details the medical condition, medicine or vaccine, phase, and sponsor for each trial. On the other hand, the GBD data contains the global mortality data and Disability‐Adjusted Life Years (DALYs) in 2019 for over 300 diseases. GBD defines DALYs as the sum of years of life lost (YLLs) and years lived with disability (YLDs).
Although the CSDR data is highly structural, there are still remnants of manually entered information in the condition and medicine or vaccine columns. Consequently, it is necessary to preprocess these raw texts and map them to some standardized vocabularies, such as the UMLS. The NLP results should be reproducible. That is, the pipeline should consistently generate an identical knowledge graph using the same software and data. It should also operate with a high degree of automation and cost-effectiveness. In other words, some manual curation of the NLP results is not avoidable, but it should be minimal.
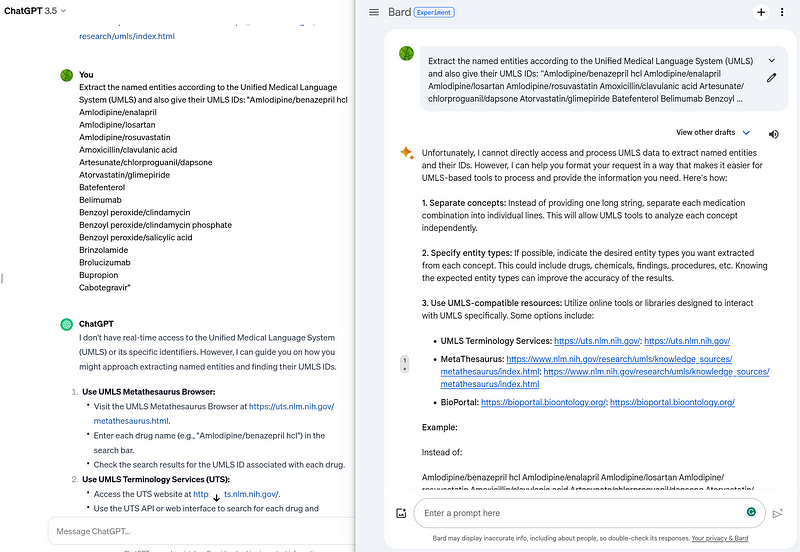
In this case, GPT-4 and Bard are not eligible for this project due to these standards. Firstly, these Large Language Models (LLM) are unable to ensure reproducible outputs, a limitation that GPT-4 Turbo promises to address soon. Secondly, I cannot find a way to instruct these LLMs to do UMLS-based NER and entity linkage for raw texts (Figure 1). Thirdly, in my opinion, the cost of commercial LLM is still a bit too high.
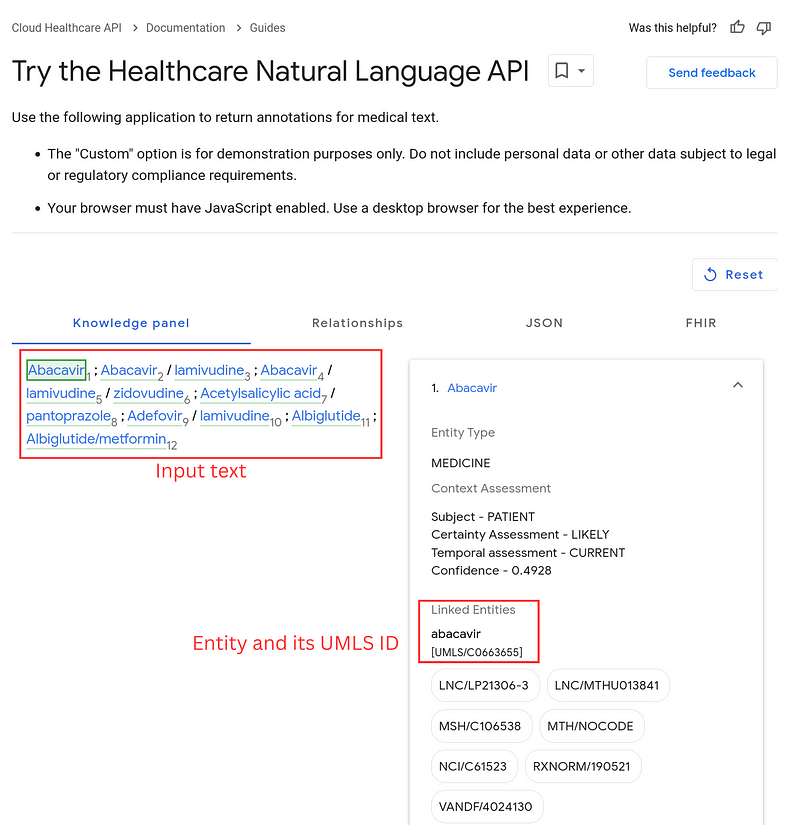
Under these considerations, I chose Google Healthcare Natural Language API for NER and entity linkage in this project. It is noteworthy that this Healthcare Natural Language API and the Natural Language AI are two separate GCP services, despite their similar names. The Healthcare API captures medical terms and, more importantly, outputs their UMLS IDs (Figure 2).
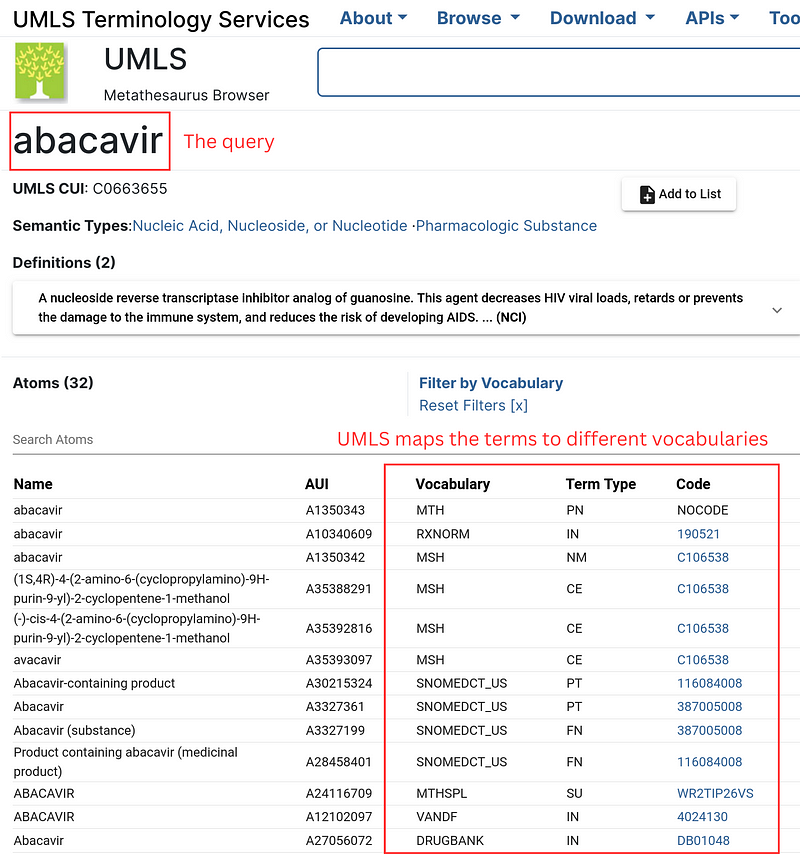
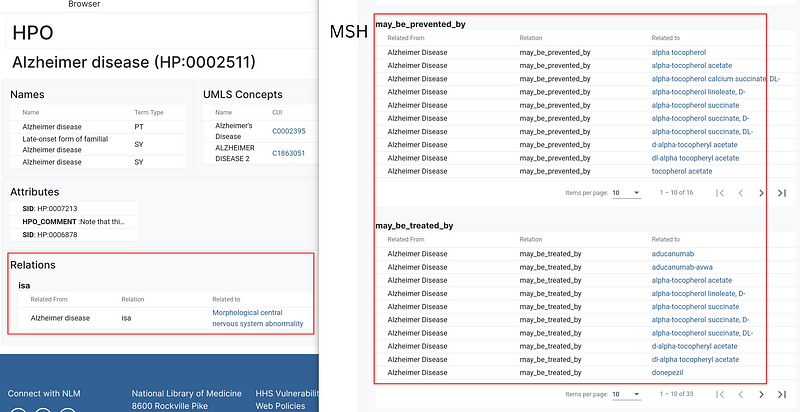
The UMLS is like a gigantic multilingual index book for medical terms. It also collects the synonyms and spelling variants. In addition, it maps the terms to many vocabularies. These vocabularies provide descriptions and ontologies from multiple angles (Figure 3). For example, for the concept Alzheimer Disease, the Human Phenotype Ontology (HPO) reveals that it is a Morphological central nervous system abnormality, while the Medical Subject Headings (MSH) show the drugs that can be used to prevent or treat the disease (Figure 4).
These components form my data pipeline (Figure 5).
This pipeline can generate reproducible knowledge graphs. Because they adhere to UMLS and its vocabularies, they are also easily extendible and sharable. But the pipeline still requires some “human-in-the-loop” curations. That is especially the case for the Healthcare Natural Language API. For example, Benzoyl peroxide/clindamycin was wrongfully split into benzoyl peroxide and clindamycin, while the similar term Benzoyl peroxide/clindamycin phosphate was appropriately recognized as Benzoyl peroxide/clindamycin. Also, measles, mumps, rubella were not recognized at all. These exceptions had to be corrected during the post-processing. The pipeline also includes a pre-processing step that fixes the typos. It helped the NER system capture more entities.
2. Python implementation
The whole pipeline is in Python. Communication with the Google API is the first step. Strangely, I cannot find any official Python library for the Healthcare Natural Language API. So I have written my own. For example, the API call is implemented like this (Code 1).
# Code 1
def get_healthcare_json(text: str, gcp_token: str) -> str:
    data = {'documentContent': f'{text}'}
    post_data = json.dumps(data)
    headers = ['Content-Type: application/json', f'Authorization: Bearer {gcp_token}']
    buffer = BytesIO()

    c = pycurl.Curl()
    c.setopt(c.URL, 'https://healthcare.googleapis.com/v1/projects/neo4j-dashboard/locations/us-central1/services/nlp:analyzeEntities')
    c.setopt(c.POSTFIELDS, post_data)
    c.setopt(c.HTTPHEADER, headers)
    c.setopt(c.WRITEDATA, buffer)
    c.perform()
    c.close()

    response = buffer.getvalue().decode('utf-8')

    return response
Afterward, I wrote a wrapper library to extract the relevant data from UMLS, HPO, and MSH. For example, given an ID, the get_all_items function in Code 2 retrieves all the pages from a specific vocabulary and sends the pages to the get_item function to extract the individual item.
# Code 2
def get_all_items(source_name: str, id: str, extra_parameter: str, umls_token: str):
    url = f"https://uts-ws.nlm.nih.gov/rest/content/current/source/{source_name}/{id}/relations?{extra_parameter}&apiKey={umls_token}"

    response = requests.get(url).json()

    if "status" in response and str(response["status"]) == "404":
        return []
    else:
        page_count = int(response["pageCount"])
        results = get_item(response)

        for i in range(2, page_count+1):
            new_url = url + f"&pageNumber={i}"
            new_response = requests.get(new_url).json()
            results += get_item(new_response)

        return results

def get_item(response: str):
    result = []

    if "result" not in response:
        return result
    else:
        for r in response["result"]:
            if r["classType"] == "AtomClusterRelation" and "relatedId" in r and "relatedIdName" in r:
                item_id = r["relatedId"].split("/")[-1]
                item_name = r["relatedIdName"]
                result.append((item_id, item_name))
        return result
For medical conditions, I extracted the taxonomic hierarchies from HPO, the may_be_treated_by relations from MSH (Code 3), and the mortality values and DALYs from GBD. The chemical names for the GSK medicines also came from MSH.
# Code 3
for hpo in tqdm(hpo_condition):

    results = umls_api.recursive_get_parent_HPO(hpo, umls_token)

    for r in results:
        hpo_from_to.append((r[0], r[1]))

        if r[1] not in hpo_condition:
            hpo_name[f"HPO/{r[1]}"] = r[2]

    for u in hpo_condition[hpo]:
        umls_to_hpo.add((u, hpo))


for msh_id in tqdm(msh_condition):

    #print (msh_id)
    results = umls_api.get_all_items("MSH", msh_id, "includeAdditionalRelationLabels=may_be_treated_by", umls_token)

    if msh_id not in msh_treated:
        msh_treated[msh_id] = set()
    for r in results:
        msh_treated[msh_id].add(r[1])

    for u in msh_condition[msh_id]:
        umls_to_msh_condition.add((u, msh_id))
The pipeline integrates all these data from different sources and arranges them into nodes and relationships. The output files are all in TSV formats.
3. The knowledge graph sheds lights on drug repurposing
Once all the data were ready, I imported them into Neo4j and constructed a graph with the following schema.
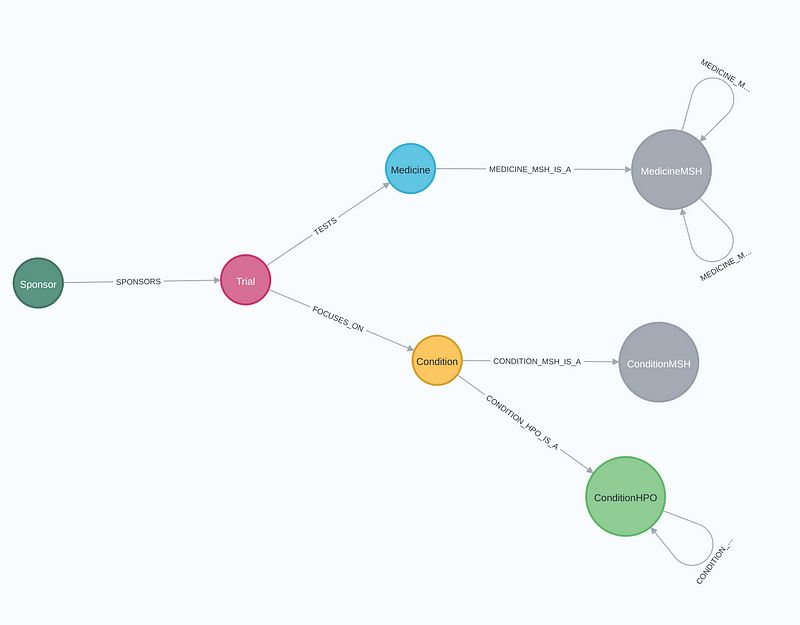
A trial is broken down into Sponsor, Trial, Medicine, and Condition nodes. The MedicineMSH, ConditionMSH, and ConditionHPO nodes are created to encompass the MSH properties and HPO ontologies for the Medicine and Condition nodes, respectively. Figure 7 shows a graph around the Alzheimer's Disease node.
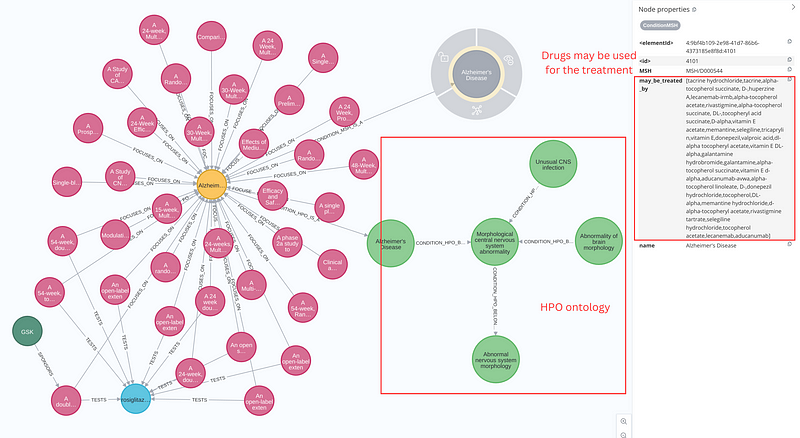
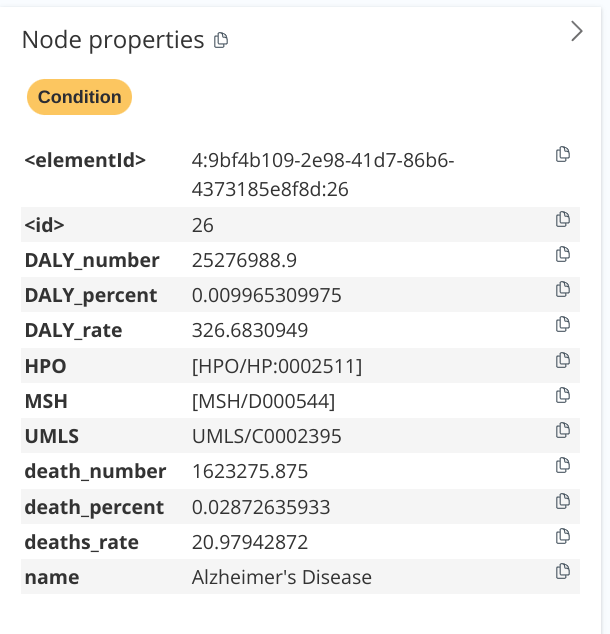
Alzheimer's Disease node. It shows that there are more 30 trials focusing on the condition. Right panel: the GBD statistics about the Alzheimer's Disease. Image by author.Figure 7 (left panel) depicts over 30 clinical trials in various stages of development, all aiming to address Alzheimer’s Disease, which is represented by a yellow node. The mortality values and DALYs are all stored as node properties (Figure 7 right panel). The GBD statistics show that Alzheimer’s Disease claimed the lives of 20.9 per 100,000 people in 2019, and its burden exceeded 326 years of healthy life lost per 100,000 (DALYs). Also on the left panel, we can see that a trial (ID 495) sponsored by GSK was testing the drug rosiglitazone. Interestingly, the drug was approved by the FDA for the treatment of type 2 diabetes mellitus. On the one hand, the light green nodes show the HPO taxonomy of Alzheimer’s Disease. It “is a” Morphological central nervous system abnormality, which in turn “is a” Abnormal nervous system morphology. On the other hand, the gray node holds the may_be_treated_by property for the Alzheimer’s Disease. It listed a total of 33 drugs, including tacrine hydrochloride and tricaprylin.
We can now also query and aggregate the data for more insights. For example, the following Cypher query reveals the top 10 most tested medicines and their trial counts.
MATCH (m1:Medicine) <-[:TESTS]- (t1:Trial)
WITH m1, collect(DISTINCT t1) AS trials
RETURN m1.name, reduce(sum=0, x IN trials | sum+1) AS n_trials
ORDER BY n_trials DESC LIMIT 10
The following table summarizes the results.
We can see that the aforementioned rosiglitazone was in this top 10 list.
MATCH (m1:Medicine {name: "rosiglitazone"}) <-[:TESTS]- (t1:Trial) - [:FOCUSES_ON] -> (c:Condition)
RETURN c.name, COUNT(t1) AS trial_count ORDER BY trial_count DESCTo my surprise, a second query shows that this drug was being investigated for not just type 2 diabetes, but also Alzheimer’s, psoriasis, and other conditions. The so-called drug repurposing is one of the main use cases of the knowledge graph.
4. The dashboard reveals drug companies’ focus areas
Data in the knowledge graph can also be visually investigated in dashboards. You can read about the process in my previous article. In this project, I again used Google’s Looker Studio as my dashboard platform (Figures 8 and 9).
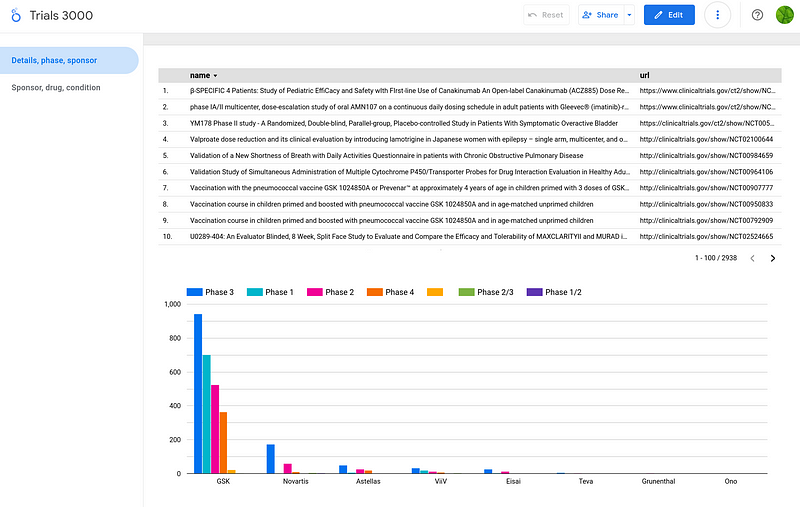
With a glance at the dashboard, we can grasp some essential statistics. Firstly, we can see that GSK was the largest sponsor in the dataset. Secondly, given the higher cost and complexity of later phases, combined with the low success rates in early phases, I expected a majority of trials to be in phases 1 and 2. However, my analysis revealed a surprising prevalence of phase 3 studies in the dataset. It indicates that the dataset might be focused on late-stage trials for specific reasons.
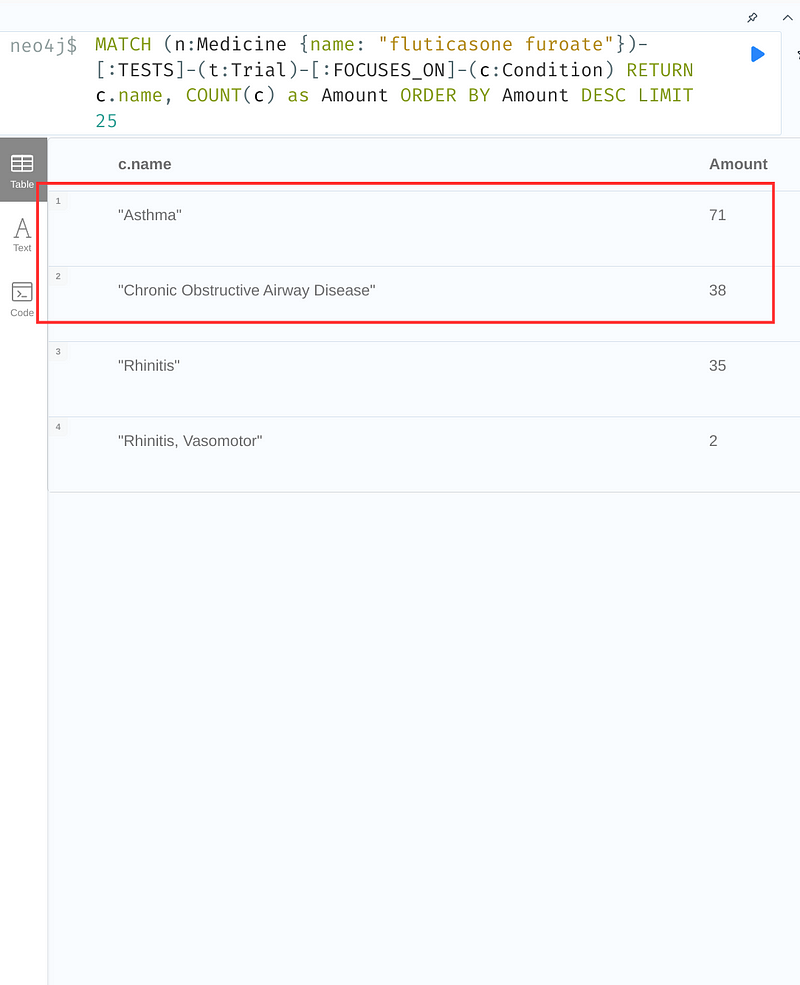
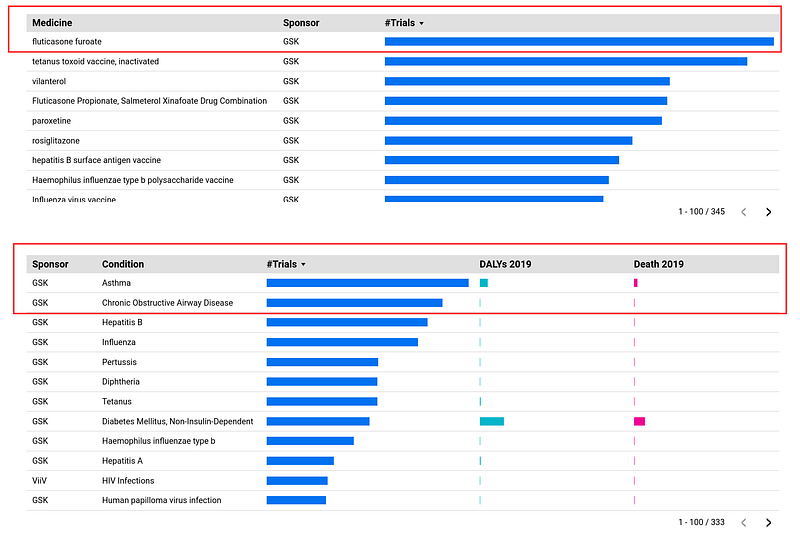
Fluticasone furoate stands out as the most studied drug (146 trials, Figure 9, right panel, first table). It was most often tested on asthma (71 trials, Figure 9, left panel, table) and chronic obstructive airway disease (38 trials, Figure 9, left panel, table). Interestingly, they were also the top two investigated conditions in the dataset with 255 and 222 trials respectively (Figure 9, right panel, second table). This analysis provides some insights into GSK’s research priorities.
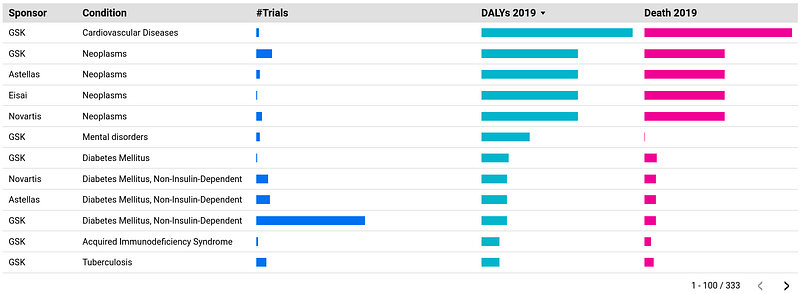
When ranked by Disability-Adjusted Life Years (DALYs) in 2019, the second table of Figure 9 was led by: cardiovascular diseases, cancers, mental disorders, and diabetes, referred to as the “four horsemen of chronic disease” by Peter Attia in his book Outlive. Despite leading to the greatest loss of health spans globally, they received significantly fewer trials than the low-DALYs conditions such as asthma, chronic obstructive airway disease, hepatitis, and influenza. There isn’t a simple explanation for this disparity. On the one hand, drug companies are driven by profit, and they tend to invest in research areas with a higher potential for commercially successful drugs. Complex diseases like the four horsemen can be more challenging and expensive to research, reducing their appeal for some companies. On the other hand, we have a better understanding of the underlying causes and mechanisms of asthma and influenza, making them easier targets for drug development. Others, like cancer and mental disorders, are still quite complex and less well-understood, posing a bigger challenge for researchers.
Conclusion
The drug approval process plays a crucial role in ensuring the safety and efficacy of medications available to the public. According to the FDA,
It not only prevents quackery, but also provides doctors and patients the information they need to use medicines wisely.
The TV drama Dopesick shows how a lax drug approval process can lead to public health catastrophes like the opioid crisis. So it is vital to make this process efficient and accurate. Both the FDA and drug companies find past trial data invaluable. Trials targeting similar conditions or drugs reveal trends in success rates, study designs, and costs. However, this wealth of information demands extensive data analysis. A knowledge graph with a dashboard can facilitate this process significantly. Researchers can get easily useful statistics in the dashboard and inspect the details in the graph network.
This project has collected data from three different sources. But they are by no means exhaustive. The graph can be enriched further with data from clinicaltrials.gov. For example, we can add trial protocols, criteria, and results as node properties and more relations such as locations and countries to the graph. Also, we can use BioCypher to encode the graph in the Biolink ontology (read my previous article here for more details).
Finally, it is also possible to perform graph machine learning on the knowledge graph. For example, we can estimate the costs based on historical trials. A website called drugdatabase.info collects data on the clinical trials. Unfortunately, relying solely on its 120 data points won’t suffice for a robust cost estimation. Supplementing this data with information from clinical trial registries, government databases, and academic publications will be the key.


