
Neo4j for Diseases
Analyzing the KEGG Disease Data with a Graph Database
This article shows how to:
1. Use Neo4j to get quick overviews over the KEGG Disease database.
2. Identify multipurpose drugs.
3. Show details about some pathogens such as SARS-CoV-2.
4. Form disease communities with Louvain and discover the most connected diseases with PageRank. SARS and COVID-19 are isolated “islands” separated from other large disease clusters.
Disclaimer: This article does not provide medical advice. It is intended for informational purposes only. It is not a substitute for professional medical advice, diagnosis or treatment.
COVID-19 has the world by the short hairs. This contagious disease has taken a heavy toll on our lives. It disrupts many families, causes enormous economic losses and perhaps forever changes our behavior. As a result, it raises our awareness of the public health issue. It becomes immediately clear that we the human race need to invest more in the medical research to avert the next calamity.
Since my last story “Analyzing Genomes in a Graph Database”, I have noticed that there are still many treasures in the Kyoto Encyclopedia of Genes and Genomes (KEGG) database. One of them is without doubt the KEGG Disease Database. This database contains details about many known human diseases. Moreover, together with other databases such as Genome, Drug and Genes, KEGG provides us with a very extensive network of knowledge about disorders, their causes and drugs. As I mentioned in my article, a graph database like Neo4j is instrumental to knowledge discovery in biomedical research. This trove of information from KEGG is perfect for such a data project. Therefore, I have downloaded and processed the data from the KEGG Disease Database via API, imported them into Neo4j, run several analyses and have discovered some interesting information.
In this article, I am going to focus on the relations among diseases, pathogens and drugs. The code for this project is hosted on my Github repository:
1. Import the data into Neo4j
All the CSV files are located in the data folder. If you want to update the information, you can follow the instruction in my repo README.md.
Download Neo4j Desktop from their official website. Once installed, add a new “Local DMBS” and name it “kegg_disease”. Open its Import folder by clicking through “…” -> “Open folder” -> “Import”. Put all the CSV files inside the folder. Afterwards, run the following commands and they will import all the information:
2. Get overviews
Once the data are imported, we can have some basic statistics over the KEGG Disease database. These three commands get the total counts of all three types of nodes:
So there are 333 kinds of pathogens, 1,339 drugs and 2,498 diseases recorded in the database. That is a sizeable dataset. We can also have a look at the topology of the data with Neo4j Bloom. Enter the following Cypher query in a search phrase and execute it (my previous article showed the detailed steps):
MATCH p=(n:disease) <-[]-() RETURN p;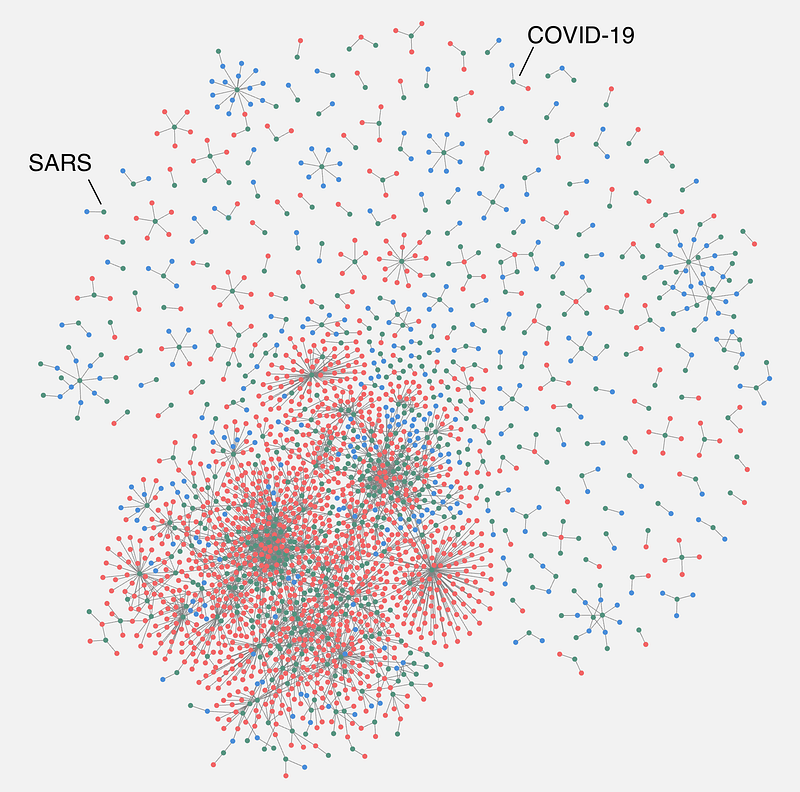
Run the following command to get the top ten disease categories in the dataset. Be cautious though that some diseases such as Schwartz-Jampel syndrome and centronuclear myopathy are put into two categories and the query will not double-count them separately.:
And you will be greeted with this result:
To my surprise, under this query, the top spot was taken neither by infectious disease nor by the two notorious killers — cardiovascular disease and cancer. It was congenital malformation, including Nail-patella syndrome and Meckel syndrome.
Infectious diseases can be caused by viruses, bacteria or eukaryota. The following command will show the numbers of each in the database:
And the results are:
Again, to my surprise, bacteria, not the viruses, are the most frequent pathogens in the data. We can look further inside the viruses by issuing:
This query combines both the first and second levels of the taxonomy and tallies them.
As you can see, Riboviria is the most abundant viral realm. But Riboviria is also a very diverse taxonomic group. Both SARS-CoV-2 and its predecessor SARS coronavirus, the causal agents for the 2002–2004 SARS outbreak, belong to Riboviria. But so do human immunodeficiency viruses (HIV) and hepatitis viruses.
Finally, we can get the number of drugs against infectious diseases by issuing:
The query returns 293 kinds of drugs. It is noteworthy that the “DISTINCT” keyword is necessary here, because some drugs can be administered to treat multiple diseases and they would have been double-counted without the “DISTINCT”.
3. Search for multipurpose drugs
Multipurpose drugs are medications that can be used to treat more than one diseases. In other words, they are versatile. Because medications are expensive to develop and require vigorous clinical trials, so if an “old drug can do new tricks” (watch NIH’s director Francis Collins’ enlightening TED talk here), it is without doubt great news for both the patients and the pharmaceutical companies. In practice, medications are carefully regulated by authorities such as the FDA in USA and manufacturers can only market them for indications approved by the FDA. So it will be very interesting to find out what are the most versatile drugs in the data and what indications that they have.
Issue the following command to see the top ten most versatile medicines:
And the results are:
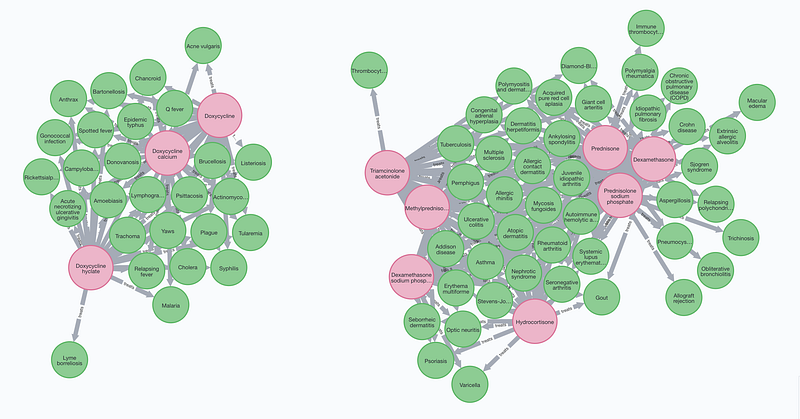
The top ten list basically consists of two classes of drugs: steroid hormones and tetracycline antibiotic doxycycline. Steroid hormones are used to suppress the immune system and treat a variety of inflammatory conditions. The third in the list, Dexamethasone, has been studied under COVID-19 patients and the preliminary results showed that it reduced mortality rate among those who were receiving either invasive mechanical ventilation or oxygen alone but not among those receiving no respiratory support (The RECOVERY Collaborative Group, 2020). Doxycycline is a broad-spectrum antibiotic and used in the treatment of infectious diseases such as malaria, Lyme disease, cholera and syphilis. In fact, the following query shows that the indications for these steroid hormones greatly overlap each other, while doxycycline and its derivatives also target many of the same diseases.
For example, the top two drugs in the list: prednisone and its active form prednisolone, have been approved for medical use in the United States since 1955. And they are popular: prednisone is the 21th and prednisolone is the 134th most prescribed medication in USA in 2021 so far according to DrugStats Database. Issue these two commands one by one to see the details of prednisolone sodium phosphate:
And the query returns
And:
As it turned out, prednisolone is not only used to treat immune system disease, but also infectious diseases such as trichinosis and tuberculosis. It is also used in chronic obstructive pulmonary disease (COPD) for its anti-inflammatory effects. Its use in idiopathic pulmonary fibrosis (IPF) is however less certain.
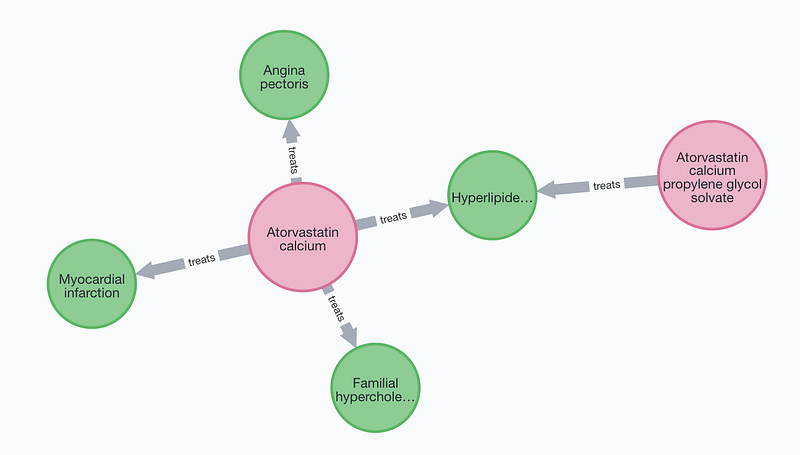
As to the most prescribed drug in 2021 so far in USA — Atorvastatin and its derivatives, their uses are limited to four metabolic or cardiovascular diseases: hyperlipidemia, familial hypercholesterolemia, Angina pectoris and myocardial infarction.
4. Details about some pathogens
Now it is time to explore the pathogen data. First, we can count how many different diseases that a pathogen can cause.
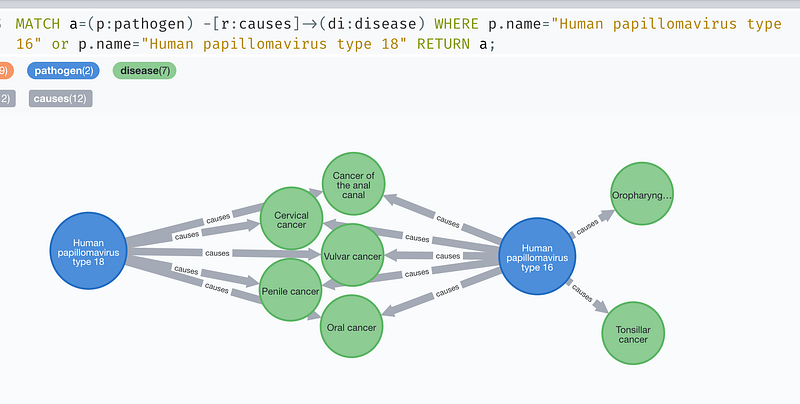
All the top ten are viruses. The top two are papillomaviruses that can lead to different kinds of cancer in human. According to Wikipedia, most papillomavirus infections are asymptomatic and 90% of the cases go away within two years. But in other cases, they persist and results in either warts or lesions. These lesions increase the risk of cancer along the various tracts in the human body such as cervix, vulva, vagina, penis, anus, mouth, tonsils, or throat (Figure 5.). Nearly all cervical cancer is caused by HPV; And these top two strains account for 70% of cases. HPV16 alone is responsible for almost 90% of HPV-positive oropharyngeal cancers.
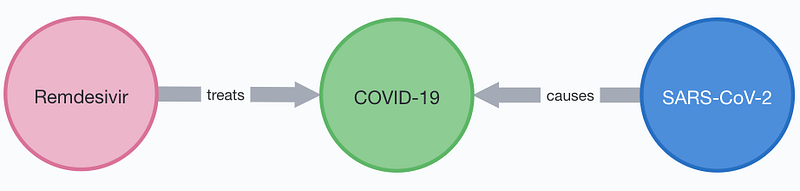
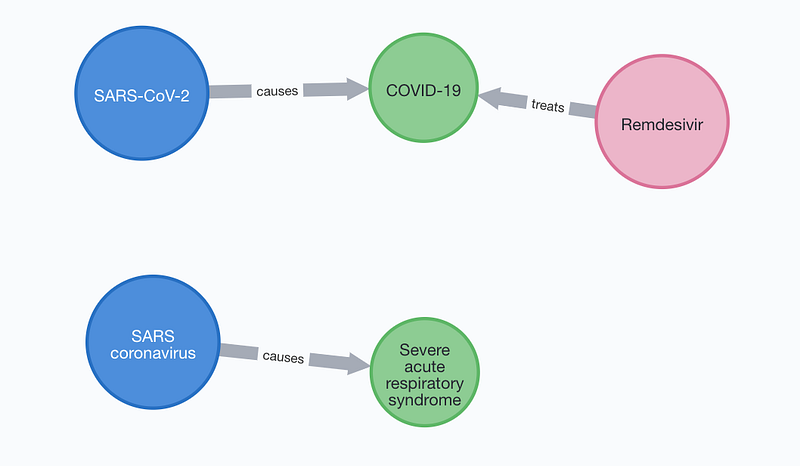
In contrast, both SARS and SARS-CoV-2 are connected to one disease each. SARS caused the 2002–2004 SARS pandemic in China and so far there is no antiviral therapy for it. For COVID-19, KEGG lists the drug remdesivir. Siemieniuk et al. conducted a living systematic review (read it here) and stated that remdesivir may shorten the COVID symptoms.
The antimalarial drug Hydroxychloroquine sulfate is NOT considered as a treatment to COVID-19 in KEGG.
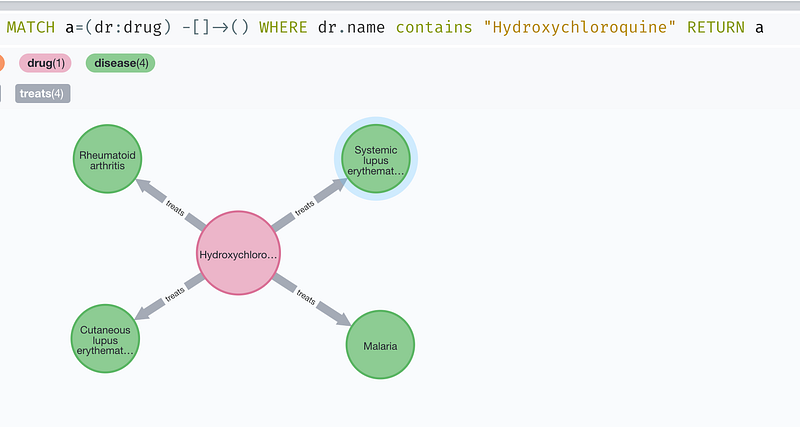
It echoes one of the conclusions in Siemieniuk’s study:
Hydroxychloroquine may not reduce mortality or mechanical ventilation, and it seems unlikely to have any other benefits (for COVID-19).
5. Discover communities and highly connected nodes with graph algorithms
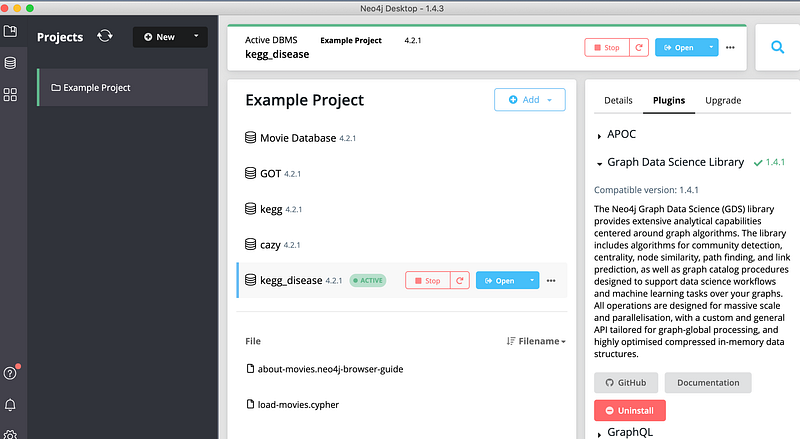
The topology in Figure 2. has some intriguing features. Many small networks surround a large cluster of interconnected dots. It will be interesting to determine those clusters and identify some of the most connected nodes, the so-called hubs. Fortunately, Neo4j provides us with a very powerful plugin: Graph Data Science (gds) to handle these sorts of tasks.
First go to the project detail tab in Neo4j Desktop and install the plugin:
In Neo4j, graph algorithms run on graph projections. To begin, we put all our nodes and edges into a named graph projection called “disease-graph” with Cypher.
5.1 Form disease communities with Louvain algorithm
Now we can run the Louvain algorithm onto it to identify clusters or communities. This algorithm condenses close connected nodes into larger nodes and repeats until no condensation is possible. First, we ask how many communities can be formed:
Out of 4,170 nodes, the Louvian algorithm could create 2,120 communities. I ran this query with different parameters such “maxIterations” and “tolerance” but could not see any big differences.
We can check the largest communities and see their members:
It returns:
Now we can check the members in community “3421” with:
And the members are:
After going through the list it is clear that this community contains mainly tumor-related items. Pathogens such as Hepatitis B and D viruses that are known to increase cancer risk are also in this community.
You can analyze the communities further. My own community analyses show that diseases in large clusters are those that have received the most research attention and they are well connected either through common pathogens or versatile drugs. In contrast, many isolated “islands” are rare diseases such as Christianson syndrome or Zimmermann-Laband syndrome. It is noteworthy that SARS and COVID-19 are two isolated “islands” (Figure 2.) even though they caused sensational pandemics. The message is also clear: we still know very little about COVID-19 relatively.
5.2 Discover the most connected nodes with PageRank
Finally, we can use PageRank to check which nodes in the graph are well-connected:
And the top results are:
No drug or pathogen nodes made it into the top twelve most important list, all are diseases. This can be explained on the one hand that every pathogen and drug is guaranteed to be connected to a disease node in our data model. So disease nodes are by default quite central from the start. On the other hand, this top list consists of some of the most common human sufferings in the modern world and a lot of drugs have been developed to tackled them. In fact, with a more complex query we can count the drugs associated with these top disorders:
As the results show, 103 drugs are indicated for the treatment of high blood pressure, the top node in the list. Psoriasis, as the last one on this list, affects 2–4% of the western population but it is treated with 34 drugs in the database. However, the drug amount ranking did not follow exactly the PageRank. For example, there were 48 drugs for rheumatoid arthritis, that is more than those of the higher ranked diseases such as breast cancer, major depressive disorder and schiziphrenia.
Conclusions
This project is another example that demonstrates the power of Neo4j in biomedical research. Once the data is imported into Neo4j, we can gain lots of quick numbers and details about diseases at our fingertips. If done in a relational database, we would have needed three tables to model the data, instead of just one schema in Neo4j. In addition, the Cypher queries are straightforward to formulate and for readers to understand without any “JOIN”. Finally, in a graph database we can run graph algorithms onto the data and discover some interesting new insights with ease.
That is not to say that we should abandon other databases. Graph database is a good choice when our data contains lots of connections, such as our previous project and the KEGG Disease project here. In the case of simple tallies, such as price tables, we should use a relational database. For documents, we should consider document databases such as MongoDB. Time series also has its own kind of databases such as Amazon Timestream or InfluxDB.
This project also taught us valuable lessons about diseases and health. One of them is about our immune system. During the current COVID-19 pandemic, we are more likely to buy into one of those many “boost your immune system” commercials. But our immune system is very delicate and we by no means want to see it go into overdrive. On the contrary, the analysis above showed that some of the most versatile and widely used drugs are actually immunosuppressants, drugs that suppress the immune system. And Johns Hopkins University estimated that 3% of the American population suffer from autoimmune diseases, that is around ten million people! It reminds me of a paragraph in An Elegant Defense by Matt Richtel, when hearing ads promising to boost the immune system, Dr Anthony Fauci said
“It almost makes me chuckle. First of all, it is assuming your immune system needs boosting, which it very likely doesn’t. If you do successfully boost your immune system, you might boost it to do something bad.”
This project only covers a small part of the KEGG: disease, drug and pathogen. I can only wonder what kind of new insights we can gain if we utilize all the information stored in KEGG. Therefore, I encourage you to use graph database to further explore this data treasure trove and show me the things you discover along the way.
This article has been translated into Chinese by myself: https://blog.csdn.net/dgg32/article/details/119081851


