
Day 53: 60 days of Data Science and Machine Learning Series
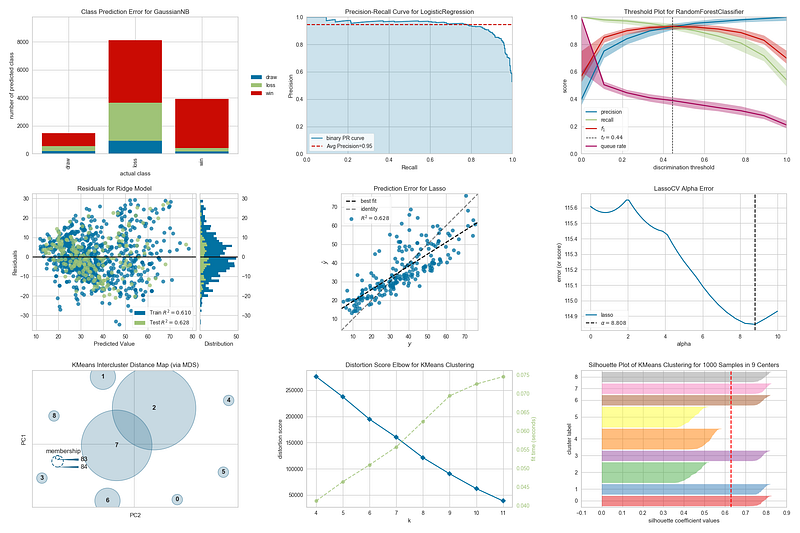
Yellowbrick combines scikit-learn with matplotlib and provides the scikit-learn API to produce visualizations for the machine learning workflow. A good reference point to understand the vastness of Yellowbrick and how to use it —
Some of the other best Series —
100 days : Your Data Science and Machine Learning Degree Series with projects
Complete Data Visualization and Pre-processing Series with projects
Projects Videos —
All the projects, data structures, SQL, algorithms, system design, Data Science and ML , Data Analytics, Data Engineering, , Implemented Data Science and ML projects, Implemented Data Engineering Projects, Implemented Deep Learning Projects, Implemented Machine Learning Ops Projects, Implemented Time Series Analysis and Forecasting Projects, Implemented Applied Machine Learning Projects, Implemented Tensorflow and Keras Projects, Implemented PyTorch Projects, Implemented Scikit Learn Projects, Implemented Big Data Projects, Implemented Cloud Machine Learning Projects, Implemented Neural Networks Projects, Implemented OpenCV Projects,Complete ML Research Papers Summarized, Implemented Data Analytics projects, Implemented Data Visualization Projects, Implemented Data Mining Projects, Implemented Natural Leaning Processing Projects, MLOps and Deep Learning, Applied Machine Learning with Projects Series, PyTorch with Projects Series, Tensorflow and Keras with Projects Series, Scikit Learn Series with Projects, Time Series Analysis and Forecasting with Projects Series, ML System Design Case Studies Series videos will be published on our youtube channel ( just launched).
Subscribe today!
Tech Newsletter —
If you are interested, you can join my newsletter through which I send tech interview tips, techniques, patterns, hacks — Software Development, ML, Data Science, Startups and Technology projects to more than 30K readers. You can subscribe to Tech Brew :
You can install yellowbrick using the command below —
$ pip install yellowbrickIn this post, we will build, evaluate a logistic regression classifier and perform visualizations using Yellowbricks data visualization tools/modules.
Let’s dive in!
Import necessary libraries
import matplotlib.pyplot as plt
%matplotlib inline
import pandas as pd
import warnings
warnings.simplefilter('ignore')
import numpy as np
import yellowbrick as yb
from sklearn.model_selection import train_test_split
from yellowbrick.classifier import ROCAUC
from sklearn.linear_model import LogisticRegression
from yellowbrick.classifier import ClassificationReport
from yellowbrick.classifier import ConfusionMatrix
from sklearn.model_selection import StratifiedKFold
from yellowbrick.model_selection import CVScores
from yellowbrick.classifier import ClassBalance
from yellowbrick.classifier import DiscriminationThreshold
Load the data
# Load the classification data set
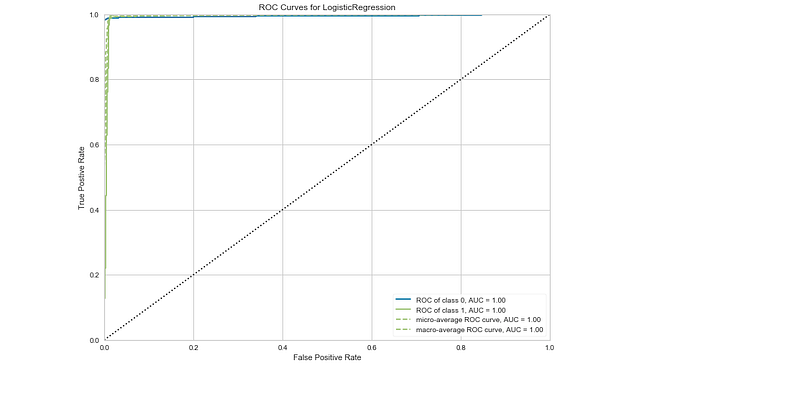
data = pd.read_csv('Path to the file /data.csv')ROC/AUC Plots
X_train, X_test,y_train,y_test = train_test_split(X,y,test_size=0.2)
v = ROCAUC(LogisticRegression(),size=(800,600))v.fit(X_train,y_train)
v.score(X_test,y_test)
g= v.poof()Output —
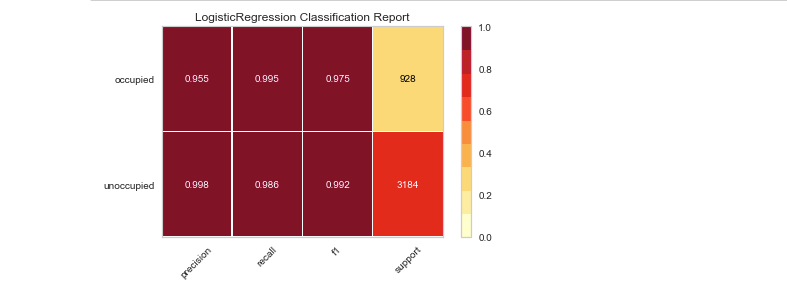
Classification Report and Confusion Matrix
v = ClassificationReport(LogisticRegression(),classes=classes,support=True)
v.fit(X_train,y_train)
v.score(X_test,y_test)
g=v.poof()
Output —
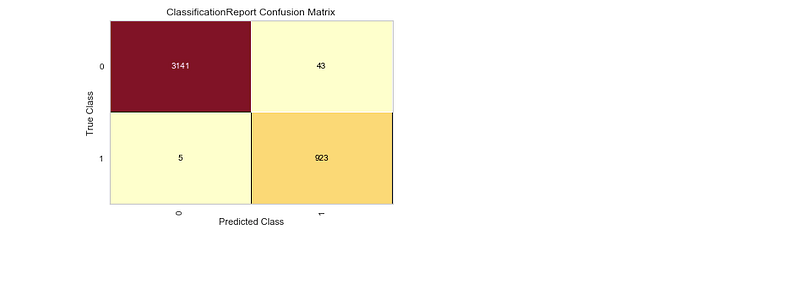
c = ConfusionMatrix(v,classes=[0,1])
c.score(X_test,y_test)
c.poof()
Output —
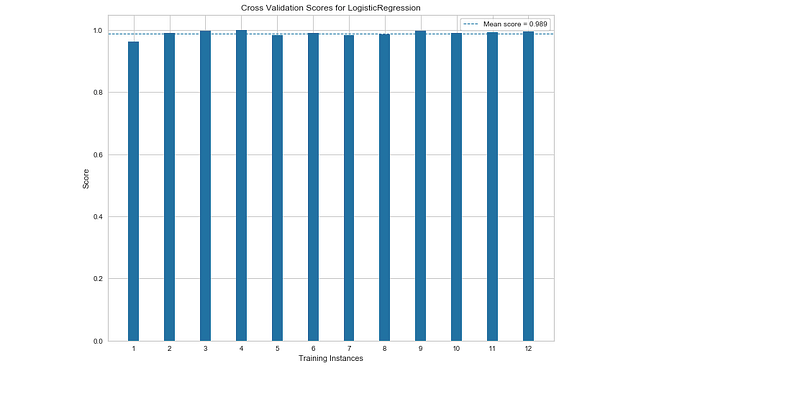
Cross-validation Scores
_,ax = plt.subplots()
cv = StratifiedKFold(12)
v = CVScores(LogisticRegression(),ax=ax,cv=cv,scoring='f1_weighted',size=(800,600))
v.fit(X,y)
v.poof()
Output —
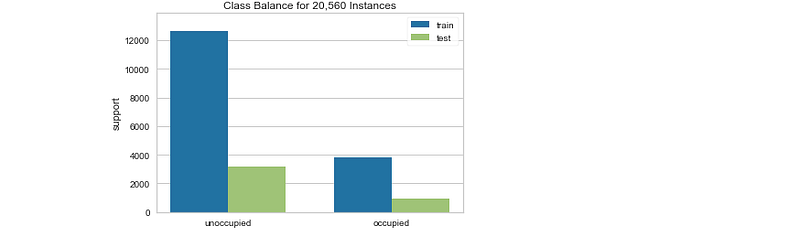
Evaluating Class Balance
v = ClassBalance(labels=classes)
v.fit(y_train,y_test)
v.poof()
Output —
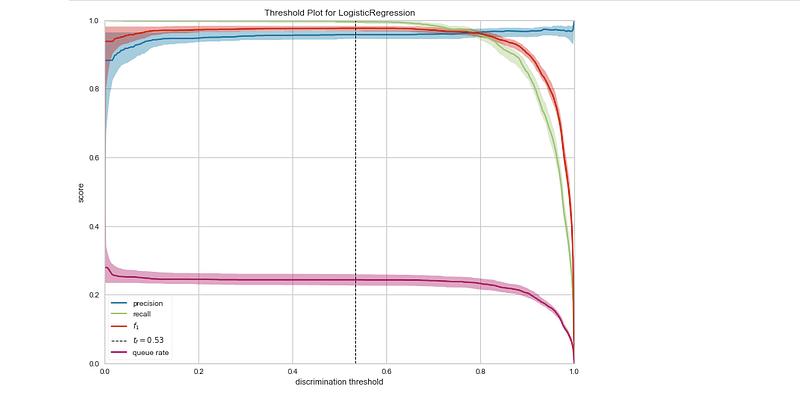
Discrimination Threshold
v = DiscriminationThreshold(LogisticRegression(),size=(800,600))
v.fit(X_train,y_train)
v.poof()
Output —
Learnings —
How to build, evaluate a logistic regression classifier and perform visualizations using yellowbricks data visualization tools/modules.
Day 54: Coming soon!
Follow and Stay tuned. Keep coding :)
For other projects, tune to —
Build Machine Learning Pipelines( With Code)
Recurrent Neural Network with Keras
Clustering Geolocation Data in Python using DBSCAN and K-Means
Facial Expression Recognition using Keras
Hyperparameter Tuning with Keras Tuner
Custom Layers in Keras
That’s it fellas. Peace out and keep coding :)
Stay Tuned and of-course let me end this post with a quote by Steve Jobs ;)
“You have to be burning with an idea, or a problem, or a wrong that you want to right. If you’re not passionate enough from the start, you’ll never stick it out.”


