
Day 43: 60 days of Data Science and Machine Learning Series
Regression using Tensorflow with a project..
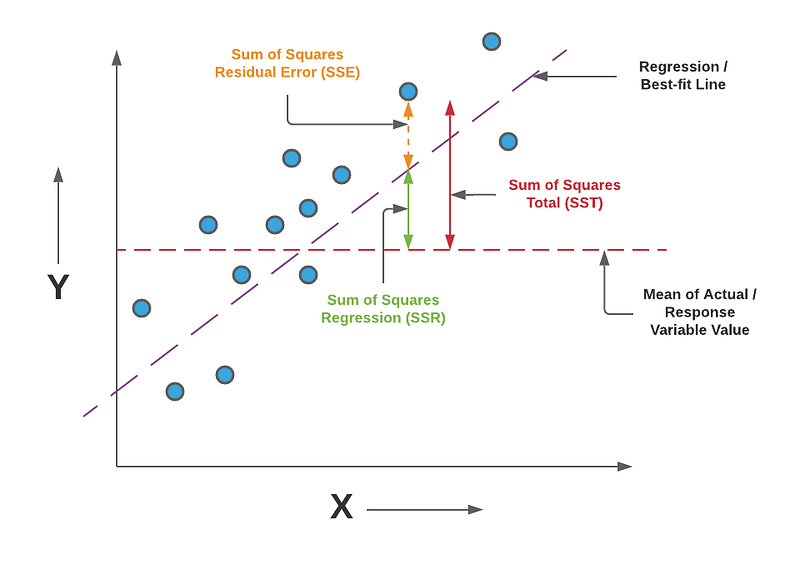
Simple Linear Regression
It’s a technique to estimate the relationship between two quantitative variables. It is used when you want to establish:
- Strength of the relationship — How strong the relationship is between two variables
- The value of the dependent variable at a certain value of the independent variable.
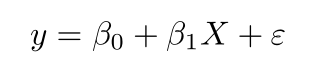
where,
y is the predicted value of the dependent variable for any given value of the independent variable which is X.
B0 is the intercept and B1 is the regression coefficient
x is the independent variable
e is the error of the estimate
Some of the other best Series —
100 days : Your Data Science and Machine Learning Degree Series with projects
Complete Data Visualization and Pre-processing Series with projects
Projects Videos —
All the projects, data structures, SQL, algorithms, system design, Data Science and ML , Data Analytics, Data Engineering, , Implemented Data Science and ML projects, Implemented Data Engineering Projects, Implemented Deep Learning Projects, Implemented Machine Learning Ops Projects, Implemented Time Series Analysis and Forecasting Projects, Implemented Applied Machine Learning Projects, Implemented Tensorflow and Keras Projects, Implemented PyTorch Projects, Implemented Scikit Learn Projects, Implemented Big Data Projects, Implemented Cloud Machine Learning Projects, Implemented Neural Networks Projects, Implemented OpenCV Projects,Complete ML Research Papers Summarized, Implemented Data Analytics projects, Implemented Data Visualization Projects, Implemented Data Mining Projects, Implemented Natural Leaning Processing Projects, MLOps and Deep Learning, Applied Machine Learning with Projects Series, PyTorch with Projects Series, Tensorflow and Keras with Projects Series, Scikit Learn Series with Projects, Time Series Analysis and Forecasting with Projects Series, ML System Design Case Studies Series videos will be published on our youtube channel ( just launched).
Subscribe today!
Tech Newsletter —
If you are interested, you can join my newsletter through which I send tech interview tips, techniques, patterns, hacks — Software Development, ML, Data Science, Startups and Technology projects to more than 30K readers. You can subscribe to Tech Brew :
Tensorflow is an open source platform for machine learning and deep learning developed by Google Brain Team and written in C++, Python, and CUDA created for large numerical computations and deep learning. It ingests the data in the form of tensors which are nothing but multi-dimensional arrays of higher dimensions to handle large amounts of data. It works on the data flow graphs that have nodes and edges and supports both CPUs and GPUs. It works by preprocessing the data, building the model, training and estimating the model.
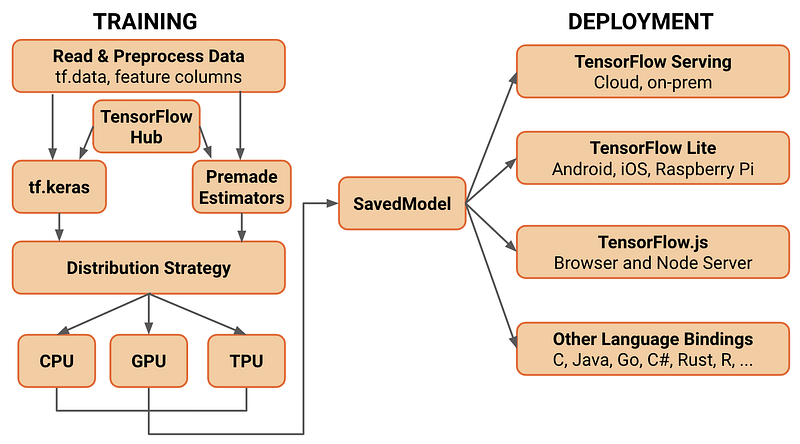
A good reference to Tensorflow ( used in this project as well ) —
In this project we are going to learn how to predict House Prices with Regression using TensorFlow. The data for this project can be found (at below link)—
Let’s dive in!
Import necessary libraries
import pandas as pd
import matplotlib.pyplot as plt
import tensorflow as tf
from utils import *
from sklearn.model_selection import train_test_split
from tensorflow.keras.models import Sequential
from tensorflow.keras.layers import Dense, Dropout
from tensorflow.keras.callbacks import EarlyStopping, LambdaCallback%matplotlib inline
tf.logging.set_verbosity(tf.logging.ERROR)Load the data
df = pd.read_csv('Path to file/data.csv',names =column_names)# check missing data
df.isna().sum()Output —
serial       0
date         0
age          0
distance     0
stores       0
latitude     0
longitude    0
price        0
dtype: int64
Normaliza Data and convert label value
df = df.iloc[:,1:]
dn = (df-df.mean())/df.std()
y_mean = df['price'].mean()
y_std = df['price'].std()
def cl(pred):
return int(pred * y_std + y_mean)Select Features and Train and Test split
x = dn.iloc[:,:6]
y = dn.iloc[:,-1]
x_arr = x.values
y_arr = y.values
x_train,x_test,y_train,y_test = train_test_split(x_arr,y_arr,test_size =0.05,random_state=0)
Create the model
def gm():
    model = Sequential([
        Dense(10,input_shape = (6,),activation='relu'),
        Dense(20,activation = 'relu'),
        Dense(5,activation='relu'),
        Dense(1)

    ])
    model.compile(
        loss ='mse',
        optimizer ='adam'

    )
    return model
gm().summary()
Output —
_________________________________________________________________
Layer (type)                 Output Shape              Param #
=================================================================
dense (Dense)                (None, 10)                70
_________________________________________________________________
dense_1 (Dense)              (None, 20)                220
_________________________________________________________________
dense_2 (Dense)              (None, 5)                 105
_________________________________________________________________
dense_3 (Dense)              (None, 1)                 6
=================================================================
Total params: 401
Trainable params: 401
Non-trainable params: 0
_________________________________________________________________
Model Training
We use an EarlyStopping callback from Keras to stop the model training if the validation loss stops decreasing for a few epochs.
A good reference for Earlystopping —
es = EarlyStopping(monitor = 'val_loss', patience =5)model =gm()
pu = model.predict(x_test)h = model.fit(
x_train, y_train,
validation_data =(x_test,y_test),
epochs=100,
callbacks = [es])
Output —
Train on 4750 samples, validate on 250 samples
Epoch 1/100
4750/4750 [==============================] - 3s 563us/sample - loss: 0.6501 - val_loss: 0.2627
Epoch 2/100
4750/4750 [==============================] - 0s 66us/sample - loss: 0.2749 - val_loss: 0.1848
Epoch 3/100
4750/4750 [==============================] - 0s 41us/sample - loss: 0.2094 - val_loss: 0.1596
Epoch 4/100
4750/4750 [==============================] - 0s 40us/sample - loss: 0.1871 - val_loss: 0.1564
Epoch 5/100
4750/4750 [==============================] - 0s 40us/sample - loss: 0.1766 - val_loss: 0.1483
Epoch 6/100
4750/4750 [==============================] - 0s 41us/sample - loss: 0.1704 - val_loss: 0.1471
Epoch 7/100
4750/4750 [==============================] - 0s 44us/sample - loss: 0.1662 - val_loss: 0.1511
Epoch 8/100
4750/4750 [==============================] - 0s 41us/sample - loss: 0.1631 - val_loss: 0.1491
Epoch 9/100
4750/4750 [==============================] - 0s 38us/sample - loss: 0.1610 - val_loss: 0.1489
Epoch 10/100
4750/4750 [==============================] - 0s 38us/sample - loss: 0.1590 - val_loss: 0.1471
Epoch 11/100
4750/4750 [==============================] - 0s 37us/sample - loss: 0.1580 - val_loss: 0.1498
Plot Loss
plot_loss(h)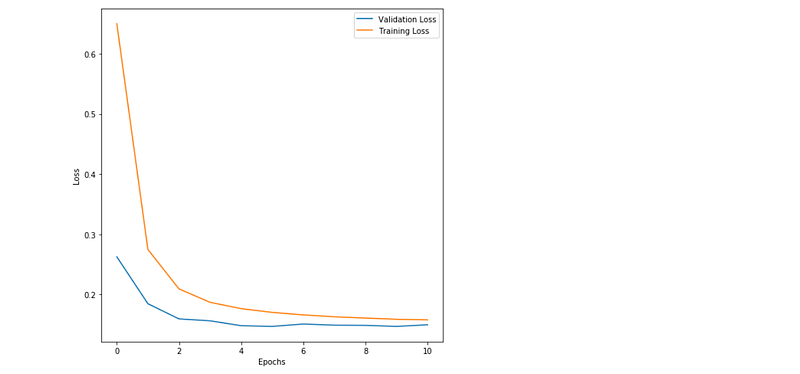
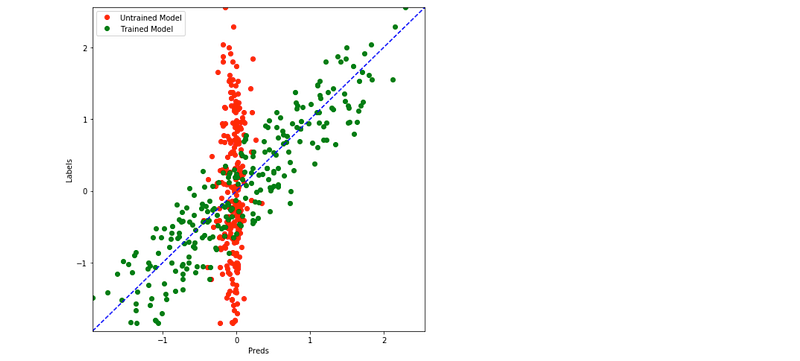
Visualize predictions
pt = model.predict(x_test)
compare_predictions(pu,pt,y_test)
Output —
Learnings —
How to create, train, and evaluate a neural network in TensorFlow.
Day 44: Coming soon!
Follow and Stay tuned. Keep coding :)
For other projects, tune to —
Build Machine Learning Pipelines( With Code)
Recurrent Neural Network with Keras
Clustering Geolocation Data in Python using DBSCAN and K-Means
Facial Expression Recognition using Keras
Hyperparameter Tuning with Keras Tuner
Custom Layers in Keras
That’s it fellas. Peace out and keep coding :)
Stay Tuned and of-course let me end this post with a quote by Steve Jobs ;)
“Your work is going to fill a large part of your life, and the only way to be truly satisfied is to do what you believe is great work. And the only way to do great work is to love what you do. If you haven’t found it yet, keep looking. Don’t settle. As with all matters of the heart, you’ll know when you find it.”


