
Day 20–60 days of Data Science and Machine Learning
Project Implementation : Crypto Analysis

Crypto is HOT ( I’m personally neck deep in Crypto game as my investment portfolio ;)). This post covers part 1 of detailed Crypto Analysis to build a basic intuition and part 2 covers how we can build a model to predict the prices.
Some of the other best Series —
100 days : Your Data Science and Machine Learning Degree Series with projects
Complete Data Visualization and Pre-processing Series with projects
Projects Videos —
All the projects, data structures, SQL, algorithms, system design, Data Science and ML , Data Analytics, Data Engineering, , Implemented Data Science and ML projects, Implemented Data Engineering Projects, Implemented Deep Learning Projects, Implemented Machine Learning Ops Projects, Implemented Time Series Analysis and Forecasting Projects, Implemented Applied Machine Learning Projects, Implemented Tensorflow and Keras Projects, Implemented PyTorch Projects, Implemented Scikit Learn Projects, Implemented Big Data Projects, Implemented Cloud Machine Learning Projects, Implemented Neural Networks Projects, Implemented OpenCV Projects,Complete ML Research Papers Summarized, Implemented Data Analytics projects, Implemented Data Visualization Projects, Implemented Data Mining Projects, Implemented Natural Leaning Processing Projects, MLOps and Deep Learning, Applied Machine Learning with Projects Series, PyTorch with Projects Series, Tensorflow and Keras with Projects Series, Scikit Learn Series with Projects, Time Series Analysis and Forecasting with Projects Series, ML System Design Case Studies Series videos will be published on our youtube channel ( just launched).
Subscribe today!
Tech Newsletter —
If you are interested, you can join my newsletter through which I send tech interview tips, techniques, patterns, hacks — Software Development, ML, Data Science, Startups and Technology projects to more than 30K readers. You can subscribe to Tech Brew :
The data for this project you can access here —
Let’s dive in —
Import necessary libraries —
import numpy as np # linear algebra
import pandas as pd # data processing
import seaborn as sns
cmap = sns.color_palette()
from matplotlib import pyplot as plt
import plotly.express as px
Load the Data
df_crypto = pd.read_csv('/path to file/asset_details.csv',low_memory = False)df_crypto.info()Output —
<class 'pandas.core.frame.DataFrame'>
RangeIndex: 14 entries, 0 to 13
Data columns (total 3 columns):
 #   Column      Non-Null Count  Dtype
---  ------      --------------  -----
 0   Asset_ID    14 non-null     int64
 1   Weight      14 non-null     float64
 2   Asset_Name  14 non-null     object
dtypes: float64(1), int64(1), object(1)
memory usage: 464.0+ bytes
# Crypto Weight Statsdf_crypto['Weight'].describe()Output —
count    14.000000
mean      2.919989
std       1.801957
min       1.098612
25%       1.655018
50%       2.238668
75%       4.116886
max       6.779922
Name: Weight, dtype: float64df_crypto.head()Output —
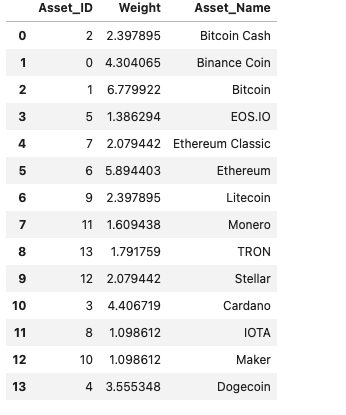
# Weighted percentage
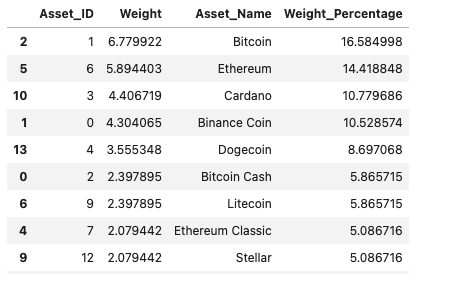
df_crypto['Weight_Percentage'] = (df_crypto['Weight']/df_crypto['Weight'].sum()) * 100
df_crypto.sort_values('Weight',ascending = False)
Output —
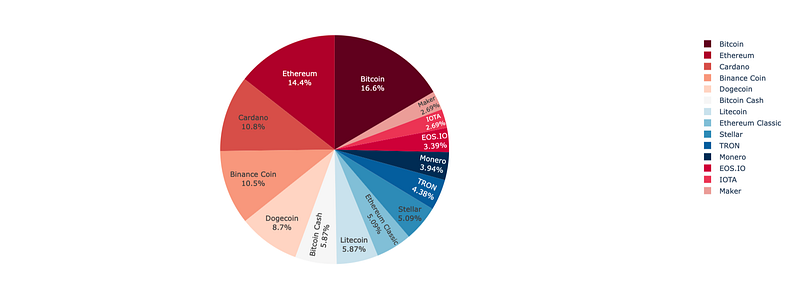
# Percentage of each cryptop=px.pie( df_crypto, values="Weight_Percentage", names = "Asset_Name",color_discrete_sequence=px.colors.sequential.RdBu )
p.update_traces(textposition='inside', textinfo='percent+label')
p.show()Output —
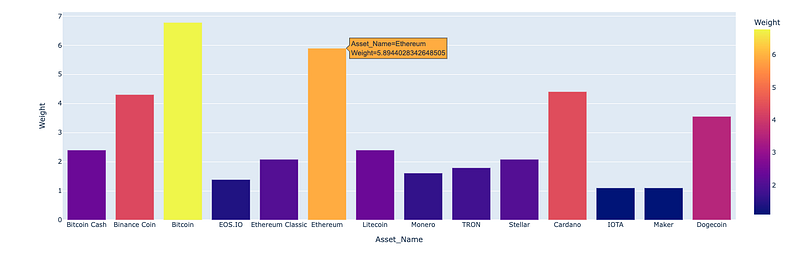
p_one= px.bar(df_crypto,x="Asset_Name",y="Weight",color='Weight')
p_one.show()
Output —
# Load the train data
train_df = pd.read_csv('/path to file/train.csv',low_memory= False)
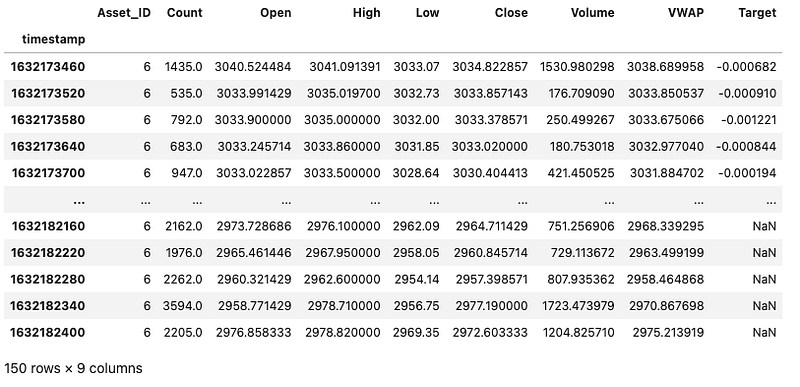
# Ethereum priceseth= train_df[train_df.Asset_ID==6].set_index('timestamp')
eth_batch = eth.iloc[-150:]
eth_batchOutput —
# Eth Missing Values
eth.isna().sum()
Output —
Asset_ID      0
Count         0
Open          0
High          0
Low           0
Close         0
Volume        0
VWAP          0
Target      340
dtype: int64
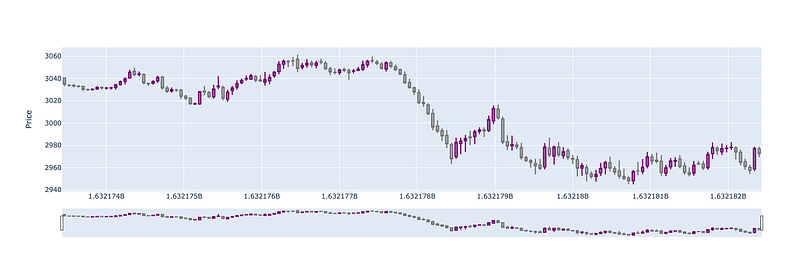
#Eth plotimport plotly.graph_objects as gof = go.Figure(data=[go.Candlestick(x=eth_batch.index, open=eth_batch['Open'], close=eth_batch['Close'],low=eth_batch['Low'],high=eth_batch['High'],increasing_line_color= 'purple',
decreasing_line_color= 'gray')])
f.update_layout(yaxis_title="Price")
f.show()Output —
# Bitcoin pricesbtc = train_df[train_df.Asset_ID==1].set_index('timestamp')
btc_batch = btc.iloc[-150:]#Missing Values
btc.isna().sum()Output —
Asset_ID      0
Count         0
Open          0
High          0
Low           0
Close         0
Volume        0
VWAP          0
Target      304
dtype: int64
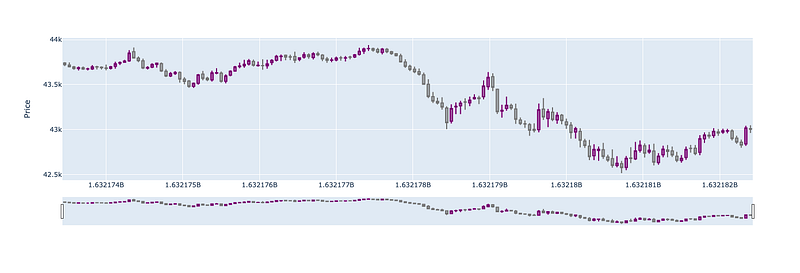
#Bitcoin Plotg= go.Figure(data=[go.Candlestick(x=btc_batch.index,open=btc_batch['Open'],close=btc_batch['Close'],high=btc_batch['High'],low=btc_batch['Low'],increasing_line_color= 'purple', decreasing_line_color= 'gray')])
g.update_layout(yaxis_title='Price')
g.show()Output —
#Cardano Prices
card = train_df[train_df.Asset_ID==3].set_index('timestamp')
card_batch = card.iloc[-150:]
#Missing Values
card.isna().sum()Output —
Asset_ID        0
Count           0
Open            0
High            0
Low             0
Close           0
Volume          0
VWAP            0
Target      18731
dtype: int64
#Cardano Plot
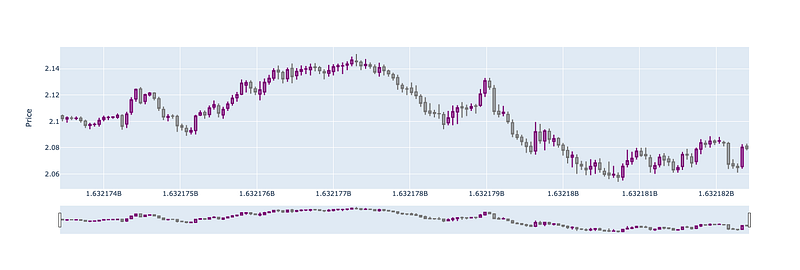
c = go.Figure(data=[go.Candlestick(x=card_batch.index,open=card_batch['Open'],close=card_batch['Close'],low=card_batch['Low'],high=card_batch['High'],increasing_line_color='purple',decreasing_line_color='gray')])
c.update_layout(yaxis_title='Price')
c.show()Output —
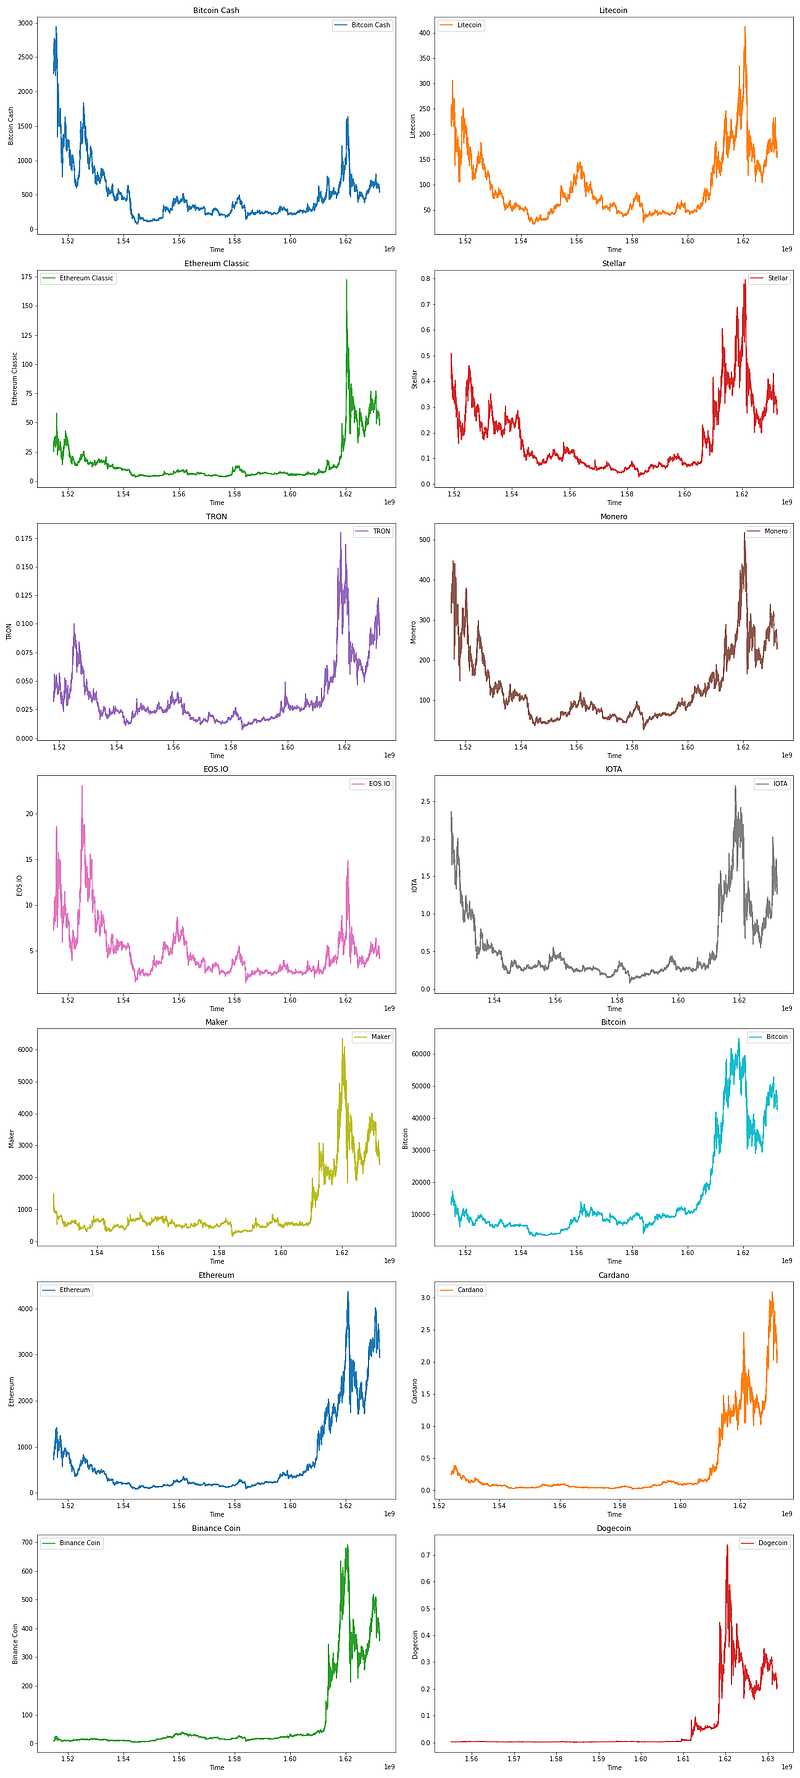
# Open prices for all the assetsdict1= {row['Asset_Name']:row['Asset_ID'] for i,row in df_crypto.iterrows()}asset_names = [ 'Bitcoin Cash',
'Litecoin',
'Ethereum Classic',
'Stellar',
'TRON',
'Monero',
'EOS.IO',
'IOTA',
'Maker',
'Bitcoin',
'Ethereum',
'Cardano',
'Binance Coin',
'Dogecoin'
]f2= plt.figure(figsize=(18,40))for i,asset in enumerate(asset_names):
c = train_df[train_df['Asset_ID']==dict1[asset]].set_index('timestamp')
c = c.reindex(range(c.index[0],c.index[-1]+60,60),method='pad')
ax = f2.add_subplot(7,2,i+1)
plt.plot(c['Open'],label=asset,color=cmap[i%10])
plt.legend()
plt.xlabel('Time')
plt.ylabel(asset)
plt.title(asset)
plt.tight_layout()
plt.show()Output —
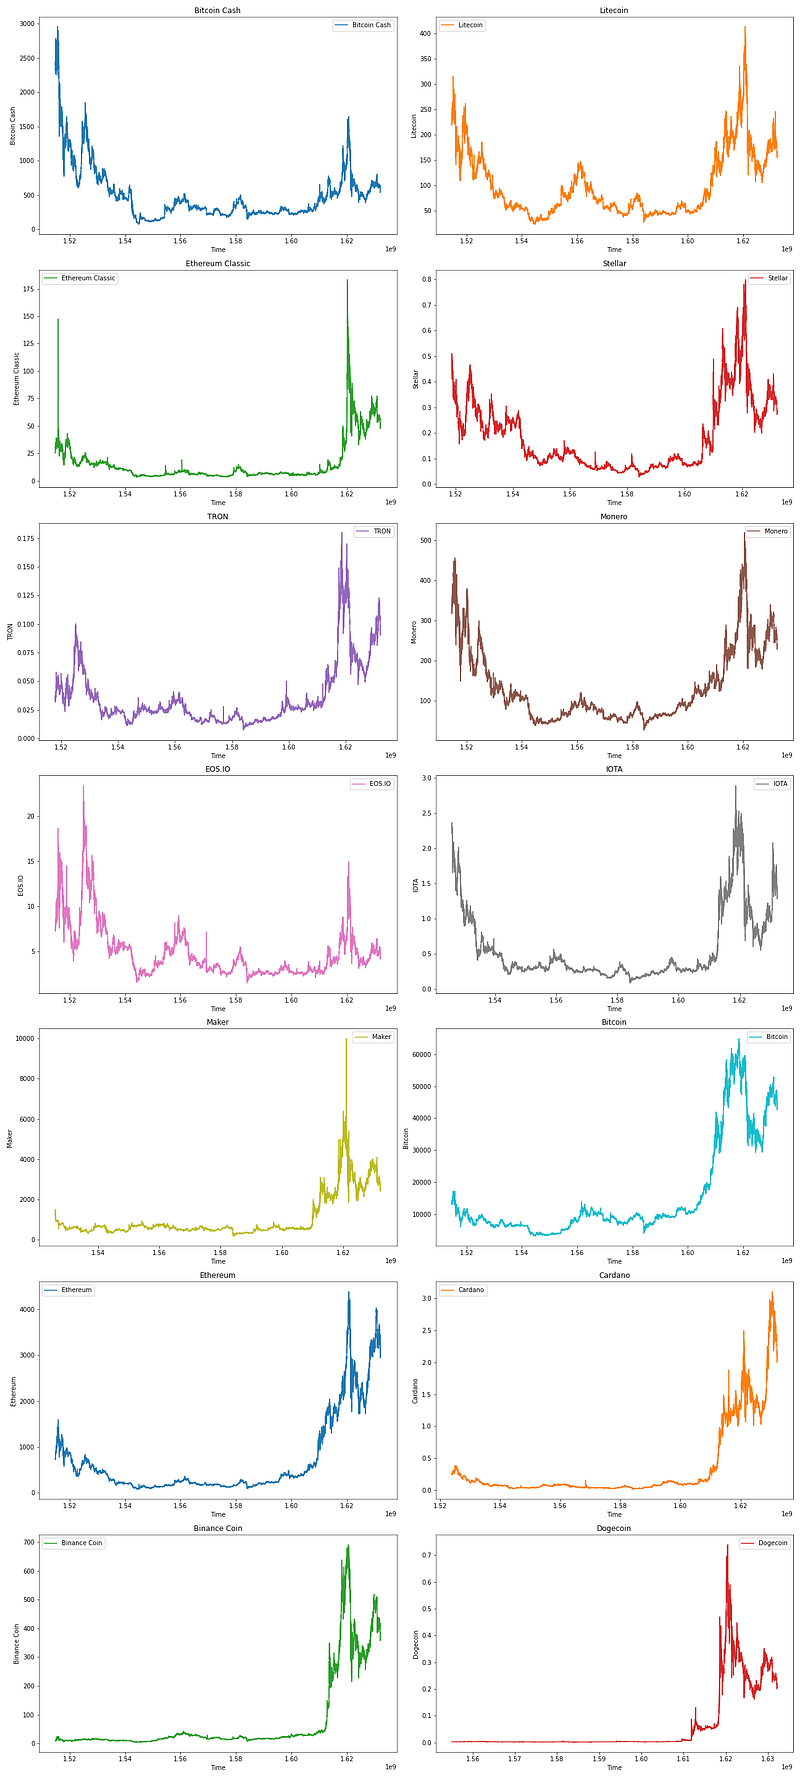
# High Prices of All the assetsf3= plt.figure(figsize=(18,40))for i,asset in enumerate(asset_names):
c = train_df[train_df['Asset_ID']==dict1[asset]].set_index('timestamp')
c = c.reindex(range(c.index[0],c.index[-1]+60,60),method='pad')
ax = f3.add_subplot(7,2,i+1)
plt.plot(c['Close'],label=asset,color=cmap[i%10])
plt.legend()
plt.xlabel('Time')
plt.ylabel(asset)
plt.title(asset)
plt.tight_layout()
plt.show()Output —
Part 2 of this project : Coming soon! Stay Tuned!
Read more —
Day 16–60 days of Data Science and Machine Learning
Connect the docs..
medium.datadriveninvestor.com
Learn how to implement Decision Tree and Random Forest Regressor via project —
Stay tuned!
For other projects, tune to —
Build Machine Learning Pipelines( With Code)
Recurrent Neural Network with Keras
Clustering Geolocation Data in Python using DBSCAN and K-Means
Facial Expression Recognition using Keras
Hyperparameter Tuning with Keras Tuner
Custom Layers in Keras
That’s it fellas. Peace out and keep coding :)
Stay Tuned and of-course let me end this post with a quote by Avicii
Figure out what you’re most passionate about in life and what you’re good at. And the mixture between those two and then you should give it your all, all the time


