
5 Steps To Render D3.js With React Functional Components
A complete guide on how to use D3 inside React
Data visualization is the graphical representation of information and data. It utilizes visual elements to present trends, outliers, and patterns in data. It is particularly efficient when the data is numerous, such as in a time series, which is a series of data points indexed in time order.
D3.js is a JavaScript library for visualizing data using web standards. D3 stands for “data-driven documents.” It binds arbitrary data to a Document Object Model (DOM) and then applies data-driven transformations to the document. We can use D3 to generate an HTML table from an array of numbers. Or we can use the same data to create an interactive SVG (Scalable Vector Graphics) bar chart with smooth transitions and interactions.
In a previous article, we noted that C3 allows us to build charts quickly without knowing all the complexity of D3. Using C3 to create a chart requires just a few lines of code. However, it takes extra effort to implement the same chart using D3 since you must consider the X and Y axes, each data point’s shape, size, and position, etc.
Why do we want to dive into the complexity and nitty-gritty details of D3?
Because D3 provides rich features to construct graphical representations. For a chart, D3 can customize every detail of axes, shapes, tooltips, texts, colors, and animation.
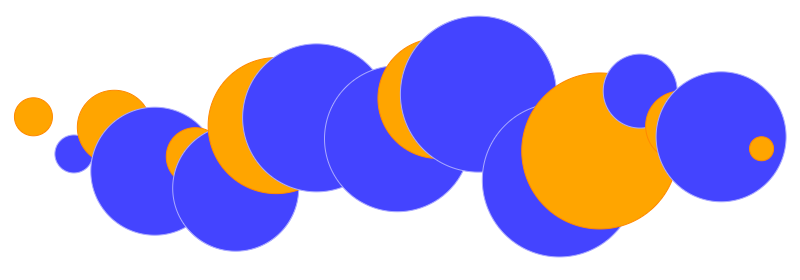
In this article, we are going to build the bubble image above as an example. We will use React for the working environment and create a svg tag to host these orange and blue circles that are managed by D3.
5 Steps To Render D3 in React
React is a declarative, efficient, and flexible JavaScript library for building user interfaces. Both D3 and React are opinionated libraries that manipulate the DOM. Since we are using React for the working environment, D3 only manipulates the DOM in data visualization areas. For those D3-managed areas, we relinquish what React would offer in terms of performance and efficiency.
It takes five steps to render D3 in React:
- Build uncontrolled components.
- Create D3 code.
- Put D3 code into
useLayoutEffect. - Set up event listeners.
- Balance between React and D3 code.
1. Build Uncontrolled Components
We discussed controlled and uncontrolled components in this article. A controlled component manages its children’s data, while an uncontrolled component lets its children manage their own data.
D3-managed areas need to be constructed as uncontrolled components. For the uncontrolled svg element in our example, useRef is created to access the SVG component:
const containerRef = useRef(null);This containerRef's current is assigned to the SVG element in React code:
<svg id="content" width="100%" height="350" ref={containerRef}>
  <g transform="translate(0, 100)" />
</svg>
With this React ref, the SVG element’s width can be obtained with containerRef.current.clientWidth.
2. Create D3 Code
We create a React component named Circles whose props are an array of numbers that specify the radii of the circles. The odd-indexed circles are blue and even-indexed circles are orange.
The following is D3 code that arranges these circles:
It takes four steps to draw circles.
Bind D3 data (line 1)
The following functions are used to bind D3 data:
d3.selectselects the first matching element.d3.selectAllselects all matching elements.d3.datajoins the data array to each element of the selection.
Line 1 selects the g (group) tag and selects all circle tags within the group to join the data array.
Enter new data (lines 3-10)
The following functions are used to enter data:
d3.enterreturns the DOM elements that need to be added when the joined array is longer than the selection.d3.appendusually followsd3.enterand actually adds missing elements to the DOM.d3.attrupdates an attribute.
Lines 3-10 add the new data that have not yet been bound. The new data are configured by radius (line 6), circle center X value (line 7), circle center Y value (line 8), circle stroke color (line 9), and circle filling color (line 10).
Update existing data (lines 12-17)
It uses the d3.attr function to configure existing elements with the radius (line 13), circle center X value (line 14), circle center Y value (line 15), circle stroke color (line 16), and circle filling color (line 17).
Remove exiting data (line 19)
The following functions are used to remove exiting data:
d3.exitreturns the DOM elements that need to be removed when the joined array is shorter than the selection.d3.removeusually followsd3.exitand actually removes extra elements from the DOM.
Line 19 removes the DOM elements that have no data to be bound.
Aren’t the second and third steps (using the same functions to configure circles) redundant?
Yes. They are coded to allow the flexibility for new and existing elements to be displayed or animated differently. However, since they are coded with the same behavior, they can be combined using d3.merge to handle both entering and existing data.
Here is the simplified D3 code:
With the merge function on line 6, the D3 code is shortened.
3. Put D3 Code Into useLayoutEffect
What is useLayoutEffect?
useLayoutEffect has a signature that is identical to useEffect’s, but it fires synchronously after all DOM mutations. It implies that useEffect fires asynchronously along with all DOM mutations.
Here is what happens:
propsor state changes cause component re-rendering.- React runs the code to update the DOM.
useLayoutEffectruns (blocking the actual display).- The display is visually updated.
useEffectruns (not blocking the actual display).
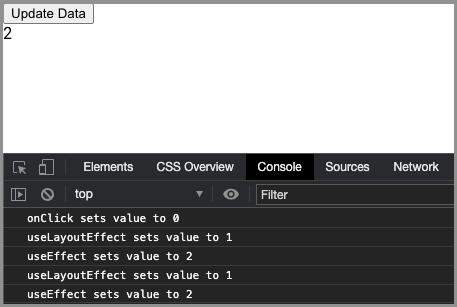
As always, we use Create React App to explore React useEffect and useLayoutEffect. The following is the modified src/App.js:
When the Update Data button is clicked, in the console, it is set to 0, and then 1 and 2. The display shows the final value, 2. We can see that useLayoutEffect runs before useEffect.
By commenting out lines 11-14 and clicking the Update Data button quickly and repeatedly, we can see the flicking between 0 and 2.
By commenting out lines 6-9 and clicking the Update Data button quickly and repeatedly, we can see that the value (1) is displayed without any flicking.
Most of the time, we should use useEffect. However, if the code mutates the DOM, useLayoutEffect should be used to block the display until the DOM finishes mutating. This way, we can avoid the display flicking.
Since D3 code mutates the DOM, it should be put into useLayoutEffect:
Line 1 uses useLayoutEffect to wrap the D3 code.
Line 2 ensures that the data is an array.
4. Set Up Event Listeners
As we have mentioned, we relinquish React’s control to D3 for the svg element. Therefore, we may need to take care of some extra things, such as resizing.
We have drawn circles evenly based on the width of the viewing area. Since the uncontrolled SVG component does not repaint unless the data props change, these circles are not going to be rearranged when the display is resized. An event listener needs to be used to handle the resize event. In this case, useEffect is a good choice to handle resizing.
Line 6 adds the resize event handler.
Line 7 removes the resize event handler during the effect cleanup.
This works, but the display flickers during resizing. In fact, we do not need to display every step of the resizing. Debounce can help us delay changes until resizing is stabilized. We can use Create React App’s built-in debounce to achieve this:
On line 5, debounce is added to the resize event handler.
Now we have all the pieces for the complete example of D3 in React. They are composed of three files:
- The added
d3package insidedependencies inpackage.json:
"dependencies": {
  "d3": "^6.3.1",
  ...
}- The newly added
src/Circles.js:
- The modified
src/App.js:
Our example is composed of two components: the Update Data button (line 17) and the Circles component (line 18).
When the button is clicked, the circles are updated. The click handler is implemented on lines 6-13. It calculates how many circles are to be displayed and the radius of each circle.
The following is a video clip of this example:
5. Balance Between React and D3 Code
In the previous example, besides svg and g tags, data visualization is handled by D3, which uses a number of functions to manipulate SVG.
Actually, we can use React to manage SVG directly. Here is the code to accomplish the same example:
Why do we need D3 then?
For some operations, D3 offers advantageous methods to achieve certain effects in a very simple manner. For example, d3.scaleLinear constructs a scale with a linear relationship between input and output. It saves a lot of effort to position the data in a chart.
We have two powerful libraries to manage the DOM. They can achieve similar things in some cases. The React way is native in a React environment, while D3’s approach is superior for manipulating data visualization. We have shown one case of mostly D3 and another case of React only. They can be mixed with different ratios. The important part is to find a balance point for code manageability and efficiency.
Conclusion
D3 is excellent for data visualization and React is excellent for the general user interface. They are both opinionated libraries that manipulate the DOM. Marrying them properly can create beautiful user interfaces.
In next article, we are going to construct D3 charts in React.
Thanks for reading. I hope this was helpful. You can see my other Medium publications here.


