Time Series Forecasting of China Stock Market Using Weka-Part 6. Regression test for 399005

Hao, Zheng
JiPeng, Liu
Nannan, Lu
Table of Contents
1.2.2 Literature review on data mining applications
1.3 Regression technique for time series forecasting
1.3.1 Introduction of regression
2.2 Flowchart model introduction
3. Experiments and Results Discussion
3.4 Basic configuration of forecasting package
3.5 Advanced configuration of forecasting package
3.6 Regression test for 399006
3.6.1 Linear regression testing and validating
3.6.2 Cross regression testing and validating
3.7 Regression test for 399005
3.7.1 Linear regression testing and validating
3.7.2 Cross regression testing and validating
3.8 Regression test for 000001
The steps of basic and advanced configuration of Weka have already introduced above. In this section thus only compare and analysis different regression algorithms on target 000001.
3.8.1 Linear regression testing and validating
For the index 000001, we still use linear regression to do six rounds of training test based on different parameters, after which we can find the best result in each round. The parameters for each round are shown in Table 21 below.
The statistics for 10 days forecasting data (000001) is shown in Table 22.
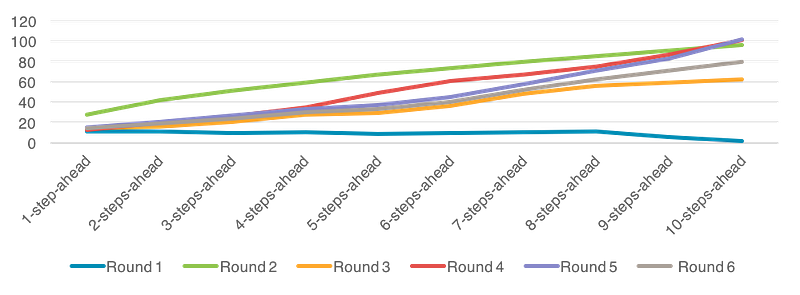
The statistics data of MAE for 6 rounds testing is shown in Table 23.
The line chart is also displayed in Figure 35.
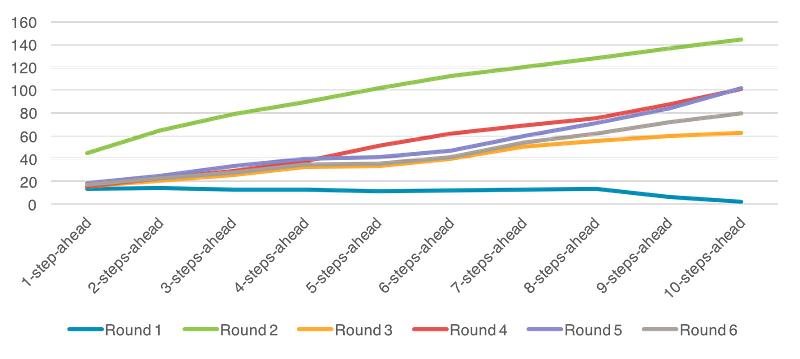
The statistics data of RMSE for 6 round testing is shown in Table 24.
The line chart is also displayed in Figure 36.
Both metrics indicate that Round 3 has the best average performance for prediction. The conclusion of Index 000001 is similar with previous, so there is not extra explanation in this section.
3.8.2 Cross regression testing and validating
Using the same parameters from round 3 of linear regression, we try to compare the forecasting effects between 4 different regressions. The setting of parameter in round 3 is listed here:
• Attributes Name:
Key_Date, CP, CHN_GDP, US_GDP GR, WGDP, CBoP, ER, CTR, CUpCDI, SF
• Lag length: Minimum 1
Maximum 5
• Overlay data: select all
However, when we forecast using SMOreg algorithm, the forecasting accuracy is relatively low. As a result, we add another test by changing the Maximum lag length to 10. The result shows a better behaviour comparing to the formal test.
The statistics for 10 days forecasting data is collected and summarized in Table 25.
The statistics data of MAE for the forecast is shown in Table 26.
The line chart is also displayed in Figure 37.
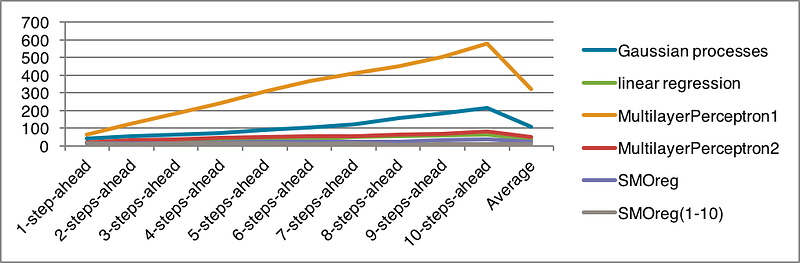
The statistics data of RMSE for the forecast is shown in Table 27.
The line chart is also displayed in Figure 38.
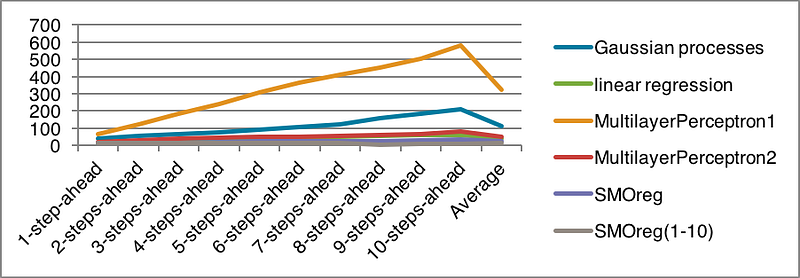
Both metrics indicate that SMOreg algorithm has the best average performance of prediction.
To conclude:
• For Target 000001, SMOreg algorithm shows the best forecasting result
• The best parameter for one regression may not suit other types of regression
3.8.3 Output display
The steps of transforming train data and identifying attributes have already introduced above. In this section thus only show the visualization of the output.
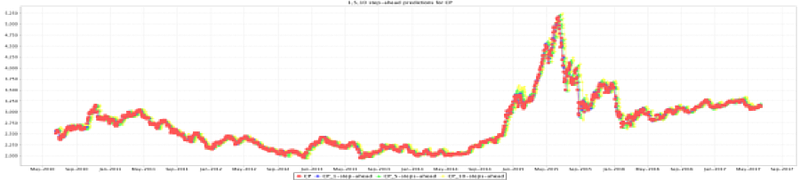
Figure 39 shows the train prediction for targets, which means the movement of actual price and predicted price.
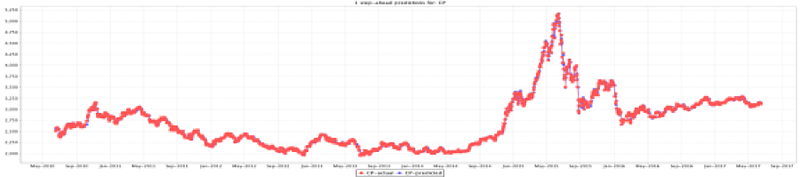
Figure 40 shows the train prediction at steps, which presents the movement of actual price and 1,5 and 10 step ahead predicted price separately.