Time Series Forecasting of China Stock Market Using Weka-Part 4. Regression test for 399006

Hao, Zheng
JiPeng, Liu
Nannan, Lu
Table of Contents
1.2.2 Literature review on data mining applications
1.3 Regression technique for time series forecasting
1.3.1 Introduction of regression
2.2 Flowchart model introduction
3. Experiments and Results Discussion
3.4 Basic configuration of forecasting package
3.5 Advanced configuration of forecasting package
3.7 Regression test for 399005
3.7.1 Linear regression testing and validating
3.7.2 Cross regression testing and validating
3.8 Regression test for 000001
3.8.1 Linear regression testing and validating
3.8.2 Cross regression testing and validating
3.6 Regression test for 399006
We designed two types of forecasting test. One is to do fine tune configuration with different input parameters based on regression method. After that, we compare different algorithms based on the same settings of configuration. The parameter of the model with the best performance in the first experiment will be used as the input setting in the second part. Then according to the analysis of the outcome metrics, we can filter out the optimal model.
3.6.1 Linear regression testing and validating
One of the most commonly used forecasting algorithmic is linear regression. We use linear regression to do several rounds of training test based on different parameters. After that, we can get the best result based on comparing the metrics of the outcome in each round.
Then we designed 8 round forecasting test to train the forecasting model with different input parameters. The detailed parameter setting in each round is shown in table 7.
The statistics for 10 days forecasting data is shown in Table 8.
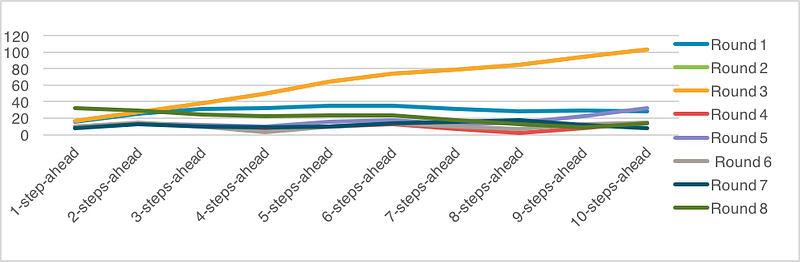
The statistics data of Mean absolute error (MAE) for 8 round testing is shown in Table 9.
The bold values refer to the best performing round.
The line chart is also displayed in Figure 19.
The statistics data of Root mean squared error (RMSE) for 8 round testing is shown in Table 10.
The bold values refer to the best performing round.
The line chart is also displayed in Figure 20.
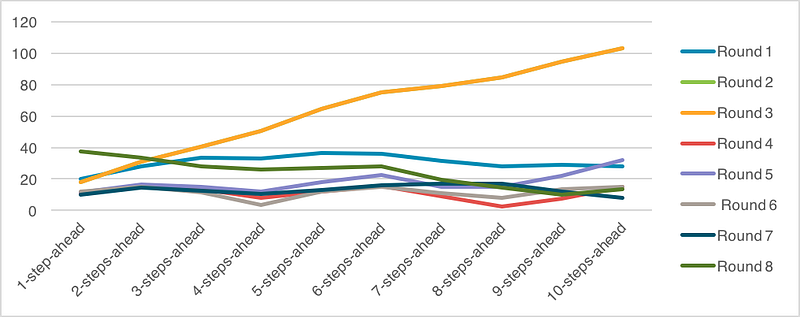
Both metrics indicate that round 4 has the best average performance of prediction. Besides, we can find a significant error reduction from round 3 to round 4. The reason is the reduction of the three attributes: IR_C, RRR_L, RRR_SM. Through analysing the output log, we can find the reason is that these are all classified attributes after the transformation of training data. Figure 21 shows the log in the output area.
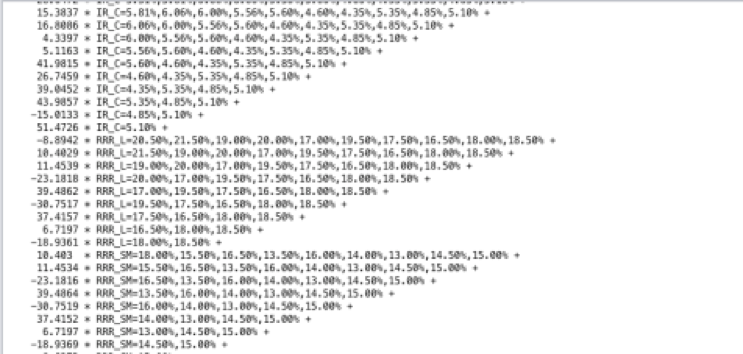
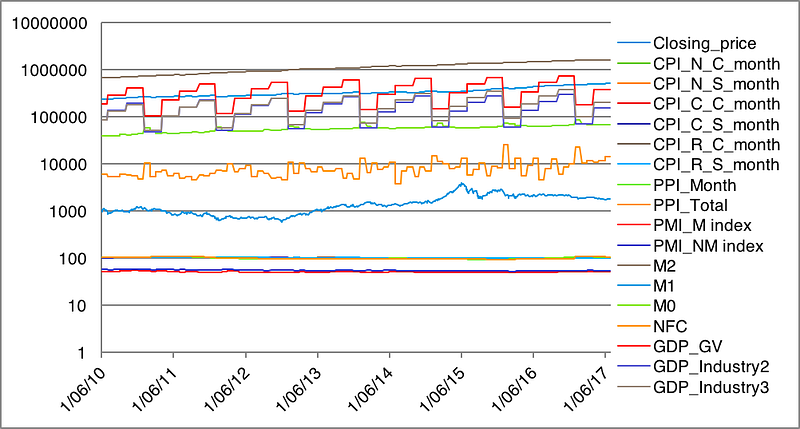
Figure 22 shows the new run chart of 399006 after attribute reduction in round 4.
Through the 8 round forecasting test and output evaluation, we can come to the following conclusion:
1. Round 4 shows the best forecasting result.
2. Attributes reduction is very important to improve forecasting results, especially the excluding of classified attributes
3. Parameter adjustment can also have effect on the forecast accuracy.
3.6.2 Cross regression testing and validating
Using the same parameters from round 4 of linear regression, we try to compare the forecasting effect between 4 different regressions. The setting of parameter in round 4 is listed here:
· Attributes name: key_date, Closing_price, CPI_N_C_month, CPI_N_S_month, CPI_C_C_month, CPI_C_S_month, CPI_R_C_month, CPI_R_S_month, PPI_Month, PPI_Total, PMI_M, index, PMI_NM, index, M2, M1, M0, NFC, GDP_GV, GDP_Industry2, GDP_Industry3
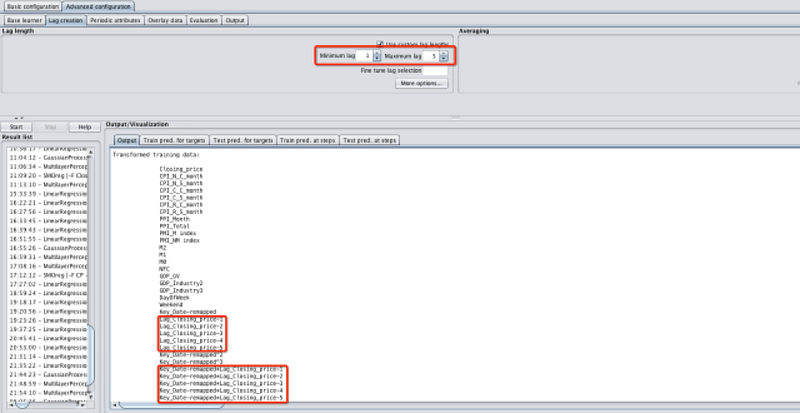
· Lag length: Minimum lag: 1 , Maximum lag: 5
· Overlay data: use and select all.
However, when we forecast using Multilayer Perceptron, the forecasting accuracy is relatively low. As a result, we add another test by changing the Maximum lag length to 20. The result shows a better behaviour comparing to the formal test.
The statistics for 10 days forecasting data is collected and summarized in Table 11.
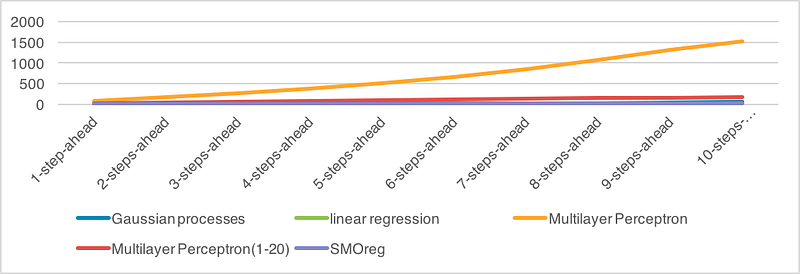
The statistics data of Mean absolute error (MAE) for the forecast is shown in Table 12.
The bold values refer to the best performing model.
The line chart is also displayed in Figure 23.
The statistics data of Root mean squared error (RMSE) for the forecast is shown in Table 13.
The bold values refer to the best performing model.
The line chart is also displayed in Figure 24.
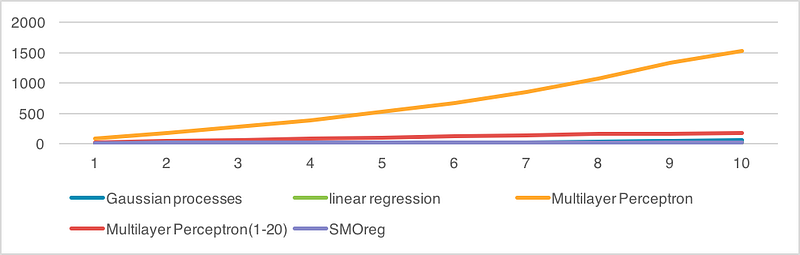
Both metrics indicate that Linear regression has the best average performance of prediction.
To conclude:
· Results show that all the models accurately predict the stock index 399006, but linear regression in Weka outperforms the other four models
· The best parameter for one regression may not suit other types of regression
3.6.3 Output display
· Transformed training data
In the output area, we can find that after we set the maximum and minimum length of lag, the target “Closing_price” and “Key_Date” will divided into corresponding number of transformed attributes after the transformation of training data (Figure 25).
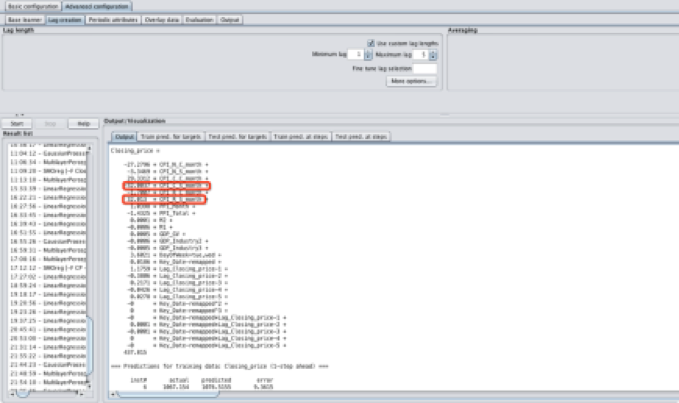
· Identify positive and negative attributes
For linear regression, based on the factor in the generated formula, we can identify the attributes that have more positive or negative contribution to the forecasting result. In Figure 26, we can find the CPI_C_S is the most negative independent attribute, while CPI_C_S is the most positive independent attribute.
· Data Visualization
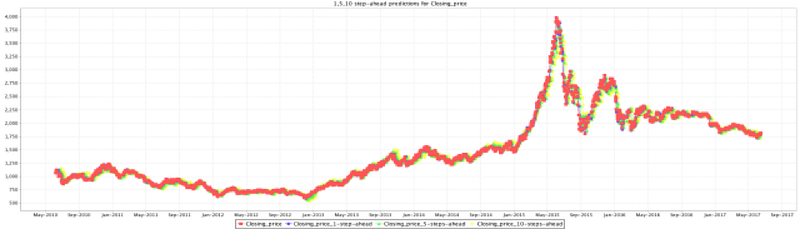
Figure 27 shows the train prediction for targets that shows the movement of actual price(red line) and predicted price(blue line).
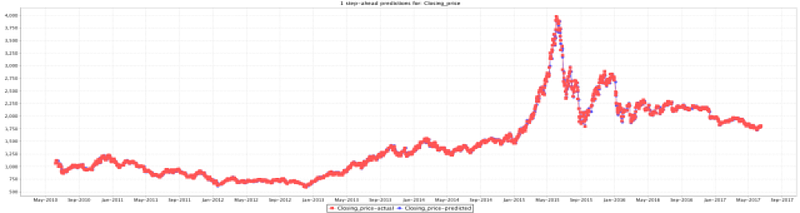
Figure 28 shows the train prediction at steps that presents the movement of actual price and 1,5 and 10 step ahead predicted price separately.