Time Series Forecasting of China Stock Market Using Weka-Part 5. Regression test for 399005

Hao, Zheng
JiPeng, Liu
Nannan, Lu
Table of Contents
1.2.2 Literature review on data mining applications
1.3 Regression technique for time series forecasting
1.3.1 Introduction of regression
2.2 Flowchart model introduction
3. Experiments and Results Discussion
3.4 Basic configuration of forecasting package
3.5 Advanced configuration of forecasting package
3.6 Regression test for 399006
3.6.1 Linear regression testing and validating
3.6.2 Cross regression testing and validating
3.8 Regression test for 000001
3.8.1 Linear regression testing and validating
3.8.2 Cross regression testing and validating
3.7 Regression test for 399005
The steps of basic and advanced configuration of Weka have already introduced above. In this section thus only compare and analysis different regression algorithms on target 399005.
3.7.1 Linear regression testing and validating
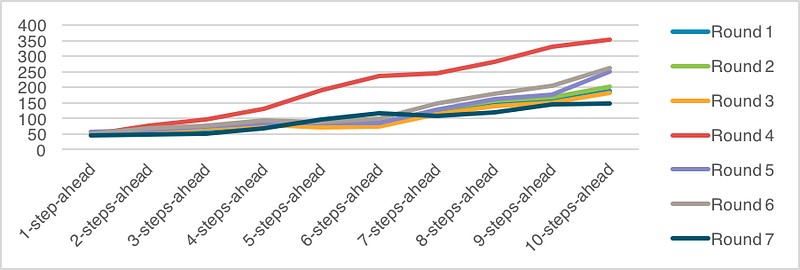
In this section, we did 7 round tests using linear regression to find the related attribute and best lag number for future analysis. From table 14, we can see round 1 is initial test with all attributes. In round 2 and round 3, some attributes like Volume and import_cu were removed for its irrelevant with this index. In next round 4, 5, 6, unchecked overlay data, lag number 1–20 and 1–10 were compared to find the best performance. In round 7, we tested the algorithm with the listed attributes and lag number 1–5.
The statistics for 10 days forecasting data is shown in Table 15.
The statistics data of Mean absolute error (MAE) for 7 rounds testing is shown in Table 16.
The bold values refer to the best performing round.
The line chart is also displayed in Figure 29.
The statistics data of Root mean squared error (RMSE) for 7 rounds testing is shown in Table 17.
The bold values refer to the best performing round.
The line chart is also displayed in Figure 30.
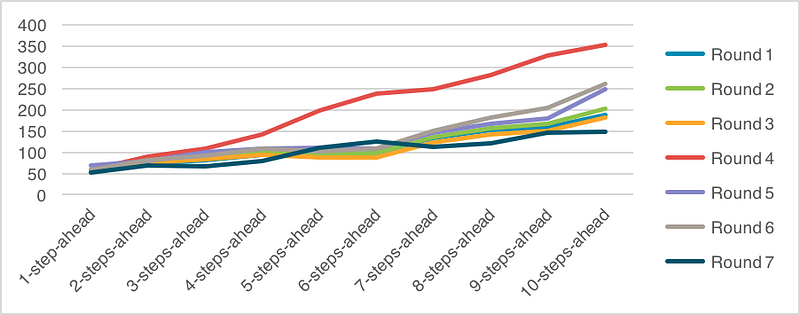
Figure 30 The Line chart of RMSE for 7 round testing (399005)
Analyzing the outputs of those 7 rounds tests on Weka, Round 7 has the minimum Mean Absolute Error and Root Mean Squared Error in Table 16 and Table 17. Therefore, we chosen attributes and configurations of round 7 for further analysis.
3.7.2 Cross regression testing and validating
The setting of parameter in Round 7 is listed here:
· Attributes name: key_date, Closing_price, ppi_cu, pmi_product, currency_m0, currency_m1, currency_m2, shibor_1d, shibor_1w, shibor_2w, shibor_1m, shibor_3m, shibor_6m, shibor_9m, shibor_1y
· lag length: Minimum lag: 1
Maximum lag: 5
· overlay data: use and select all.
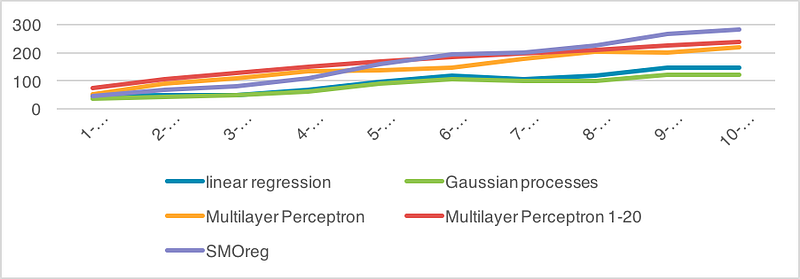
For time serial predication, it contains the following algorithms liner regression, Gaussian processes, multilayer perceptron and SMOreg. For time limited, we used the attributes and configuration liner regression as a standard to test the performance between those four algorithms.
The statistics for 10 days forecasting data is collected and summarized in Table 18.
The statistics data of Mean absolute error (MAE) for the forecast is shown in Table 19.
The bold values refer to the best performing round.
The line chart is also displayed in Figure 31.
The statistics data of Root mean squared error (RMSE) for the forecast is shown in Table 20.
The bold values refer to the best performing round.
The line chart is also displayed in Figure 32.
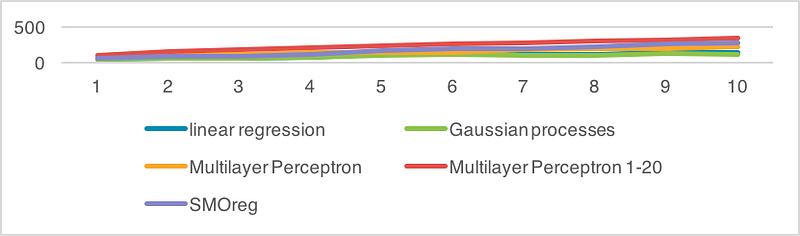
From Table 19–20, for 399005 index, Gaussian processes have the best predication with lowest MAE and RMSE.
3.7.3 Output display
Figure 33 is the train prediction for targets with the actual price in red and predication price in blue.
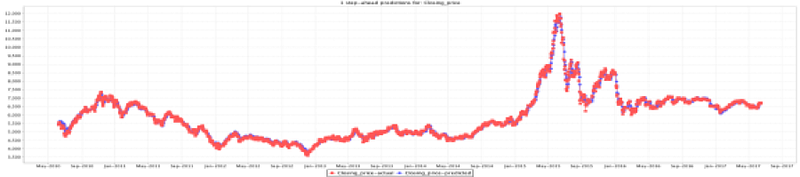
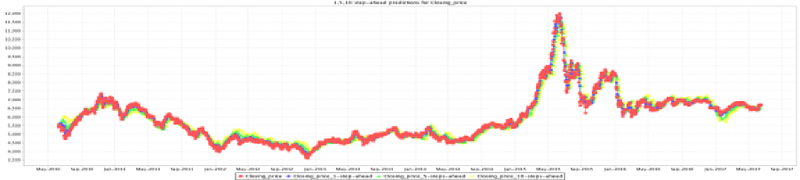
Figure 34 is the train prediction at steps with the actual price and 1, 5 and 10 step ahead predicted price separately.