
Tabular Playground Series-Mar 2021, Leaderboard %14, EDA + Feature Engineering 🔥
This is part 1 of the TPS-Mar21 competition that I am in LB %14.

Hi dear readers 👋, I am telling my work about the TPS-Mar21 competition in this article.
Tabular Playground Series is a Kaggle competition series that only include tabular data. You can see the dataset here and you can see full python code at the end of the article.

Introduction
In this part, we looked closer at the data. The shape of train data is (300000, 30) and the shape of the test data is (200000, 30).
import pandas as pd
import numpy as np

train = pd.read_csv('/kaggle/input/tabular-playground-series-mar-2021/train.csv')
test = pd.read_csv('/kaggle/input/tabular-playground-series-mar-2021/test.csv')

train_y = train['target']
train_data = train.drop(columns=['id', 'target'])
test_data = test.drop(columns=['id'])

train_rows_len = train_data.shape[0]

train_test_data = pd.concat([train_data, test_data])

print(train_data.shape)
print(test_data.shape)
print(train_test_data.shape)(300000, 30)
(200000, 30)
(500000, 30)Target Data Distribution
You can see a distribution of the target column below. According to this plot, the target distribution is low unbalanced. If the target distribution is between 20%-40%, low unbalanced; 1%-20% is medium unbalanced and <1% is extremely unbalanced.
import matplotlib.pyplot as plt

plt.hist(train_y)
plt.title("Target Histogram")
plt.show()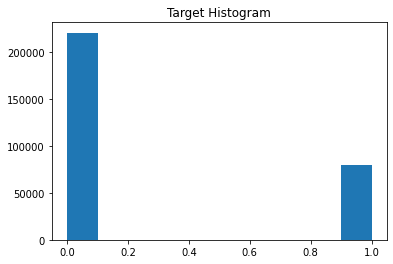
Split Numerical and Categorical
Data has 19 categorical features and 11 numeric features.
data_categorical_pd  = train_test_data.loc[:,train_test_data.dtypes==np.object]
data_numerical_pd = train_test_data.loc[:,train_test_data.dtypes!=np.object]print('data_categorical_pd.shape: ', data_categorical_pd.shape)
print('data_numerical_pd.shape: ', data_numerical_pd.shape)data_categorical_pd.shape: (500000, 19)
data_numerical_pd.shape: (500000, 11)Data cleaning
The data cleaning part has four different parts Dealing with null values, Dealing with outliers, Label encoding, Categorical values quality checking.
Data cleaning — Dealing with null values
The data hasn’t null values.
categorical_missing_val_count = (data_categorical_pd.isnull().sum())
numerical_missing_val_count = (data_numerical_pd.isnull().sum())print('categorical_missing_val_count')
print(categorical_missing_val_count[categorical_missing_val_count > 0])
print('numerical_missing_val_count')
print(numerical_missing_val_count[numerical_missing_val_count > 0])categorical_missing_val_count
Series([], dtype: int64)
numerical_missing_val_count
Series([], dtype: int64)Data cleaning — Dealing with outliers
import seaborn as sns
import warningswarnings.simplefilter("ignore")# Numerical
y_plot = train_y.copy()
y_plot.columns = ['target']
Data_plot = pd.concat([data_numerical_pd[:][:len(y_plot)], y_plot], axis=1)for feature in data_numerical_pd.columns:
fig, (ax1, ax2) = plt.subplots(nrows=1, ncols=2, figsize=(10, 5))
plot10 = sns.distplot(Data_plot[Data_plot['target']==0][feature],ax=ax1, label='0')
sns.distplot(Data_plot[Data_plot['target']==1][feature],ax=ax1,color='red', label='1')
plot10.axes.legend()
ax1.set_title('Distribution of {name}'.format(name=feature)) sns.boxplot(x='target',y=feature,data=Data_plot,ax=ax2)
ax2.set_xlabel('Category')
ax2.set_title('Boxplot of {name}'.format(name=feature)) fig.show()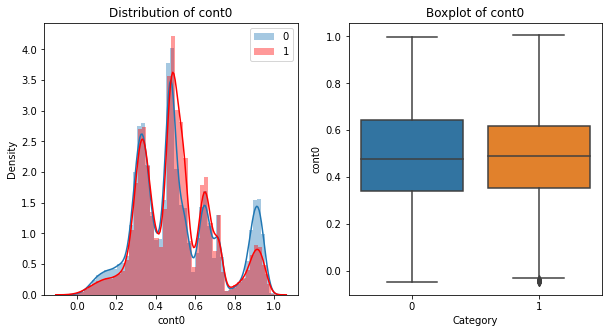
data_plot = pd.concat([data_categorical_pd[:][:len(y_plot)], y_plot], axis=1)
feature_list = []
for col in data_categorical_pd.columns:
    if len(data_categorical_pd[col].unique()) <= 20:
        feature_list.append(col)

n_cols = 3
nrows = round(len(feature_list) / n_cols)
fig, axes = plt.subplots(nrows, n_cols, figsize=(24, 12))
plt.subplots_adjust(hspace=0.5)

index = 0
for row in range(nrows):
    for col in range(n_cols):
        feature = feature_list[index]

        sns.barplot(x=feature, y='target', data=data_plot, ax=axes[row][col])
        axes[row][col].set_title(feature + ' Distribution', color = 'red')

        index += 1
plt.show()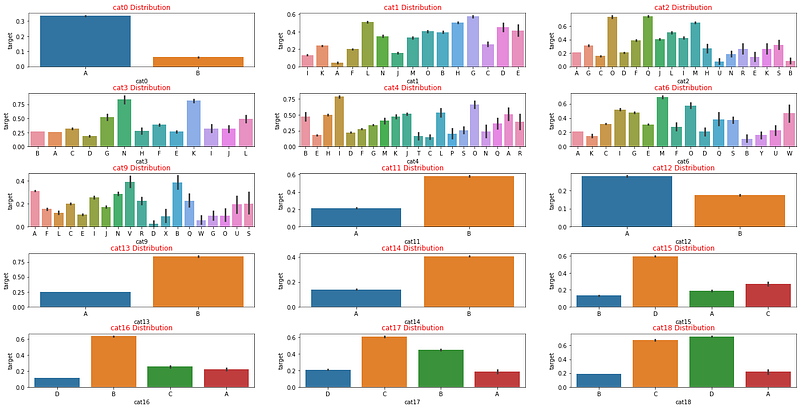
Data cleaning — Categorical values quality checking
Cat10 feature has a lot of different object features and some objects are in the train set but are not in the test set. Therefore cat10 is a bad feature for ml models. You can drop this feature or replace low repeat values with ‘OTHERS’.
from sklearn.model_selection import train_test_split

object_cols = data_categorical_pd.columns
X_train, X_valid, y_train, y_valid = train_test_split(data_categorical_pd[:][:len(train_y)], train_y, train_size=0.8, test_size=0.2,
                                                      random_state=0)

# Columns that can be safely label encoded
good_label_cols = [col for col in object_cols if
                   set(X_train[col]) == set(X_valid[col])]

# Problematic columns that will be dropped from the dataset
bad_label_cols = list(set(object_cols)-set(good_label_cols))

print('good_label_cols: ', len(good_label_cols))
print(good_label_cols)
print('bad_label_cols: ', len(bad_label_cols))
print(bad_label_cols)
good_label_cols: 18
['cat0', 'cat1', 'cat2', 'cat3', 'cat4', 'cat5', 'cat6', 'cat7', 'cat8', 'cat9', 'cat11', 'cat12', 'cat13', 'cat14', 'cat15', 'cat16', 'cat17', 'cat18']
bad_label_cols: 1
['cat10']Data cleaning — Label encoding
Ml models can not understand object types of data (except some tree models) that are why we have to encode them to numeric data. You can use LabelEncoder or OneHotEncoder for the encoding process.
from sklearn.preprocessing import LabelEncoder
from sklearn.preprocessing import OneHotEncoder

data_categorical_encoded_pd = data_categorical_temp_pd.copy()
for feature in data_categorical_encoded_pd.columns:
        le = LabelEncoder()
        data_categorical_encoded_pd[feature] = le.fit_transform(data_categorical_temp_pd[feature].astype(str))
Feature Engineering
In this part, we add and multiply some features for creating new features.
data_categorical_FeaEng_pd = data_categorical_encoded_pd.copy()
data_numerical_FeaEng_pd = data_numerical_pd.copy()

data_categorical_FeaEng_pd['cat9cat2T'] = (data_categorical_encoded_pd['cat9'] + data_categorical_encoded_pd['cat2'])
data_categorical_FeaEng_pd['cat9cat2M'] = (data_categorical_encoded_pd['cat9'] * data_categorical_encoded_pd['cat2'])...Feature Transformation
Machine learning models predict targets better when the distribution of data is normal. For this reason, we use box-cox transformation.
from scipy.stats import skew, boxcox
import seaborn as sns
...
Preparation Data For Training
After all processes, we split data to train and test again. Now the shape of the train data is (300000, 68) and the shape of the test data is (200000, 68).
X_train = pd.concat([data_numerical_TR_pd[:][:train_rows_len], data_categorical_TR_pd[:][:train_rows_len]], axis=1)
X_test = pd.concat([data_numerical_TR_pd[:][train_rows_len:], data_categorical_TR_pd[:][train_rows_len:]], axis=1)
y_train = train_y.copy()

X_train.to_csv('x_train.csv',index=False)
X_test.to_csv('x_test.csv',index=False)
y_train.to_csv('y_train.csv',index=False)

print('X_train shape: ', X_train.shape)
print('X_test shape: ', X_test.shape)
print('y_train shape: ', y_train.shape)
X_train shape: (300000, 68)
X_test shape: (200000, 68)
y_train shape: (300000,)This is part 1 of the TPS-Mar21 competition that I am in LB %14. In this article, we prepared data for better prediction and in the second part, we will work on modeling.
You can see full python code and all plots from here 👉 Kaggle Notebook.
👋 Thanks for reading. If you enjoy my work, don’t forget to like it 👏, follow me on Medium and LinkedIn. It will motivate me in offering more content to the Medium community! 😊