
E-Commerce Forecasting Fbprophet + Optuna
A quick article about how to use Optuna with Fbprophet.
The great thing about Optuna is, not only is it simple to use, but also it’s relaxable too. You can easily adapt Optuna to what do you use for machine learning or deep learning.
In this article, we look closer to how to use Fbprophet with Optuna. When we working on this article, we used E-Commerce Data dataset. This is a transnational data set that contains all the transactions occurring between 01/12/2010 and 09/12/2011 for a UK-based and registered non-store online retail. The objective of usage of Fbprophet is, forecast the growth of the e-commerce market in United Kingdom. This article has 3 parts those are Analyze and Clean the Dataset, Hyperparameter Tuning with Optuna, and Scores of Fbprophet.
You can see full python code from here 👉 Kaggle Notebook.

Analyze and Clean the Dataset
In this article, we only work with United Kingdom. So firstly, we filter the Country.
data = pd.read_csv('/kaggle/input/ecommerce-data/data.csv',encoding="ISO-8859-1")
data_UK = data[data['Country'] == 'United Kingdom']
data_UK['total_price'] = data_UK['Quantity'] * data_UK['UnitPrice']
data_UK['InvoiceDate'] = pd.to_datetime(data_UK['InvoiceDate'])
data_UK['InvoiceDate_1h'] = data_UK['InvoiceDate'].dt.round('1h')
Then we check for missing values and there are missing values in the dataset. But there is no missing value in the Quantity and UnitPrice columns that we are interested in. Therefore, we don’t need missing value handling.
data_UK.isna().sum()InvoiceNo 0
StockCode 0
Description 1454
Quantity 0
InvoiceDate 0
UnitPrice 0
CustomerID 133600
Country 0
total_price 0
InvoiceDate_15m 0
InvoiceDate_1h 0
dtype: int64Thirdly, there are outliers in the dataset. These outliers have bad effects on forecasting. That is why we filter the total_price column between -2000 and 20000.
data_UK.plot(x='InvoiceDate', y='total_price')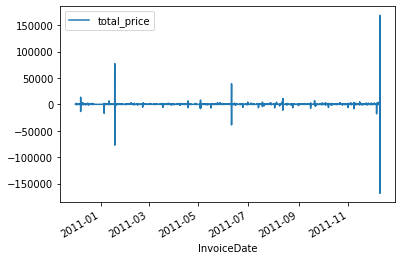
data_UK.loc[(data_UK['total_price'] > 2000) | (data_UK['total_price'] < -2000), 'total_price'] = None
data_UK.plot(x='InvoiceDate', y='total_price')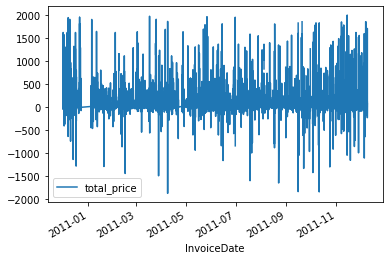
The dataset should have ds and y columns for forecasting in Fbprophet. Also when the growth parameter is ‘logistic’, the dataset should have cap and floor columns too.
t = np.arange(data_UK_1h.index[0], data_UK_1h.index[-1] + timedelta(hours=1), timedelta(hours=1)).astype(datetime)
train_test = pd.DataFrame()
train_test['ds'] = pd.to_datetime(t)
train_test['y'] = 0
train_test['cap'] = 20000
train_test['floor'] = -2000
train_test.iloc[train_test['ds'].isin(data_UK_1h.index), 1] = data_UK_1h['total_price']
Hyperparameter Tuning with Optuna
Hyperparameter tuning is the problem of selecting a set of optimal hyperparameters for a machine learning algorithm. Every machine learning algorithm has different parameters and these parameters can change according to problem and dataset. You can see the train, validation, test parts of the dataset below.
test_size = int(train_test.shape[0] / 10)
train_df = train_test.iloc[:-test_size, :]
val_df = train_test.iloc[-test_size:int(-test_size/2), :]
test_df = train_test.iloc[int(-test_size/2):, :]
Optuna is the most popular hyperparameter tuning technique. You can see the usage of Optuna for Fbprophet below.
def objective(trial):
    params = {
        'changepoint_prior_scale': trial.suggest_float('changepoint_prior_scale', 0.005, 5),
        'changepoint_range': trial.suggest_float('changepoint_range', 0.8, 0.9),
        'seasonality_prior_scale': trial.suggest_float('seasonality_prior_scale', 0.1, 10),
        'holidays_prior_scale': trial.suggest_float('holidays_prior_scale', 0.1, 10),
        'seasonality_mode': trial.suggest_categorical('seasonality_mode', ['multiplicative', 'additive']),
        'growth': trial.suggest_categorical('growth', ['linear', 'logistic']),
        'weekly_seasonality': trial.suggest_int('weekly_seasonality', 5, 10),
        'yearly_seasonality': trial.suggest_int('yearly_seasonality', 1, 20)
    }

    m = Prophet(**params)
    m.add_country_holidays(country_name='US')
    m.fit(train_df)
    preds = m.predict(val_df[['ds', 'cap', 'floor']])

    mae_score = mean_absolute_error(val_df['y'], preds['yhat'])
    return mae_score
study = optuna.create_study(direction='minimize')
study.optimize(objective, n_trials=1000)After 1000 trials, finally, we find the best parameters of Fbprophet for the dataset.
study.best_params
params = {
     'changepoint_prior_scale': 3.391667952710346,
     'changepoint_range': 0.8397114666270911,
     'seasonality_prior_scale': 3.6115808925351867,
     'holidays_prior_scale': 4.845991897188627,
     'seasonality_mode': 'multiplicative',
     'growth': 'linear',
     'weekly_seasonality': 10,
     'yearly_seasonality': 3
}
Scores of Fbprophet
The mean absolute error metric is better than the mean squared error when the dataset has an outlier. That is why we use MAE. R2 metric is used for understanding the randomness of predictions. If the model always predicts the mean value, the r2 score will be 0.
def regression_report(y_true, y_pred):
    mae_score = mean_absolute_error(y_true, y_pred)
    mse_score = mean_squared_error(y_true, y_pred)
    R2_score = r2_score(y_true, y_pred)

    report_dict = {
        'mae_score': mae_score,
        'mse_score': mse_score,
        'r2_score': R2_score
    }

    return report_dict
m = Prophet(**params)
m.add_country_holidays(country_name='US')
concat_train_df = pd.concat([train_df, val_df])
m.fit(concat_train_df)
preds = m.predict(test_df[['ds', 'cap', 'floor']])
result = regression_report(test_df['y'], preds['yhat'])You can see the result variable below.
result{'mae_score': 1333.9556232410328,
'mse_score': 6747670.311778453,
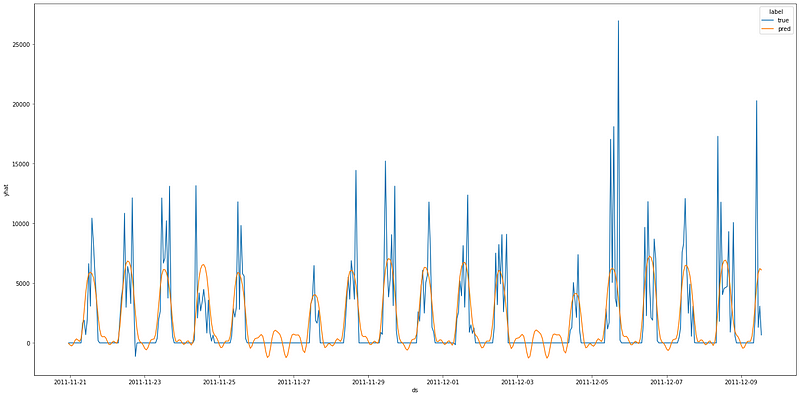
'r2_score': 0.48140082967636566}Now, we can plot the predictions and their real values.
pd.options.mode.chained_assignment = None
test_df.loc[:, 'label'] = 'true'
test_df.loc[:, 'yhat'] = test_df.loc[:, 'y']
preds.loc[:, 'label'] = 'pred'
df_result = pd.concat([test_df[['yhat', 'label', 'ds']], preds[['yhat', 'label', 'ds']]])
fig, ax = plt.subplots(figsize=(24, 12))
sns.lineplot(y='yhat', x='ds', ax=ax, data=df_result, hue='label', markers=True)
plt.show()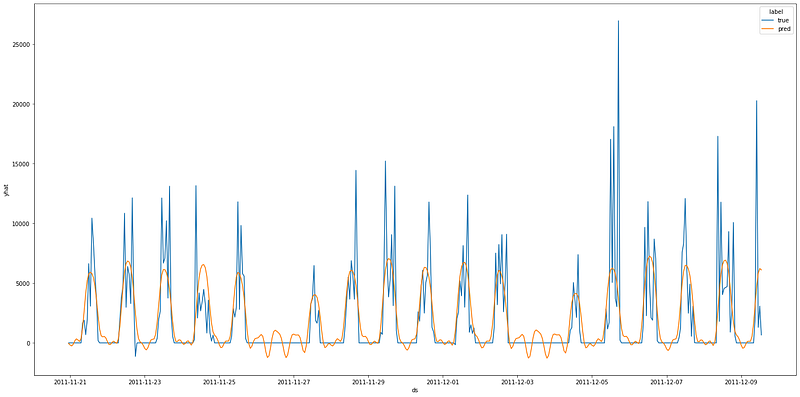
👋 Thanks for reading. If you enjoy my work, don’t forget to like it, follow me on Medium and LinkedIn. It will motivate me in offering more content to the Medium community! 😊
References:
[1]: https://www.kaggle.com/hasanbasriakcay/e-commerce-forecasting-fbprophet-optuna [2]: https://facebook.github.io/prophet/docs/quick_start.html


