Free AI web copilot to create summaries, insights and extended knowledge, download it at here
4932
Abstract
"hljs-string">'Age'</span>]].dropna()
plt.figure(figsize=(8,5))
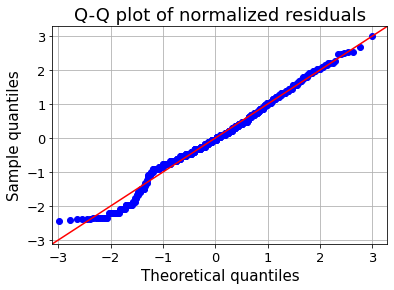
<span class="hljs-attribute">fig</span>=qqplot(train_age_dropna[<span class="hljs-string">'Age'</span>], <span class="hljs-attribute">line</span>=<span class="hljs-string">'45'</span>,fit='True')
plt.xticks(<span class="hljs-attribute">fontsize</span>=13)
plt.yticks(<span class="hljs-attribute">fontsize</span>=13)
plt.xlabel(<span class="hljs-string">"Theoretical quantiles"</span>,<span class="hljs-attribute">fontsize</span>=15)
plt.ylabel(<span class="hljs-string">"Sample quantiles"</span>,<span class="hljs-attribute">fontsize</span>=15)
plt.title(<span class="hljs-string">"Q-Q plot of normalized residuals"</span>,<span class="hljs-attribute">fontsize</span>=18)
plt.grid(<span class="hljs-literal">True</span>)
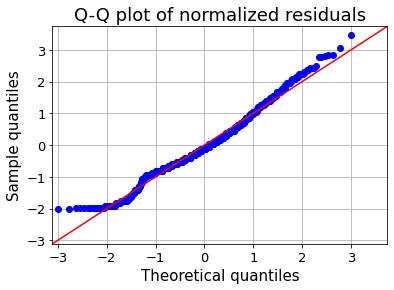
plt.show()</pre></div><figure id="4589"><img src="https://cdn-images-1.readmedium.com/v2/resize:fit:800/0*i1ie5op864ucM1UM.png"><figcaption>Q-Q plot — image by author</figcaption></figure><h1 id="ea46">Box-Cox Transformation</h1><p id="f628">Box-Cox transformation is used to bring closer distribution of the feature to the normal distribution. As you can see below, before box-cox transformation skew of age is 0.39 and after box-cox transformation, it becomes -0.05. That is closer to zero.</p><div id="f875"><pre>from scipy<span class="hljs-selector-class">.stats</span> import skew, boxcox
skew_value = <span class="hljs-built_in">skew</span>(train_age_dropna<span class="hljs-selector-attr">[<span class="hljs-string">'Age'</span>]</span>)
<span class="hljs-function"><span class="hljs-title">print</span><span class="hljs-params">(<span class="hljs-string">'old skew: '</span>, skew_value)</span></span>
new_value, fitted_lambda = <span class="hljs-built_in">boxcox</span>(train_age_dropna<span class="hljs-selector-attr">[<span class="hljs-string">'Age'</span>]</span>)
<span class="hljs-function"><span class="hljs-title">print</span><span class="hljs-params">(<span class="hljs-string">'new skew: '</span>, skew(new_value)</span></span>)
plt<span class="hljs-selector-class">.figure</span>(figsize=(<span class="hljs-number">8</span>,<span class="hljs-number">5</span>))
fig=<span class="hljs-built_in">qqplot</span>(new_value, line=<span class="hljs-string">'45'</span>,fit=<span class="hljs-string">'True'</span>)
plt<span class="hljs-selector-class">.xticks</span>(fontsize=<span class="hljs-number">13</span>)
plt<span class="hljs-selector-class">.yticks</span>(fontsize=<span class="hljs-number">13</span>)
plt<span class="hljs-selector-class">.xlabel</span>(<span class="hljs-string">"Theoretical quantiles"</span>,fontsize=<span class="hljs-number">15</span>)
plt<span class="hljs-selector-class">.ylabel</span>(<span class="hljs-string">"Sample quantiles"</span>,fontsize=<span class="hljs-number">15</span>)
plt<span class="hljs-selector-class">.title</span>(<span class="hljs-string">"Q-Q plot of normalized residuals"</span>,fontsize=<span class="hljs-number">18</span>)
plt<span class="hljs-selector-class">.grid</span>(True)
plt<span class="hljs-selector-class">.show</span>()</pre></div><div id="5756"><pre><span class="hljs-attribute">old</span> skew: <span class="hljs-number">0</span>.<span class="hljs-number">3882898514698657</span>
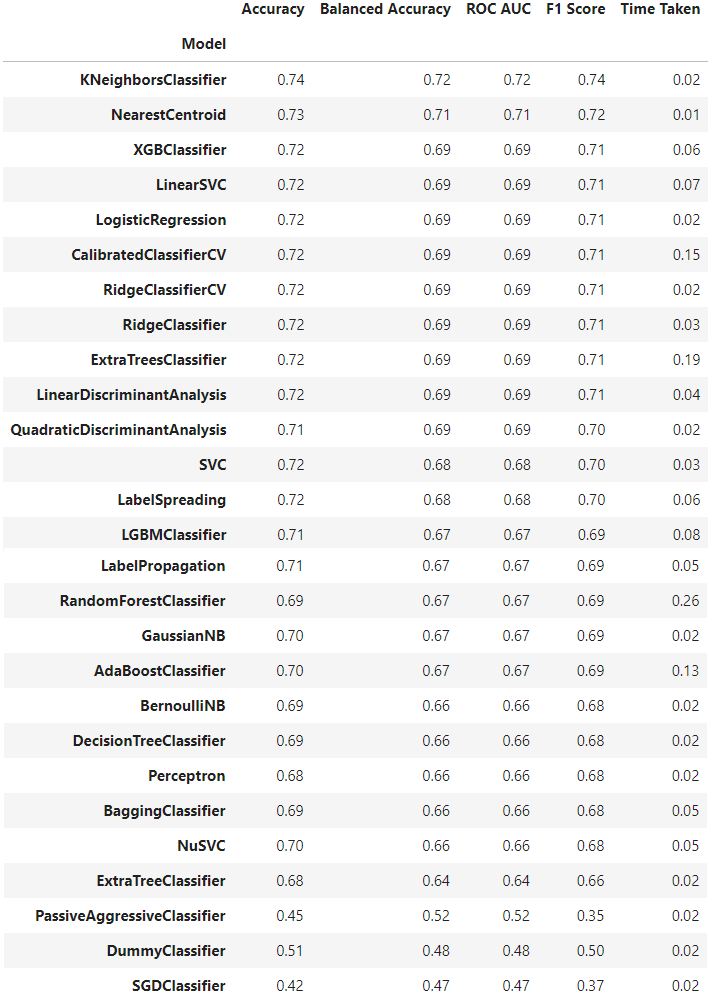
<span class="hljs-attribute">new</span> skew: -<span class="hljs-number">0</span>.<span class="hljs-number">04897110694154816</span></pre></div><figure id="82d0"><img src="https://cdn-images-1.readmedium.com/v2/resize:fit:800/0*uN2GFTGKRsfQxT89.png"><figcaption>Q-Q plot After Box-Cox Transformation— image by author</figcaption></figure><h1 id="1c28">Lazy Predict</h1><p id="265e">All machine learning has its advantages and disadvantages. You can see a lot of ml model results by using lazypredict library. After predictions, you can select the best ml model for your problem.</p><div id="4c12"><pre>from lazypredict.Supervised import LazyClassifier, LazyRegressor
from sklearn.model_selection import train_test_split
<span class="hljs-built_in">load</span> data
X, y = train<span class="hljs-string">[['Pclass', 'SibSp', 'Parch', 'Fare']]</span>, train<span class="hljs-string">[['Survived']]</span></pre></div><div id="3f45"><pre>X_train, X_test, y_train, y_test = train_test_split(X, y, <span class="hljs-attribute">test_size</span>=.2, <span class="hljs-attribute">random_state</span>=42)</pre></div><div id="c2fa"><pre># fit <span class="hljs-keyword">all</span> <span class="hljs-keyword">models</span>
clf = LazyClassifier(predictions=True)
<span class="hljs-keyword">models</span>, predictions = clf.fit(X_train, X_test, y_train, y_test)
<span class="hljs-keyword">models</span></pre></div><figure id="93d2"><img src="https://cdn-images-1.readmedium.com/v2/resize:fit:800/1*LnlxufyEIlEKATo2QOR1vQ.png"><figcaption><i>LazyClassifier </i>Results — image by author</figcaption></figure><p id="5268">👋 Thanks for reading. If you enjoy my work, don’t forget to like it, fo
Options
llow me <a href="https://medium.com/@hasan.basri.akcay">on Medium</a> and <a href="https://www.linkedin.com/in/hasan-basri-akcay/">LinkedIn</a>. It will motivate me in offering more content to the Medium community! 😊</p><h1 id="ec0a">References</h1><p id="f6df">[1]: <a href="https://pandas-profiling.github.io/pandas-profiling/docs/master/rtd/index.html">https://pandas-profiling.github.io/pandas-profiling/docs/master/rtd/index.html</a>
[2]: <a href="https://imbalanced-learn.org/stable/user_guide.html#user-guide">https://imbalanced-learn.org/stable/user_guide.html#user-guide</a>
[3]: <a href="https://scipy.github.io/devdocs/tutorial/index.html#user-guide">https://scipy.github.io/devdocs/tutorial/index.html#user-guide</a>
[4]: <a href="https://lazypredict.readthedocs.io/en/latest/">https://lazypredict.readthedocs.io/en/latest/</a></p><div id="d188" class="link-block">
<a href="https://www.linkedin.com/in/hasan-basri-akcay/">
<div>
<div>
<h2>Hasan Basri Akçay - Data Engineer - İnelso Energy Systems | LinkedIn</h2>
<div><h3>View Hasan Basri Akçay's profile on LinkedIn, the world's largest professional community. Hasan Basri has 6 jobs listed…</h3></div>
<div><p>www.linkedin.com</p></div>
</div>
<div>
<div style="background-image: url(https://miro.readmedium.com/v2/resize:fit:320/0*GQR71lILU2897L7U)"></div>
</div>
</div>
</a>
</div><h2 id="3c88">More…</h2><div id="54dc" class="link-block">
<a href="https://readmedium.com/welcome-2022-what-has-changed-in-data-science-in-2021-dac24bd37929">
<div>
<div>
<h2>Welcome, 2022🎉. What Has Changed in Data Science in 2021?</h2>
<div><h3>Best Data Science Tools, Methods, and Techniques such as Cloud Computing Product, Automated ML Tools, Courses, IDEs…</h3></div>
<div><p>medium.com</p></div>
</div>
<div>
<div style="background-image: url(https://miro.readmedium.com/v2/resize:fit:320/1*dsTfAexTofYMUwPVET802Q.png)"></div>
</div>
</div>
</a>
</div><div id="7e27" class="link-block">
<a href="https://readmedium.com/application-security-automation-part-3-5934b9444144">
<div>
<div>
<h2>Application Security Automation Part 3</h2>
<div><h3>Automated Static Code Analysis</h3></div>
<div><p>medium.com</p></div>
</div>
<div>
<div style="background-image: url(https://miro.readmedium.com/v2/resize:fit:320/0*yL67nQ9lVptNrOkQ)"></div>
</div>
</div>
</a>
</div><div id="432a" class="link-block">
<a href="https://readmedium.com/what-are-the-differences-between-data-scientists-that-earn-500-and-225-000-yearly-ea60ccdf03d7">
<div>
<div>
<h2>What Are The Differences Between Data Scientists That Earn 500💲 And 225.000💲 Yearly?</h2>
<div><h3>This article is about important talents, tools, features of the country, and features of the company for high income in…</h3></div>
<div><p>medium.com</p></div>
</div>
<div>
<div style="background-image: url(https://miro.readmedium.com/v2/resize:fit:320/1*kigSkk0txLLC_CtuebcVuA.gif)"></div>
</div>
</div>
</a>
</div><div id="1eb7" class="link-block">
<a href="https://readmedium.com/e-commerce-forecasting-fbprophet-optuna-6e9a83d89079">
<div>
<div>
<h2>E-Commerce Forecasting Fbprophet + Optuna</h2>
<div><h3>A quick article about how to use Optuna with Fbprophet.</h3></div>
<div><p>medium.com</p></div>
</div>
<div>
<div style="background-image: url(https://miro.readmedium.com/v2/resize:fit:320/1*EHE8aX_CNR4rpeg5vfckuw.png)"></div>
</div>
</div>
</a>
</div><div id="f277" class="link-block">
<a href="https://readmedium.com/olympic-medal-numbers-predictions-with-timeseries-part-2-data-analysis-5d5d7e38fc37">
<div>
<div>
<h2>Olympic Medal Numbers Predictions with Time Series, Part 2: Data Analysis</h2>
<div><h3>Fbprophet, Darts, AutoTS, Arima, Sarimax and Monte Carlo Simulation</h3></div>
<div><p>medium.com</p></div>
</div>
<div>
<div style="background-image: url(https://miro.readmedium.com/v2/resize:fit:320/1*c48pN1nf2BYyPIXPM5UydA.jpeg)"></div>
</div>
</div>
</a>
</div></article></body>