Python — Machine learning Data Clean up
Learn different ways to clean the data
Now that we have understood the data, visualized the data let’s clean the data so that we are ready for using different machine learning algorithms.
For understanding data refer to my post — https://readmedium.com/machine-learning-understanding-data-dfef261d833b
For data visualization refer to my post — https://readmedium.com/data-visualization-5b1dc260c91a
For python code for data clean up- https://github.com/arshren/MachineLearning/blob/master/Python%20-%20Cleaning%20the%20data.ipynb
Understanding, visualizing and cleaning the data are the most fundamental steps that we need to master along with understanding different machine learning algorithms.
In this post we will learn about
- Removing duplicate entries from the dataset
- Removing irrelevant observations
- Handling missing data
We will take different datasets to learn different ways to clean the data
Removing duplicate entries from the dataset
We will first import the required libraries -pandas and numpy
import numpy as np
import pandas as pd
we will create a dataframe with duplicate values and then see how we can remove duplicate entries
df = pd.DataFrame({"Name":["Jack", "Jill", "John", "Jack"], "Rank":[1,21,3,1], "Marks":[99,56,97,99]})
df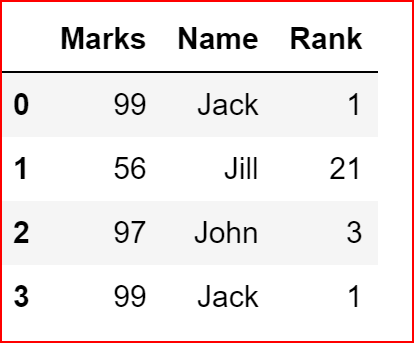
now let’s remove the duplicate entries and keep the first instance of occurence and will delete any other duplicate entries
df.drop_duplicates(keep='first')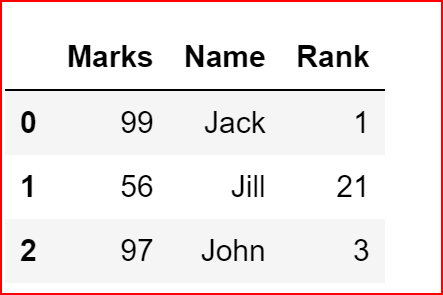
Dropping any instance of the duplicate rows
df.drop_duplicates(keep=False)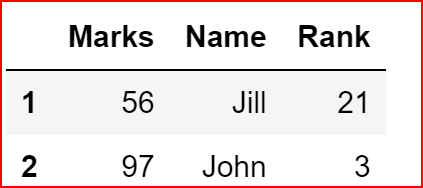
Inplace is false by default and that means the original dataset remain unchanged, so if we print df again we see all rows
df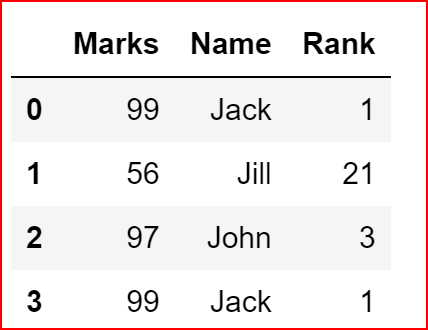
df.drop_duplicates(keep='first', inplace=True)
df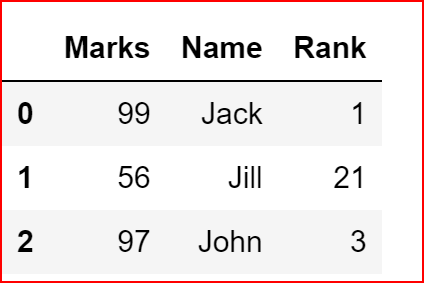
Removing irrelevant observations
Titanic dataset is available here -https://www.kaggle.com/c/titanic
we will now read the data from the downloaded dataset. and we will use the training dataset — train.csv.
For more details on reading from a different formats of file and writing to different formats of file follow my post — https://readmedium.com/python-reading-and-writing-data-from-files-d3b70441416e
To get a good understanding of the data refer to my post-https://readmedium.com/machine-learning-understanding-data-dfef261d833b
I have downloaded my dataset in my default jupyter folder
data_set = pd.read_csv("train.csv")Let’s view all the features of the dataset by printing just 3 rows from the dataset
data_set.head(3)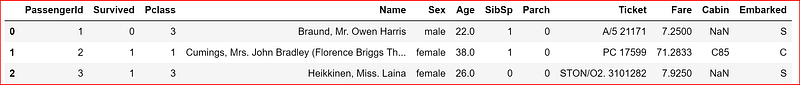
In the data_set dataframe Name and Ticket seems to be irrelevant and doesn’t seem to help with our analysis for predicting passenger’s survival chance so we go and drop the column
data_set.drop(['Name', 'Ticket'], inplace=True, axis=1)
data_set.head(3)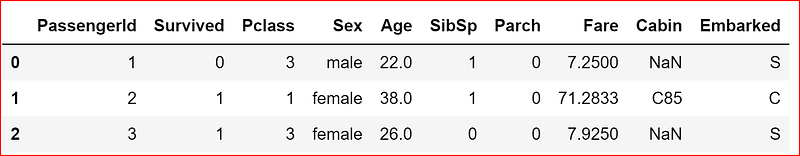
Handling missing data
Dropping rows that contain missing value
We can drop the rows that contain null or missing data by using dropna(). If we set inplace to True then the original dataset gets modified
data_set.dropna(inplace = True)
data_set.head(3)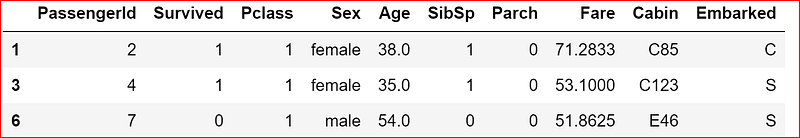
Always dropping rows that contain any null values may not be a good strategy as we may miss the randomness is the dataset
So, what is the next best option to handle missing value?
Setting threshold for null values in a row
we can set a threshold count and if a rows exceeds the threshold count for null values then we can drop the row.
We will drop a row from data_1 only if a row contains 2 or more null values, so we should be dropping only row 0 and row 2 and row 3 should remain.
If we print data_1 at this time, since inplace is False by default, data_1 dataframe remains unchanged.
data_1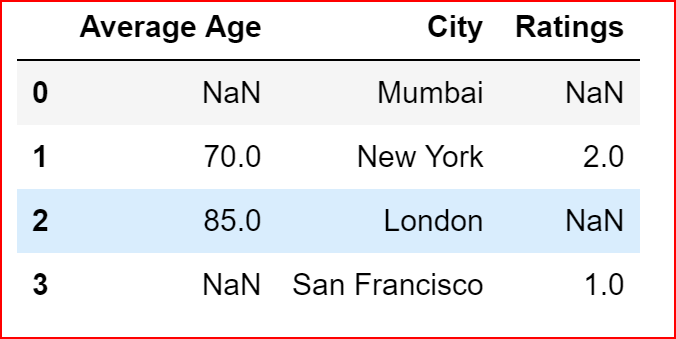
data_1.dropna(thresh=2)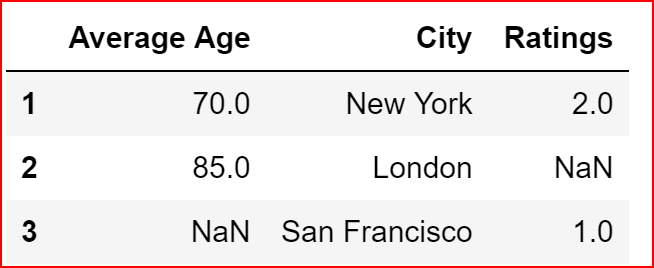
What if I do not want to drop any rows with missing data instead fill it with more meaning value?
Filling Missing data with Value
There are different ways we can fill the missing data with some meaningful values like mean or median or most frequently value available in the column.
One of the method is to use fillna() by specifying how we want to fill the null or missing values.
In the example below, we are filling the missing values in ‘Ratings’ column by taking a mean
data_1['Ratings'].fillna(data_1['Ratings'].mean(), inplace = True)
data_1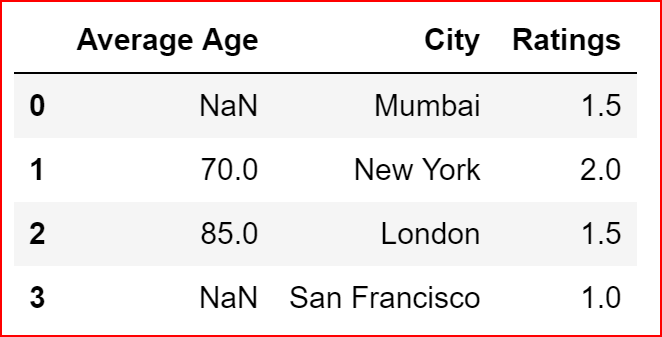
In the example below, we are filling the “Average Age” column by median of the “Average Age” column which is 77.5
data_1['Average Age'].fillna(data_1['Average Age'].median(), inplace = True)
data_1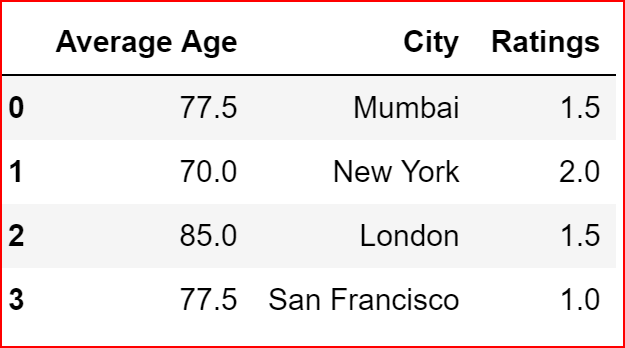
Imputing missing data with mean,median or most frequently used value for the column
For imputing we need to import Imputer from sklearn.preprocessing library
from sklearn.preprocessing import Imputerwe will create a new dataframe data_1 to show the usage of the Imputer class
countryData = pd.DataFrame({"Country":["France","Spain", "Germany", "USA"], "Age":[np.nan,45,np.nan,32], "Salary":[np.nan,90000,np.nan,75000]})countryData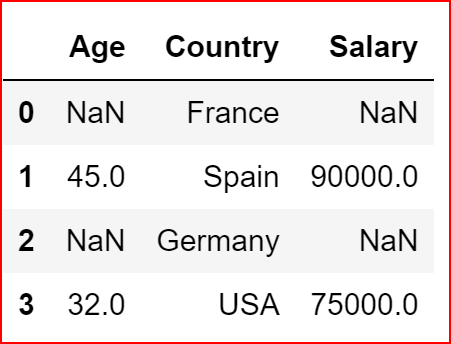
we will create the Imputer object and set a strategy for handling the missing values.
Different strategy available are mean, median and most_frequent
we then fit the imputter objects on the column where we want to handle the missing values
After fitting the data we transform the data from the dataframe
imp = Imputer(missing_values='NaN', strategy='mean', axis=0)imp.fit(countryData.iloc[:,[0,2]])countryData.iloc[:,[0,2]]=imp.transform(countryData.iloc[:,[0,2]])countryData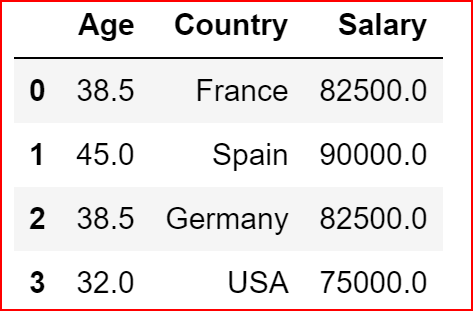
Using replace method
If we want to replace a value in the dataframe with one another value then we can use replace method.
we will use the same dataframe countryData
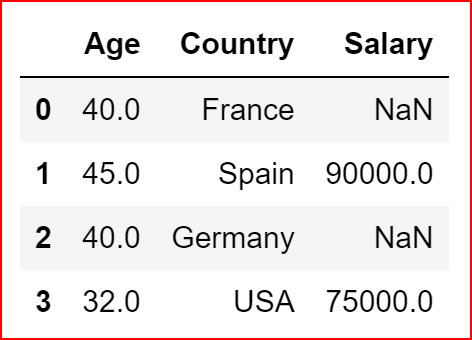
countryData = pd.DataFrame({"Country":["France","Spain", "Germany", "USA"], "Age":[np.nan,45,np.nan,32], "Salary":[np.nan,90000,np.nan,75000]})countryDataWe will replace NaN values for Age couln with a 40
countryData.replace({'Age':np.NAN},40 )