
Practical Monitoring with Prometheus & Grafana (Part I)
Installing Prometheus + Grafana via Helm in 5 Minutes
Prometheus at Scale: Architecture Considerations
In August 2018, Prometheus joined Kubernetes as the second project to graduate from CNCF and solidified itself as the de facto standard for open source monitoring tool for Kubernetes. From commercial offerings from Sysdig and Weaveworks to Prometheus operator charts from CoreOS and Bitnami, users now have more choices than before to install and deploy Prometheus onto Kubernetes. With so many options, how should one deploy Prometheus for scale?
Operators vs. Helm
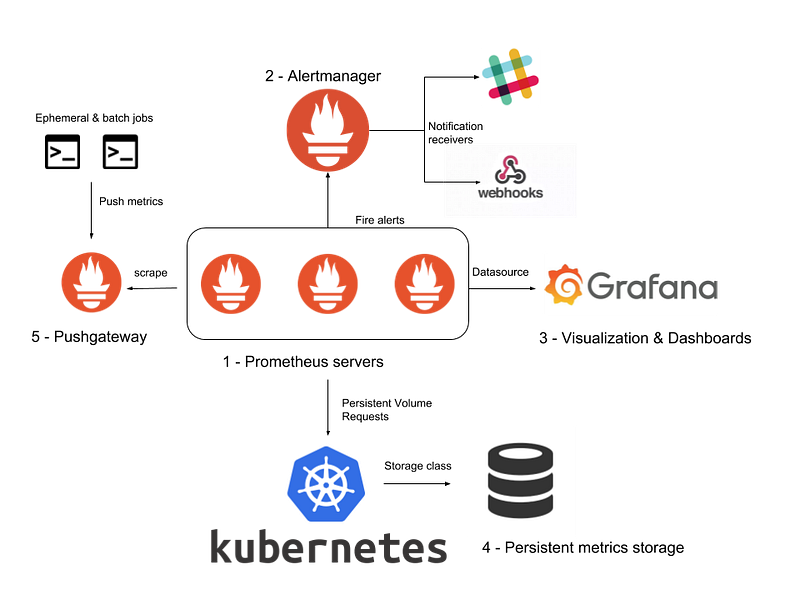
If you aren’t familiar with operators, they are software extensions to Kubernetes that package together application-specific custom resources and configurations. For a monitoring bundle that often includes Prometheus (server, alertmanager, push gateway) and Grafana, using a Prometheus operator from CoreOS or Bitnami provides preconfigured alerts and dashboards. It’s a matter of preference to use CoreOS’s kube-prometheus operator, which uses ksonnet or the prometheus-operator Helm chart.
There are some known issues for using the prometheus-operator on a private GKE cluster, so if you don’t want to change firewall settings or prefer Bitnami’s charts (perhaps you run their Redis or Postgres charts), then Bitnami’s prometheus-operator chart works great as well.
Personally, I found the operator pattern to be bit heavy on small or workload-specific clusters (e.g. a central cluster to host Vault or ChartMuseum). Prometheus Operators also come with a ton of default rules (e.g. etcd, kube-api-server) that you may be getting via another tool (e.g. Stackdriver for GKE) so you may spend a bit more time refining what you need initially.
Multi-Cloud or Multi-Cluster Setup
As Kubernetes clusters scale, there may arise a need for a centralize multi-cluster monitoring solution. It could be to tie together clusters deployed in different regions; a multi-cloud setup to pull CloudWatch, Stackdriver, GKE, and EKS metrics; or a hierarchical architecture to pull distributed job metrics across different job-specific clusters. Prometheus is flexible in that a Prometheus server in one cluster can also act as a target for another Prometheus. In other words, Prometheus supports federated monitoring.
Instead of exposing Prometheus via an ingress, Prometheus can authenticate via API server using standard Kubernetes TLS authentication and authorization via cluster roles. You can see an example setup on this blog post from THG.
Another option is to use Thanos (another CNCF project) to take advantage of its long-term storage and querying capabilities. Thanos uses the sidecar pattern to connect to Prometheus and export it to a more scalable cloud storage. One of the advantages of using Thanos is its querying engine that can partition the data and downsample to quickly run queries spanning multiple months or years.
To add Thanos to existing Prometheus deployment:
Installing Prometheus & Grafana
For the sake of simplicity, the rest of the series will assume a single cluster Prometheus and Grafana setup using the official Helm Chart. However, the instructions can be easily modified to work with operators or Thanos addons.
Without further ado, let’s deploy both charts! Assuming Helm is already installed onto your cluster (if not you can use Google’s Terraform module or follow Bitnami’s guide), it’s as simple as:
helm install prometheus stable/prometheus
// or using Helm 2
// helm upgrade --install prometheus stable/prometheus
and for Grafana
helm install grafana stable/grafana
// or using Helm 2
// helm upgrade --install grafana stable/grafana
Now you should have Prometheus server, alertmanager, pushgateway, kube-metrics, node exporter, and Grafana deployed. Prometheus Helm chart provides default scrape configs to collect metrics from Kubernetes apps inside your cluster.
In the next post, we will explore setting up blackbox monitoring to run a simple uptime check. This is a simple alternative to running Pingdom or uptime bots and a great candidate to host in a centralized Vault, ChartMuseum, or cross-cloud Prometheus to ping across clouds (i.e. check AWS endpoints from GCP).
You can find other posts in this series here: