
Practical Monitoring with Prometheus & Grafana (Part IV)
Securing Grafana with Identity-Aware Proxy
In Parts I, II, and III of the Practical Monitoring with Prometheus & Grafana series, we deployed Prometheus and Grafana on Kubernetes, installed blackbox probes, and configured anomaly detection to make a foundation for our monitoring stack. In this last post, we will complete the setup and look at securing Grafana using Google Cloud’s Identity-Aware Proxy (IAP).
Identity-Aware Proxy (IAP)
Grafana, by default, provides a username/password authentication mechanism to restrict access to the dashboards. Admin passwords are autogenerated at the time of install and stored as a Kubernetes secret. It also supports Lightweight Directory Access Protocol (LDAP) to integrate Active Directory and other directory services for authentication.
So that deals with user authentication, but how do we deal with access to Grafana? It’s not feasible to expect SREs or engineers on call to use port-forwarding on every cluster to access Grafana on localhost. Projects like kube-forwarder make the mechanism of switching contexts and forwarding ports easy, but what if you don’t want to give everyone access to Kubernetes but still want them to see the Grafana dashboards? The other option is to expose Grafana via an Ingress and configure firewall rules to restrict access via VPN or bastion hosts, which can be tricky and potentially expensive to set up.
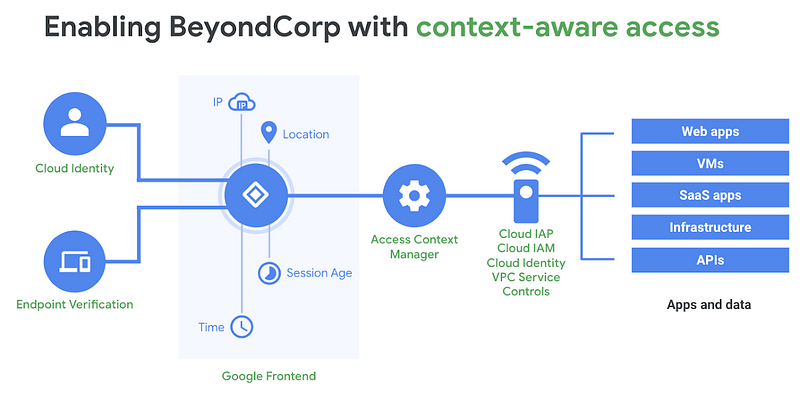
Google Cloud’s IAP is a simpler authentication and authorization mechanism to enable a zero-trust security model without VPNs. It builds on Google’s BeyondCorp model of shifting security from network perimeters to individuals users and uses context to determine access. In our Grafana use case, it adds a multi-factor authentication layer so that only authorized users can access our endpoint and subsequently login via Grafana username and password.
Configuring IAP on GKE
Without further ado, let’s configure IAP to secure access to Grafana. Some prerequisites before we begin:
- Global, reserved static IP
- SSL certificate
- Verified ownership of your domain
- GCP project
compute.securityAdminandcompute.backendServices.updaterole (or Editor/Owner)
Assuming you have Cloud SDK installed (or using Cloud Shell):
gcloud compute addresses create grafana-ip --globalIf you already have an SSL certificate, you can mount it as a Kubernetes secret and skip to the next step. If not, we can use Google’s managed certificate option:
apiVersion: networking.gke.io/v1beta2
kind: ManagedCertificate
metadata:
  name: grafana-cert
spec:
  domains:
    - grafana.example.com
Save the file as cert.yaml and create the resource (takes about 15–20 mins to become active):
kubectl apply -f cert.yamlFinally, you need to verify the ownership of your domain. Use Google’s webmaster tool or register your domain with Google Domains.
Setting Up Ingress
IAP on GKE is enabled via GCE Ingress, which means that we need to expose our Grafana service as a NodePort for the HTTPS Load Balancer to pass its health checks. Modify Grafana Helm chart to use NodePort (service type is immutable so may need to delete and reinstall):
helm upgrade grafana stable/grafana --set service.type=NodePortNow let’s create the ingress. You can define it within the Grafana Helm chart, but in case we want to apply the IAP to Prometheus or other services with the same ingress, I’m going to create it as a separate file (change bolded values as needed):
apiVersion: networking.k8s.io/v1beta1
kind: Ingress
metadata:
  name: ingress-monitoring
  annotations:
    kubernetes.io/ingress.global-static-ip-name: grafana-ip
    networking.gke.io/managed-certificates: grafana-cert
spec:
  rules:
  - host: grafana.example.com
    http:
      paths:
      - backend:
          serviceName: grafana
          servicePort: 80
Save it as ingress-monitoring.yaml and deploy:
kubectl apply -f ingress-monitoring.yaml(If you are providing your own SSL certificate, use the following instead)
apiVersion: networking.k8s.io/v1beta1
kind: Ingress
metadata:
  name: ingress-monitoring
  annotations:
    kubernetes.io/ingress.global-static-ip-name: grafana-ip
spec:
  tls:
  - secretName: my-cert-secret
  rules:
  - host: grafana.example.com
    http:
      paths:
      - backend:
          serviceName: grafana
          servicePort: 80
Once the ingress is healthy, https://grafana.example.com should redirect to your Grafana login page.
Enabling IAP
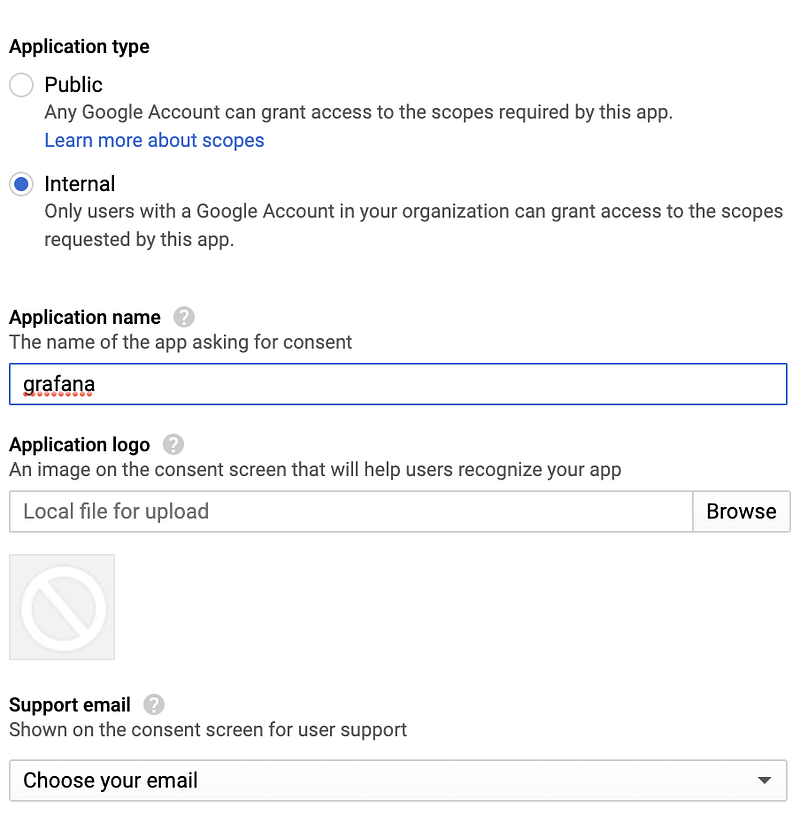
First, we need to configure the project’s OAuth consent screen:
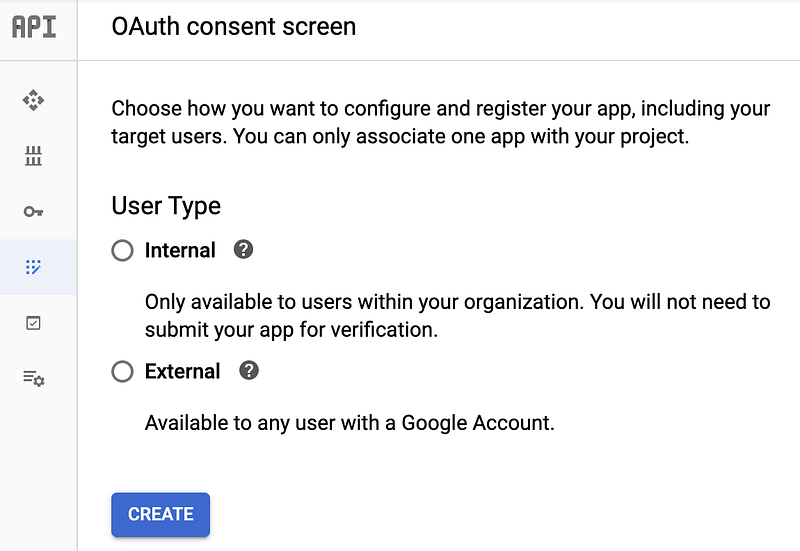
Since Grafana is an internal monitoring tool, choose Internal, and click Create. Fill out the application name, support email, and other optional fields:
Now, go to the Credentials page to create the OAuth client credentials:
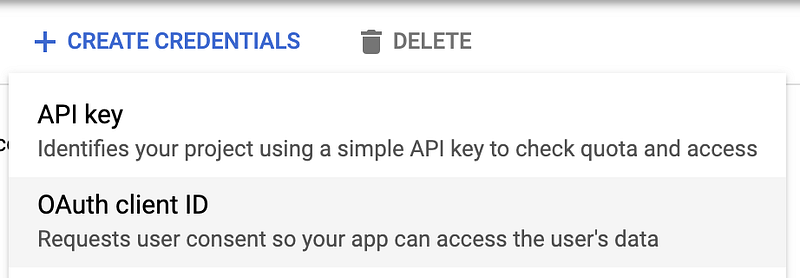
Application type is Web application, give it a name and click Create. Make note of the client ID and secret that is generated and copy the ID to your clipboard.
Go back and select the OAuth application and add the following URL to the authorized redirect URIs section:
https://iap.googleapis.com/v1/oauth/clientIds/<MY_CLIENT_ID>:handleRedirect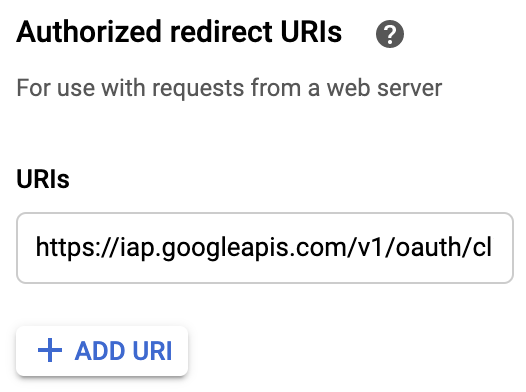
After saving the changes, it’s time to use the OAuth credentials to configure the Kubernetes BackendConfig. Copy the Client ID and Secret Key to create a Kubernetes secret called iap-credentials :
kubectl create secret generic iap-credentials \
  --from-literal=client_id=<client_id_key> \
  --from-literal=client_secret=<client_secret_key>
We can now use the secret to update the BackendConfig to enable our Ingresses to use IAP:
apiVersion: cloud.google.com/v1
kind: BackendConfig
metadata:
  name: iap-config
spec:
  iap:
    enabled: true
    oauthclientCredentials:
      secretName: iap-credentials
Deploy the BackendConfig changes: kubectl apply -f <backendconfig.yaml>
Finally, we need to update the annotations in Grafana services to associate our new BackendConfig to the NodePort (save as grafana.yaml):
service:
  type: NodePort
  annotations:
    beta.cloud.google.com/backend-config: '{"default": "iap-config"}'
Issue the Helm upgrade command:
helm upgrade grafana stable/grafana -f grafana.yaml
(Note: if you run into issues, refer to Google’s GKE IAP guide for debugging tips.)
Configuring IAP access
Navigate back to the IAP page and you should see the Grafana backend service for use:
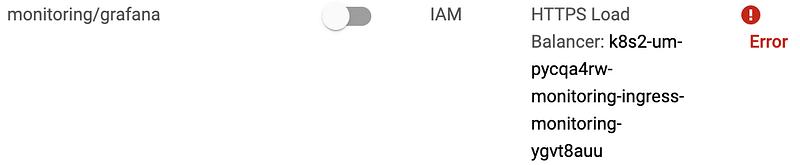
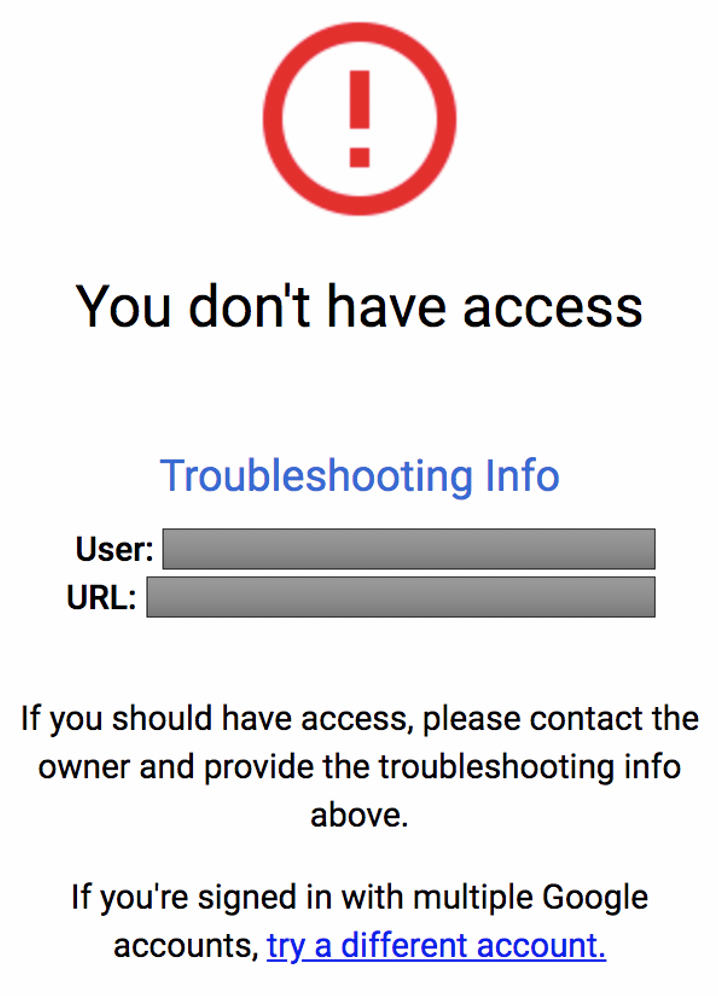
Click on the IAP toggle button to turn on IAP. At this point, if you attempt to access Grafana over the Internet, you will be asked to authenticate with your Google credentials and be subsequently denied access:
In order to provide access, you must configure IAP settings and add members to your Grafana app. Click on the checkbox on the Grafana backend service, and a panel should appear on the right. Click add member and give IAP-secured Web App User role to users to access Grafana.
Once the Status turns from Error to Warning (it warns about internal firewall rules that can bypass IAP controls), you should now be able to access Grafana on the Internet after logging in with your Google account.
Wrapping Up
While IAP provides an excellent alternative solution to using VPN or bastion hosts to lock down access to internal apps, it does present some challenges:
- It’s not possible to fully-automate this setup process (i.e. OAuth consent screen setup, generating client IDs and redirect URIs, etc)
- Using IAP in hybrid cloud settings is a bit more complicated (although there’s an excellent video on how Airbnb does it here)
Overall, in this series, we looked at setting up a more production-ready monitoring stack using popular open-source tools. As the shift to cloud and cloud-native architectures continue to mature, scalable observability will be in more demand.
For more resources, check out:
To read other posts in these series:


