The provided context discusses an analysis of NVIDIA's stock using a 14–20 RSI-BB Algo-Trading strategy to evaluate potential trading signals, employing Python for implementation.
Abstract
The web content delves into the technical analysis of NVIDIA's stock by employing the 14–20 RSI-BB Algo-Trading strategy, which integrates the Relative Strength Index (RSI) and Bollinger Bands (BB) to identify trading signals. The RSI gauges the momentum of price movements, while BB reflects the volatility. The analysis uses historical data obtained via an API call to TwelveData within a Python script. It calculates and visualizes both the RSI and BB, providing insights into overbought or oversold conditions and the likelihood of significant price moves, thereby guiding potential buying or selling decisions. The combined indicators are expected to enhance the accuracy of the trading signals. According to the latest data and interpretations, the algorithm suggests a neutral stance on NVIDIA's stock, aligning with technical indicators from Barchart and TradingView.
Opinions
The author suggests that the combination of RSI with BB can more effectively identify market reversals and improve trading strategies.
There is an emphasis on the importance of utilizing the RSI in trending market conditions rather than in sideways markets.
The content suggests that the current Bollinger Bands indicate a relative supply and demand equilibrium for NVIDIA stock, implying a SELL signal according to the Barchart opinion and the TradingView technical summary.
The RSI index, as of the latest reading on Apr 09, 2024, indicates a neutral momentum, suggesting a HOLD signal, which contrasts with the SELL signal from the BB analysis.
The author recommends using the proposed RSI-BB Algo-Trading strategy as practical technical drivers to evaluate NVIDIA's current risk-adjusted performance and sustainability in the future.
The objective of this post is to carry out the NVIDIA technical analysis by invoking the 14–20 RSI-BB Algo-Trading algorithm.
Bollinger Bands (BB) typically use a 20-day moving average (MVA). By default, the upper and lower bands are set 2*STDEV above and below MVA.
When the market is quiet, BB contract and when the market is LOUD, the bands expand.
When BB tighten during a period of low volatility, it raises the likelihood of a sharp price move in either direction. This may begin a trending move. Watch out for a false move in opposite direction which reverses before the proper trend begins.
The Relative Strength Index (RSI) is a well versed momentum based oscillator which is used to measure the speed as well as the change (magnitude) of directional price movements. Essentially RSI provides a visual mean to monitor both the current, as well as historical, strength and weakness of a particular market.
The RSI is most typically used on a 14-day timeframe, measured on a scale from 0 to 100.
Utilizing BB with RSI can aid in identifying reversals more effectively. This strategy entails waiting for the RSI to indicate overbought or oversold conditions while ensuring that the price is beyond the Bollinger Bands before considering an entry.
Let’s gain a deeper insight into the RSI-BB Algo-Trading algorithm in Python.
Input Stock Data
Importing basic libraries
import pandas as pd
import matplotlib.pyplot as plt
import numpy as np
import requests
from termcolor import colored as cl
from math import floor
# Import seabornimport seaborn as sns
plt.style.use('fivethirtyeight')
plt.rcParams['figure.figsize'] = (20,10)
#Calculate relative strength of stock in time period (days)defcalculate_relative_strength(data, time_period):
#set date as index
data = data.set_index(data['Date'])
#create delta
delta = data['close'].diff(1)
#create gains and loss variables
up = delta.copy()
down = delta.copy()
#conditional to set delta gain
up[up < 0] = 0
down[down > 0] = 0#get average of gains
AVG_gain = up.rolling(window = time_period).mean()
#get average of loss
AVG_loss = abs(down.rolling(window = time_period).mean())
return (AVG_gain, AVG_loss)
#Calculates RSIdefcalculate_RSI(AVG_gain, AVG_loss):
# Calculate relative strength
RS = AVG_gain/AVG_loss
#Calculate relative strength index
RSI = 100.0-(100.0/(1.0+RS))
return RSI
#Plot RSI defplot_RSI(RSI, tick_symbol):
#set plot sizes
plt.figure(figsize=(18,8))
#plot RSI values against date index
plot = sns.lineplot(x = RSI.index, y = RSI.values)
plot.set_title("RSI: " + tick_symbol)
plot.set_ylabel('Relative Strength Index')
#plot all levels in RSI
plot.axhline(30, color = 'green')
plot.axhline(70, color = 'green')
plot.axhline(20, color = 'yellow')
plot.axhline(80, color = 'yellow')
plot.axhline(10, color = 'red')
plot.axhline(90, color = 'red')
#Get the last/current RSI
data = RSI.tail(1)
#If greater than 70, display "Sell"if data.values > 70:
for x,y inzip(data.index,data.values):
label = "Sell"
plt.annotate(label, # this is the text
(x,y), # this is the point to label
textcoords="offset points", # how to position the text
xytext=(0,10), # distance from text to points (x,y)
ha='center',
fontsize = 25) # horizontal alignment can be left, right or center
plt.scatter(data.index, data.values,label = 'Sell', marker = 'v', color = 'red', alpha = 1, s = 100) #plot scatter on RSI plot#If less than 30, display "Buy"elif data.values < 30:
for x,y inzip(data.index,data.values):
label = "Buy"
plt.annotate(label, # this is the text
(x,y), # this is the point to label
textcoords="offset points", # how to position the text
xytext=(0,10), # distance from text to points (x,y)
ha='center',
fontsize = 25) # horizontal alignment can be left, right or center
plt.scatter(data.index, data.values, label = 'Buy', marker = '^', color = 'green', alpha = 1, s = 100) #plot scatter on RSI plot#Combine all smaller elements to single functiondefRSI(data, tick_symbol, time_period):
gain, loss = calculate_relative_strength(data, time_period)
RSI = calculate_RSI(gain, loss)
plot_RSI(RSI, tick_symbol)
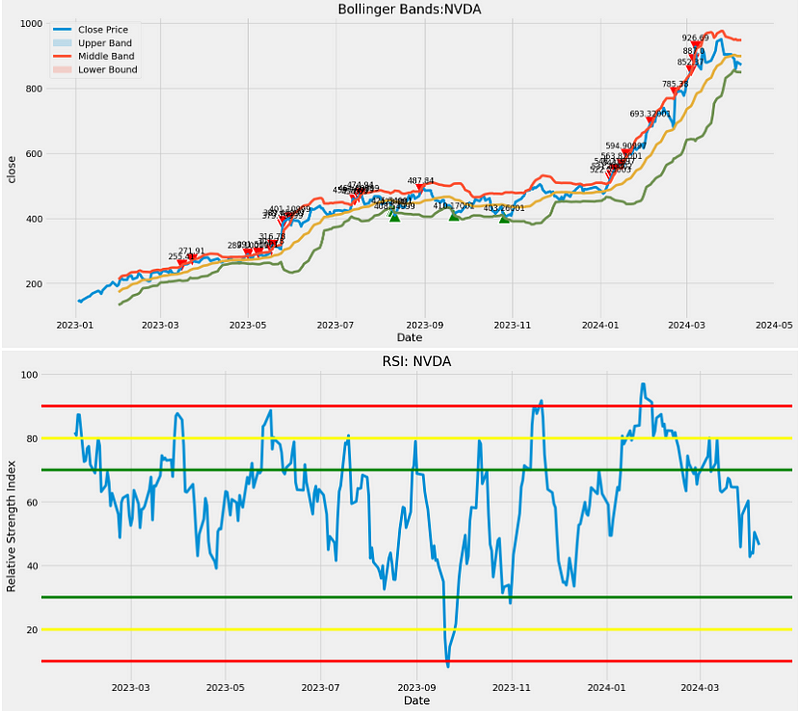
RSI Support/Resistance Lines:

Color       min/max

green       30, 70
yellow      20, 80
red         10, 90
The top chart suggests current SELL signal consistent with the Barchart opinion based on the 20 Day Bollinger Bands. This observation is also supported by the TradingView summary of NVIDIA based on the most popular technical indicators.
In contrast, the RSI index based on a 14-day time frame suggests HOLD because the latest readings are in a neutral momentum zone [30,70], indicating strong momentum.
Conclusions
BB indicate the relative supply and demand for NVIDIA. If NVIDIA price moves close to the top of the interval then it indicates that there is strong demand for the asset, alternatively if NVIDIA hugs the bottom of the trading range then it indicates that there is oversupply of the asset.
The resulting NVDA RSI is a value that measures momentum, oscillating between “oversold” and “overbought” on a scale of zero to 100.
As of Apr 09, 2024, 12:28 PM, NVDA RSI is 53.39, creating a Neutral signal (cf. TR).
We recommend employing proposed practical technical drivers to examine NVIDIA’s current risk adjusted performance to make sure the company can sustain itself at some point in the future.