
Deploying Streamlit Stock Fundamental Analysis App — NVIDIA Example

- Today we will walk through the streamlit stock fundamental analysis app based on the published tutorial and open-source code.
- Referring to our recent study, the NVIDIA’s AI-powered earnings and revenues remain our key focus area that falls under the umbrella of fintech.
- Indeed, as US Tech stocks continue to set new high after new high, many investors are questioning whether we have reached “bubble” territory. There has been debate over whether the current valuations are justified, whether the impressive earnings growth can persist.
- Let’s delve into the specifics of the streamlit application itself.
- Copying the CSS style file to the working directory YOURPATH.
- Installing the required libraries
!pip install streamlit, yfinance
- Creating the following Python script stockapp.py in YOURPATH
# importing required libraries
import streamlit as st
import yfinance as yf
from datetime import datetime
# function calling local css sheet
def local_css(file_name):
with open(file_name) as f:
st.sidebar.markdown(f'<style>{f.read()}</style>', unsafe_allow_html=True)
# local css sheet
local_css("style.css")
st.sidebar.subheader("""Stock Search Web App""")
selected_stock = st.sidebar.text_input("Enter a valid stock ticker...", "GOOG")
button_clicked = st.sidebar.button("GO")
if button_clicked == "GO":
main()
def main():
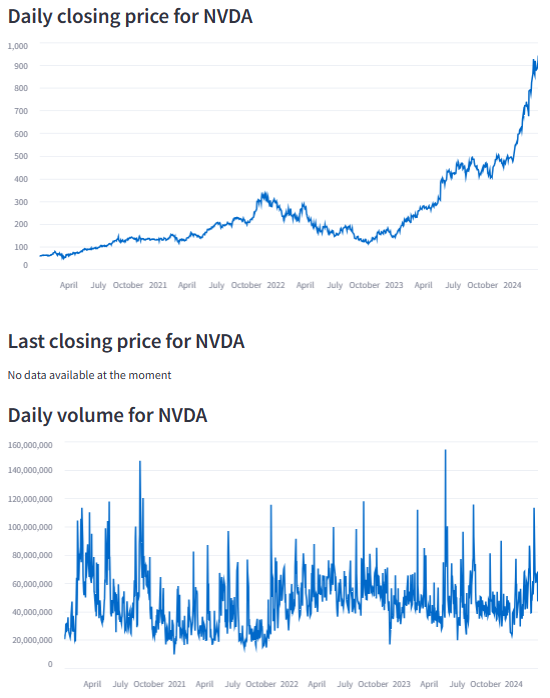
st.subheader("""Daily **closing price** for """ + selected_stock)
# get data on searched ticker
stock_data = yf.Ticker(selected_stock)
# get historical data for searched ticker
stock_df = stock_data.history(period='1d', start='2020-01-01', end=None)
# print line chart with daily closing prices for searched ticker
st.line_chart(stock_df.Close)
st.subheader("""Last **closing price** for """ + selected_stock)
# define variable today
today = datetime.today().strftime('%Y-%m-%d')
# get current date data for searched ticker
stock_lastprice = stock_data.history(period='1d', start=today, end=today)
# get current date closing price for searched ticker
last_price = (stock_lastprice.Close)
# if market is closed on current date print that there is no data available
if last_price.empty == True:
st.write("No data available at the moment")
else:
st.write(last_price)
# get daily volume for searched ticker
st.subheader("""Daily **volume** for """ + selected_stock)
st.line_chart(stock_df.Volume)
# additional information feature in sidebar
st.sidebar.subheader("""Display Additional Information""")
# checkbox to display stock actions for the searched ticker
actions = st.sidebar.checkbox("Stock Actions")
if actions:
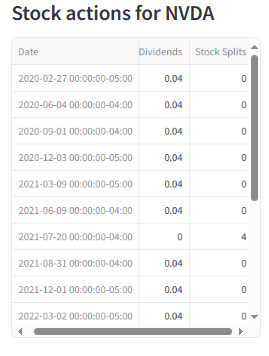
st.subheader("""Stock **actions** for """ + selected_stock)
display_action = (stock_data.actions)
if display_action.empty == True:
st.write("No data available at the moment")
else:
st.write(display_action)
# checkbox to display quarterly financials for the searched ticker
financials = st.sidebar.checkbox("Quarterly Financials")
if financials:
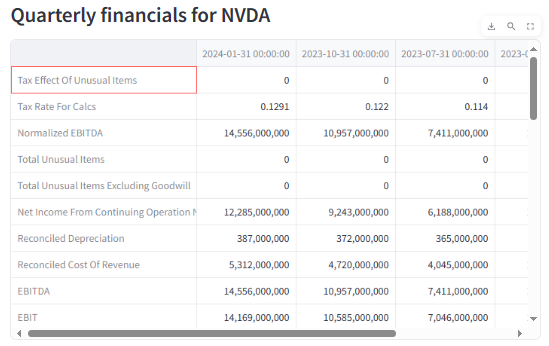
st.subheader("""**Quarterly financials** for """ + selected_stock)
display_financials = (stock_data.quarterly_financials)
if display_financials.empty == True:
st.write("No data available at the moment")
else:
st.write(display_financials)
# checkbox to display list of institutional shareholders for searched ticker
major_shareholders = st.sidebar.checkbox("Institutional Shareholders")
if major_shareholders:
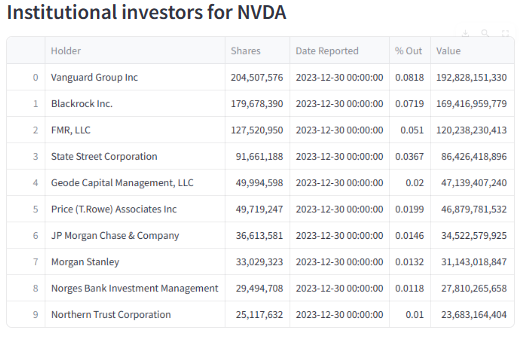
st.subheader("""**Institutional investors** for """ + selected_stock)
display_shareholders = (stock_data.institutional_holders)
if display_shareholders.empty == True:
st.write("No data available at the moment")
else:
st.write(display_shareholders)
# checkbox to display quarterly balance sheet for searched ticker
balance_sheet = st.sidebar.checkbox("Quarterly Balance Sheet")
if balance_sheet:
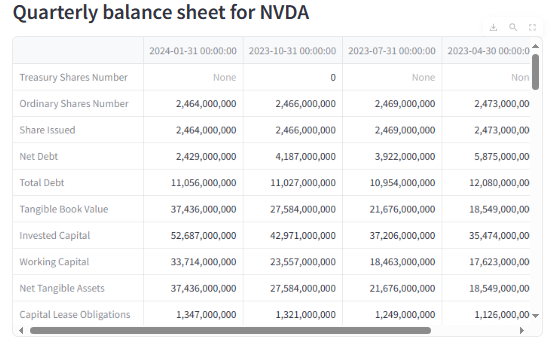
st.subheader("""**Quarterly balance sheet** for """ + selected_stock)
display_balancesheet = (stock_data.quarterly_balance_sheet)
if display_balancesheet.empty == True:
st.write("No data available at the moment")
else:
st.write(display_balancesheet)
# checkbox to display quarterly cashflow for searched ticker
cashflow = st.sidebar.checkbox("Quarterly Cashflow")
if cashflow:
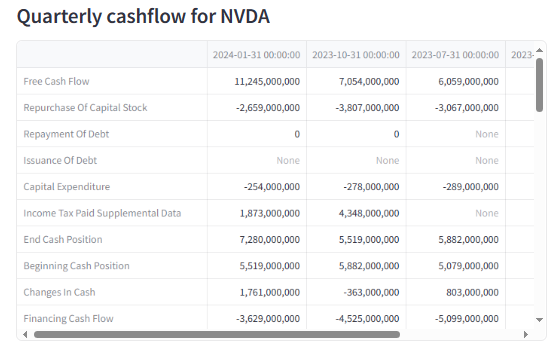
st.subheader("""**Quarterly cashflow** for """ + selected_stock)
display_cashflow = (stock_data.quarterly_cashflow)
if display_cashflow.empty == True:
st.write("No data available at the moment")
else:
st.write(display_cashflow)
# checkbox to display quarterly earnings for searched ticker
earnings = st.sidebar.checkbox("Quarterly Earnings")
if earnings:
st.subheader("""**Quarterly earnings** for """ + selected_stock)
display_earnings = (stock_data.quarterly_earnings)
if display_earnings.empty == True:
st.write("No data available at the moment")
else:
st.write(display_earnings)
# checkbox to display list of analysts recommendation for searched ticker
analyst_recommendation = st.sidebar.checkbox("Analysts Recommendation")
if analyst_recommendation:
st.subheader("""**Analysts recommendation** for """ + selected_stock)
display_analyst_rec = (stock_data.recommendations)
if display_analyst_rec.empty == True:
st.write("No data available at the moment")
else:
st.write(display_analyst_rec)
if __name__ == "__main__":
main() - Running the above script from the cmd prompt as follows
streamlit run stockapp.py
- Follow the link below
You can now view your Streamlit app in your browser.

  Local URL: http://localhost:<Your Local Host ID>
Network URL: http://<The Full IP Address>- The following context menu should appear to the left side in Windows 10
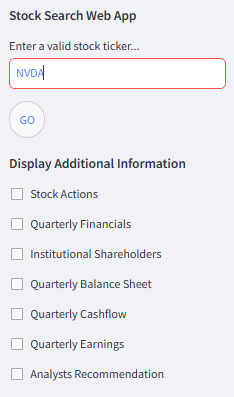
- Let’s enter NVDA and click GO. The following plot should appear to the right side in Windows 10
- Click on “Stock Actions”
- Click on “Quarterly Financials”
- Click on “Institutional Shareholders”
- Click on “Quarterly Balance Sheet”
- Click on “Quarterly Cashflow”
- This quick demo shows that the proposed streamlit UI provides easy-to-follow access to real-time financial data via yfinance.
Conclusion
- Today we have demonstrated how to build and launch the Stock Search Web App.
- We have used this App to examine the latest NVDA stock price and financial health.
- Next steps will focus on the implementation of “Quarterly Earnings” and “Analysts Recommendation”.
References
- Streamlit: Simplifying Stock Price Analysis
- An Algo-Trading Sneak Peek at Top AI-Powered Growth Stocks — 1. NVIDIA
- Streamlit — A faster way to build and share data apps.
- Tech Earnings Continue To Deliver
- Nvidia’s AI-Powered Earnings, Revenue, and Guidance Easily Exceed Expectations…Again
Explore More
- Datapane Stock Screener App from Scratch
- Plotly Dash TA Stock Market App
- The $ASML Trading Strategies via the Plotly Stock Market Dashboard
- An Implemented Streamlit Crop Prediction App
- NVIDIA Rolling Volatility: GARCH & XGBoost
- NVIDIA Returns-Drawdowns MVA & RNN Mean Reversal Trading
- Dividend-NG-BTC Diversify Big Tech
- IQR-Based Log Price Volatility Ranking of Top 19 Blue Chips
- Blue-Chip Stock Portfolios for Quant Traders
- Multiple-Criteria Technical Analysis of Blue Chips in Python


