
Streamlit: Simplifying Stock Price Analysis

Streamlit facilitates real-time tracking of stock prices and the visualization of historical data, providing finance professionals and investors with valuable insights. Moreover, it allows for the creation of advanced charts and visualizations for data analysis and trend identification. This empowers investors to make more informed financial decisions.
In this project, it’s aimed to create a simple web application that provides quick and user-friendly access to financial data. By using the Streamlit framework and integrating the yfinance library, we will develop a tool that allows users to easily view both the current and historical data of stocks. This application can be used to expedite financial analysis for investors and finance professionals, aiding them in making informed investment decisions. Throughout the project, we will proceed step by step to learn how to build the web application and enable users to access financial data effortlessly.
Let’s get started by importing necessary libraries, sets up a function to apply local CSS styles, and then applies the “style.css” stylesheet to a Streamlit sidebar using the local_css function.
# importing required libraries
import streamlit as st
import yfinance as yf
from datetime import datetime


# function calling local css sheet
def local_css(file_name):
    with open(file_name) as f:
        st.sidebar.markdown(f'<style>{f.read()}</style>', unsafe_allow_html=True)


# local css sheet
local_css("style.css")
The mentioned css code customizes the appearance of a web page created using Streamlit. It sets the background to white with black text for the entire page, styles buttons to be circular with blue text, and changes the text color to blue for text input fields, enhancing the visual design of the user interface.
body {
    color: rgb(0, 0, 0);
    background-color: rgb(255, 255, 255);
}

.stButton>button {
    color: #4F8BF9;
    border-radius: 50%;
    height: 3em;
    width: 3em;
}

.stTextInput>div>div>input {
    color: #4F8BF9;
}
It creates a stock ticker search feature in the sidebar of a Streamlit web application. It displays a subheader “Stock Search Web App,” provides a text input field for the user to enter a valid stock ticker (defaulting to “GOOG”), and a “GO” button. When the “GO” button is clicked, it triggers the main() function to retrieve and display stock data for the entered ticker symbol.
st.sidebar.subheader("""Stock Search Web App""")
selected_stock = st.sidebar.text_input("Enter a valid stock ticker...", "GOOG")
button_clicked = st.sidebar.button("GO")
if button_clicked == "GO":
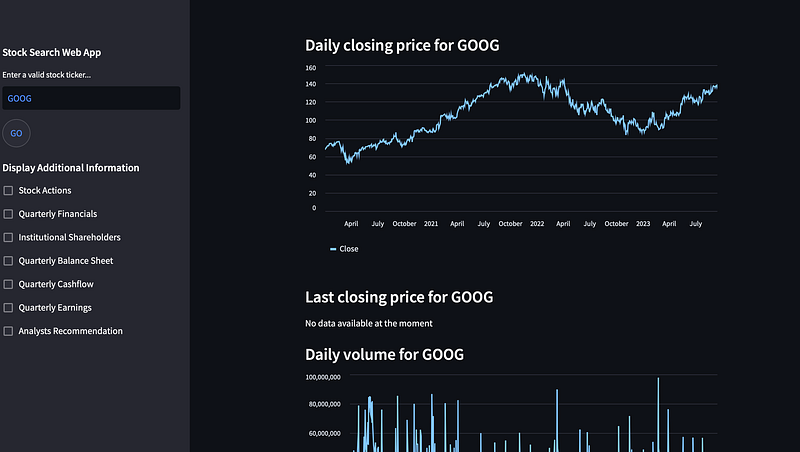
main()Now, if you are ready, I will tell you the most crucial point of the work. This code section defines a Streamlit web application featuring a clean and user-friendly interface for exploring stock data. The main() function displays the daily closing price, last closing price, and daily trading volume of a selected stock.
Users can access additional information by checking various checkboxes in the sidebar, including stock actions, quarterly financials, institutional shareholders, quarterly balance sheet data, quarterly cashflow data, quarterly earnings data, and analysts' recommendations. The application utilizes Streamlit to provide an interactive and informative stock analysis tool.
def main():
    st.subheader("""Daily **closing price** for """ + selected_stock)
    # get data on searched ticker
    stock_data = yf.Ticker(selected_stock)
    # get historical data for searched ticker
    stock_df = stock_data.history(period='1d', start='2020-01-01', end=None)
    # print line chart with daily closing prices for searched ticker
    st.line_chart(stock_df.Close)

    st.subheader("""Last **closing price** for """ + selected_stock)
    # define variable today
    today = datetime.today().strftime('%Y-%m-%d')
    # get current date data for searched ticker
    stock_lastprice = stock_data.history(period='1d', start=today, end=today)
    # get current date closing price for searched ticker
    last_price = (stock_lastprice.Close)
    # if market is closed on current date print that there is no data available
    if last_price.empty == True:
        st.write("No data available at the moment")
    else:
        st.write(last_price)

    # get daily volume for searched ticker
    st.subheader("""Daily **volume** for """ + selected_stock)
    st.line_chart(stock_df.Volume)

    # additional information feature in sidebar
    st.sidebar.subheader("""Display Additional Information""")
    # checkbox to display stock actions for the searched ticker
    actions = st.sidebar.checkbox("Stock Actions")
    if actions:
        st.subheader("""Stock **actions** for """ + selected_stock)
        display_action = (stock_data.actions)
        if display_action.empty == True:
            st.write("No data available at the moment")
        else:
            st.write(display_action)

    # checkbox to display quarterly financials for the searched ticker
    financials = st.sidebar.checkbox("Quarterly Financials")
    if financials:
        st.subheader("""**Quarterly financials** for """ + selected_stock)
        display_financials = (stock_data.quarterly_financials)
        if display_financials.empty == True:
            st.write("No data available at the moment")
        else:
            st.write(display_financials)

    # checkbox to display list of institutional shareholders for searched ticker
    major_shareholders = st.sidebar.checkbox("Institutional Shareholders")
    if major_shareholders:
        st.subheader("""**Institutional investors** for """ + selected_stock)
        display_shareholders = (stock_data.institutional_holders)
        if display_shareholders.empty == True:
            st.write("No data available at the moment")
        else:
            st.write(display_shareholders)

    # checkbox to display quarterly balance sheet for searched ticker
    balance_sheet = st.sidebar.checkbox("Quarterly Balance Sheet")
    if balance_sheet:
        st.subheader("""**Quarterly balance sheet** for """ + selected_stock)
        display_balancesheet = (stock_data.quarterly_balance_sheet)
        if display_balancesheet.empty == True:
            st.write("No data available at the moment")
        else:
            st.write(display_balancesheet)

    # checkbox to display quarterly cashflow for searched ticker
    cashflow = st.sidebar.checkbox("Quarterly Cashflow")
    if cashflow:
        st.subheader("""**Quarterly cashflow** for """ + selected_stock)
        display_cashflow = (stock_data.quarterly_cashflow)
        if display_cashflow.empty == True:
            st.write("No data available at the moment")
        else:
            st.write(display_cashflow)

    # checkbox to display quarterly earnings for searched ticker
    earnings = st.sidebar.checkbox("Quarterly Earnings")
    if earnings:
        st.subheader("""**Quarterly earnings** for """ + selected_stock)
        display_earnings = (stock_data.quarterly_earnings)
        if display_earnings.empty == True:
            st.write("No data available at the moment")
        else:
            st.write(display_earnings)

    # checkbox to display list of analysts recommendation for searched ticker
    analyst_recommendation = st.sidebar.checkbox("Analysts Recommendation")
    if analyst_recommendation:
        st.subheader("""**Analysts recommendation** for """ + selected_stock)
        display_analyst_rec = (stock_data.recommendations)
        if display_analyst_rec.empty == True:
            st.write("No data available at the moment")
        else:
            st.write(display_analyst_rec)


if __name__ == "__main__":
    main()
Now, we proceed to examine our web application by running it with the command streamlit run st_stocks2.py(my file name, it depends on your pc).
Below is the home page image of our web application. There is only stock action, of course it can be developed for other options.
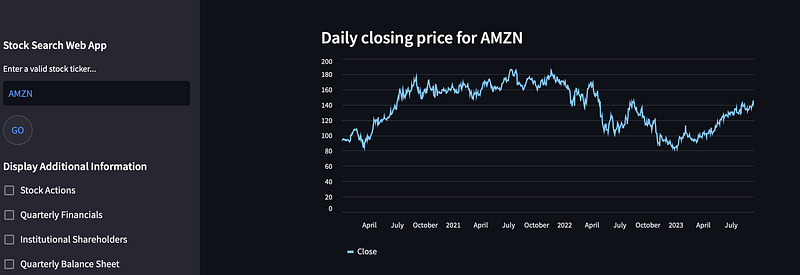
AMZN
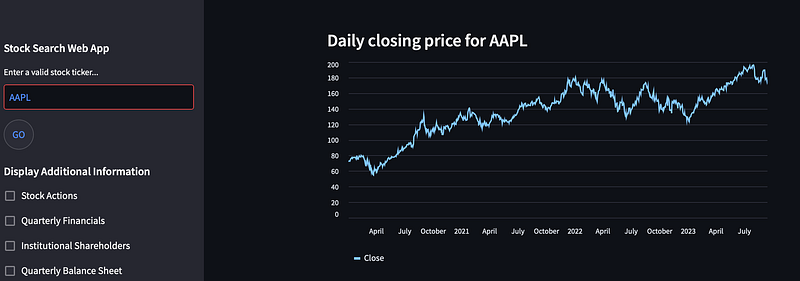
AAPL
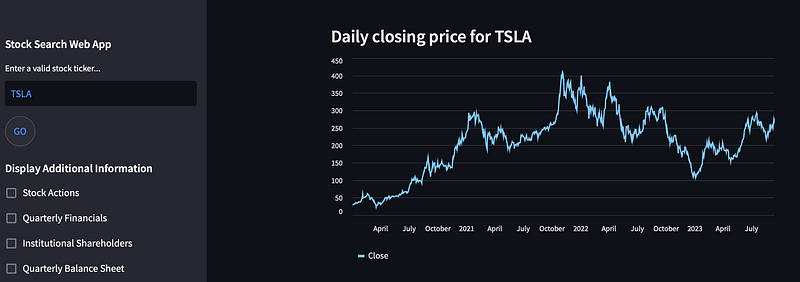
TSLA
As a result of our project, we have developed a simple web application that provides quick and user-friendly access to financial data. Through the use of the Streamlit framework and integration of the yfinance library, users can easily view both current and historical data of stocks. This application can be used by investors and finance professionals to expedite financial analysis and make informed investment decisions. Thanks to its user-friendly interface, accessing financial data is now simpler and faster. We believe that this project serves as a foundation for future developments and additional features.
If you would like to see more content related to my journey in data science, you can follow me on the following platforms.
linkedin.com/in/ali-kaan-erden-3725b719b
github.com/kaanerdenn
#datascience #streamlit #webapplication


