
Machine Learning for Complete Beginners. Introduction.
A comprehensive guide to starting practicing Machine Learning (ML) in Python for complete beginners with hands-on examples. Learn ML and Upgrade yourself from a complete beginner → to a ML-practitioner. Explaining the basics, motivation, and tools for Machine Learning.

Intro
Hi there! A while ago, I have been talking to a friend and the topic touched on Machine Learning. And by the end of the conversation, I concluded that many people have some prejudice against the whole topic of “intellectual machines”, or even might be afraid to start the learning process due to the overwhelming amount of information. So,
I decided to break the ice for everyone who is just starting out on this journey of mastering the Machine Learning.
Let us be clear — Machine Learning is not Magic. Machine Learning (so-called ML) is the study of computer algorithms that improve automatically through experience. Generally speaking, ML is a subfield of computer science, and it is highly connected to Data Science. These fields combine mathematical, computing, statistical, and presenting skills. That is a form of logic and structure.
In this series of tutorials, I will help you to dive into the Machine Learning field. With all of the great developments and the variety of information in this field, it might be extremely difficult to actually start if you are a complete beginner. So, I decided to create a short series of lessons for everyone passionate about ML.
The main idea here, is to explain things in a simple language so even a child could understand it and start practicing Machine Learning (yes, we are all children inside our hearts, right?).
In this part, we will briefly cover the reasons for learning ML, go through general terms/definitions, explore which common Python libraries are used for Data Science and Machine Learning, and load our first dataset!
In other words, we are preparing ourselves for the Machine Learning journey.
Why Machine Learning?
Machines are great workers but they are generally dumb. Because they do only, and the only task the programmers/engineers tell them to do. No less and no more than the given instructions to follow, or explicit steps to take.
For simple tasks, it is easier to program a machine to do its job well. But for complex problems that involve many steps, it is not a trivial task.
What if machines could actually learn on their own, without being explicitly programmed to do so? This question is also the answer to why this field is so popular. Especially, nowadays, when the computational power is enough to transform some of the ideas into real life.
To sum up, Machine Learning is the branch of Artificial Intelligence that covers the statistical part of it. It teaches the computer to solve problems by looking at hundreds (or thousands) of examples, learning from them, and then using that experience to solve the same problem in new situations.
I hope that this satisfies your curiosity. As I value both my and your time, I would like to move on, and start with the actual hands-on examples.
But first thing first.
To be sure we are all on the same page, let us briefly go through the common terms and definitions used in the fields of Data Science and Machine Learning.
Useful Terminology
The whole work here revolves around data. Everything around us is some form of data: text (including what you are reading right now), sounds, images, videos, etc.
Data is usually observed, collected, and stored in form of the data sets. We can imagine a general form of a dataset as a matrix (or a table) if you will. Where the columns representing observables (features) and the raws representing the observations (instances). As you can see in the following image:
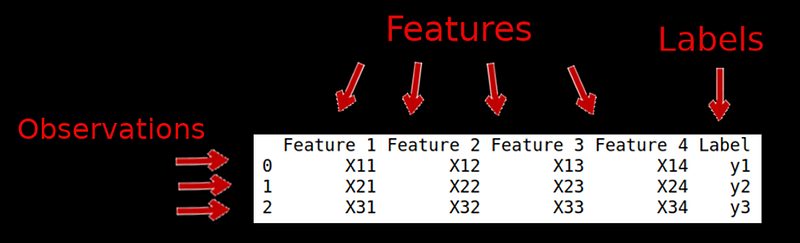
- There are several names for the input values (X). These names are basically analogous:
inputs = features = attributes = independent variables
Note: the name independent variable implies that these features do not affect each other, and independently affect the outputs on their own. Generally speaking, these are the inputs to a function.
- A similar description goes for the output values (y). They have several names:
outputs = labels = dependent variable
Note: the name dependent variable implies that these values depend on the other variable(s). Generally speaking, it is an output of a function.
- The raws are called
observationsorinstancesof the data. There is also one simple formula:
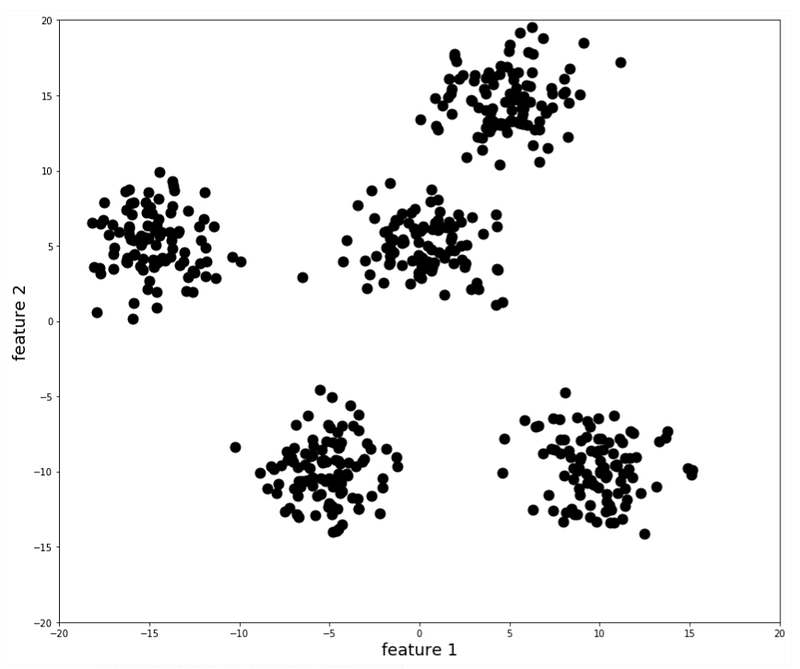
Number of Features = Dimension of DatasetHence, if the data set has only 2 features, it can be shown as the 2-dimensional (2D) distribution. For example, it can look like that:
And, finally, the shape of the dataset is basically, the shape of the matrix. In other words, a multiplication of the number of observations (instances) by the number of features (dimensions).
So, how do we connect these definitions to the actual process of ML analysis?
The idea is to use a set of features (X) as an input into our Machine Learning model to predict the output (y).
I believe that the best way to progress is through practice, so this initial amount of theory should be enough to get us started. The next natural question would be how do we actually do the modeling in practice? Before we talk about that, let us briefly touch on a very important topic of Python libraries.
Which Python library to use?
As you know, Python is a powerful and popular general-purpose programming language. And here is the best part, Python is developed under an OSI-approved open source license, making it freely usable and distributable, even for commercial uses.
If you are just starting out with Python in general, please check out this brief Python tutorial from “Hello World” to Functions. It will help later on.
Side Note: Open source licenses are licenses that comply with the Open Source Definition — in brief, they allow the software to be freely used, modified, and shared. To be approved by the Open Source Initiative (also known as the OSI), a license must go through the Open Source Initiative’s license review process. Reference to this definition is here.
Also, its libraries and modules are free to use. That means, some people develop the modules and everybody around the world can use them. Isn’t it great?
The main takeaway from here is that:
there are many libraries and modules already implemented in Python which would make our life so much easier.
And here is a list of the Python modules we need to know to work in Data Science and practice Machine Learning:
- NumPy — this Python library supports large, multi-dimensional (N-dimensional) arrays and matrices, along with a large collection of high-level mathematical functions to operate on these arrays. You need to know NumPy if you work with arrays, dictionaries, functions, data types, and images as well. Because images are basically arrays of numbers.
- SciPy — this library is good for scientific, technical, and high-performance computing. SciPy is a collection of numerical algorithms and domain-specific toolboxes, including linear algebra, integration, optimization, signal processing, statistics, and more!

- Matplotlib — this is one of the most popular plotting Python libraries. It has capabilities for plotting 2D and 3D images, figures, and graphs. It is a great library to know. Of course, there is seaborn, for example, that specializes more in statistical visualizations that make it quite popular in Data Science. However, even with Matplotlib, which is oriented more towards basic visualizations (lines, scatter plots, bars, pies, etc.), we can get a number of pretty visuals.
- Pandas — this library is a fast, flexible, and easy to use open-source data analysis and manipulation tool. It is a high-level Python library as it is built on top of it. Pandas provides high-performance easy to use data structures. If you are doing or want to do Data Science, this library is a must because it has many functions for data importing, manipulation and analysis. Notably, it offers data structures and operations for manipulating numerical tables and time-series.
- SciKit Learn — this library is a collection of simple and efficient tools for predictive data analysis and Machine Learning. SciKit Learn (or so-called sklearn) is very popular among data scientists. It has most of the regression, classification, and clustering algorithms, and it is built on top of NumPy, SciPy, and Matplotlib libraries. As I mentioned earlier, data does not come all clean and tidy on a silver plate. In real-world data is messy and needs to be preprocessed. In general, data preprocessing is a very big part of Data Science. Luckily for us, SciKit Learn has many implemented tasks for Data Science and Machine Learning. That includes data preprocessing, feature selection and extraction, train-test splitting, defining the algorithms, fitting models, evaluation, prediction, and more.

In this series of tutorials, we will go through the SciKit Learn algorithms with hands-on examples. My main idea is to describe and explain what is going on under the hood of each above-mentioned algorithm so even a child would be able to understand that.
So, let us begin our hands-on examples.
Datasets in Python
Now, as we have an idea about ML and an overview of the Python libraries needed to get started with ML, let us start our hands-on examples. We are going to use Pandas library a lot starting from here.
Getting Dataset
In principle, you should get your own data set from the real-world. However, this is a tutorial, so we will suppose that we have done all the work: went out to the wild, collected the data, and put it into a dataset. To make our life easier, let us simply go to the Machine Learning Repository to get a dataset.
Let us pick up, for the sake of example, the dataset of different kinds of mushrooms.
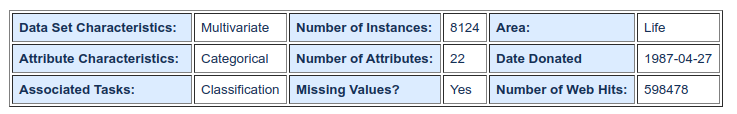
Dataset Summary
We can immediately see that this is a categorical dataset, so the preferable model to apply would be classification. The number of instances in this dataset is 8124, the number of attributes is 22. After going through this tutorial, you should be able to recognize these terms, right?
Dataset Information
From this website we can find the labels: This data set includes descriptions of hypothetical samples corresponding to 23 species of gilled mushrooms in the Agaricus and Lepiota Family (pp. 500–525). Each species is identified as definitely edible, definitely poisonous, or of unknown edibility and not recommended. This latter class was combined with the poisonous one. The Guide clearly states that there is no simple rule for determining the edibility of a mushroom; no rule like “leaflets three, let it be” for Poisonous Oak and Ivy.
Attribute Information
There you can see a list of all 22 features, such as cap-shape, cap-surface, cap-color, odor, and so on. These are all independent variables that describe our mushroom dataset.
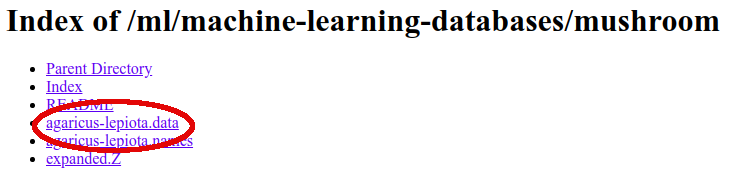
How to Open this Dataset?
To download this dataset, we simply download a .data file that is a CSV file (or comma-separated file).
Then, either in Python script or Jupyter Notebook we import Pandas library and use it to open this dataset:
import pandas as pdAs I mentioned earlier, Pandas is a top-level Python library. Opening a CSV table is as simple as using its method read_csv():
data = pd.read_csv('agaricus-lepiota.data')To see the first 5 raws of this dataset, we can use a head() method:
data.head()The output will be a data frame or a table if you will:
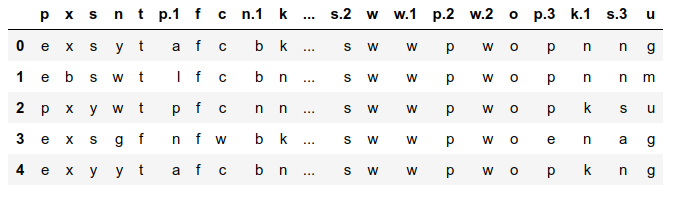
As we can see, something does not seem right. Initially, we do not have any header, so we can specify this as follows:
data = pd.read_csv('agaricus-lepiota.data', header = None)
data.head()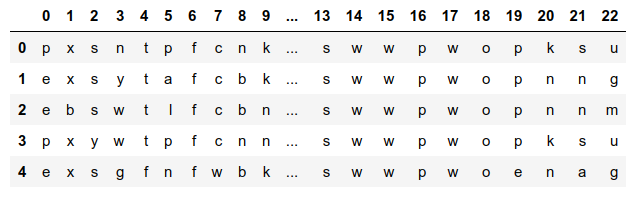
This time, it looks much better because we have a range of numbers from 0 to 22 (exactly a number of features). The problem is that we want to know what are those features.
We can manually add the names/values in the Pandas data frame with a .columns attribute. I have typed in all of the 22 feature names by hand because there was no other way of importing them easily.
# Let us manually add the features/columns names
data.columns = ['cap-shape', 'cap-surface', 'cap-color', \
                'bruises?', 'odor', 'gill-attachment',
                'gill-spacing' ,'gill-size', 'gill-color',
                'stalk-shape', 'stalk-root', 'stalk-surface-above-ring',
                'stalk-surface-below-ring', 'stalk-color-above-ring',
                'stalk-color-below-ring', 'veil-type', 'veil-color',
                'ring-number', 'ring-type', 'spore-print-color',
'population', 'habitat', 'class' ]data.head()The resulting data frame looks like this:
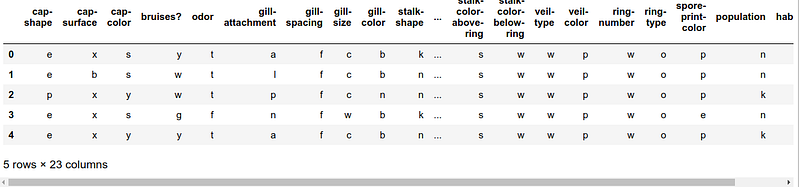
All of the 23 columns (22 features + class label) did not fit on the screen but you get an idea. In principle, we can start working with this dataset: preprocessing, cleaning, etc.
Pro Tip 1: To see more than 5 rows of the data frame, simply specify a number of rows in the
.head(n)method. Such as,data.head(10)to see the first 10 rows. For negative valuesn, this function returns all rows except the last n rows, such asdata.head(-7)returns all rows from 0 up to 7th element from the end.
Pro Tip 2: To see the elements from the back, use the analogous function, called
.tail().
What to do with this Dataset?
We can build a classification algorithm to train how to identify different types of mushrooms based on this mushroom dataset and then apply the trained model to unknown (or out-of-sample) cases to predict the mushroom type.
This might be useful, for example, if you are a mushroom-gatherer, or have access to a forest with lots of different mushrooms around. Or maybe something else.
The point is not in mushrooms but rather in the idea of building an algorithm to create a model that is able to predict the class/label of an unknown/new case. To sum up, this type of algorithm is a classification that is a supervised Machine Learning algorithm.
Conclusions
With this, we conclude this Introduction to a Machine Learning Guide. In the next tutorial, I will explain classification algorithms applied to real datasets. So, stay tuned.
Want to learn more?
As I mentioned earlier, here are a few of my projects that I explained from the beginning until the end. It can be a great opportunity to try to practice some of the Python skills to enhance your experience:
- tracking your weight from scratch in Python
- analyzing COVID-19 scientific papers
- creating a productivity app (Pomodoro) from scratch
Thank you for reading until the end. I hope you have learned something new. If you would like to connect, have any questions, suggestions, and/or found any error, please do not hesitate to contact me.
Are you curious about the emerging field of Prompt Engineering? Grab my new e-book! You will learn and master everything from fundamental concepts to practical tips and real-world applications. Additionally, you will receive a bonus of 300 prompts and some of the free resources to kick-start your AI-driven journey. With all this value packed into one e-book, what is the price? The cost of a cup of coffee! Do not miss out on this opportunity to take your skills to the next level!
Contact
I recently started a YouTube channel where I talk about different topics, including data science and AI news, research, and life in general among others. It is a steep learning curve for me but I invite you to check it out here.
Never miss a story, join my mailing list!