
How to Tell a Compelling Data Story: 16 techniques for Storytelling and UX Design Dashboard
Impactful Data Visualisation: A Showcase of Credit Risk Dashboard

Imagine sitting by a campfire, captivated by a story that transports you to another world, a story so vivid it feels like you’re living it. Now, what if I told you that data visualisation could have the same mesmerising effect? That’s right — the power of a good story, when combined with impactful data visualisation, can not only inform but also inspire, engage, and drive action.
Throughout my career, I’ve had the privilege to design and build over 100 dashboards and various data visualisations. Whether I’m delivering analytical models, complex risk assessments, customer analyses, market research, or business performance analysis reports, why? Because they breathe life into numbers and text, transforming them into insights and actionable recommendations that effectively support business decision-making.
Why Data Visualisation?
Data visualisation gives us the ability to quickly understand unstructured data, discover outliers, identify patterns, translate complex business concepts, and intuitively arrive at insights that might otherwise go unnoticed. It’s like giving your data a voice and allowing it to tell its own story.
Why a dashboard?
But why a focus on dashboards, you ask? Think of a dashboard as a one-page summary of everything you need to know. It’s like the blurb on the back of a novel that gives you just enough to pique your interest, while also giving you a comprehensive understanding of the plot. Dashboards offer a structured, holistic view of the data story you’re trying to tell. The dashboard serves multiple purposes, including reporting, business analysis, and financial assessment. It’s a versatile tool designed to meet various informational needs across different domains within the organisation.
Why UX design?
As a UX designer for dashboards, I can’t stress enough the importance of user-centric design. From the standpoint of UX design, every element — from layout and structure to visuals and colour schemes — plays a crucial role in telling your story. It’s not just about what the data shows; it’s about how you show it. Accessibility, usability, and aesthetics aren’t just buzzwords; they are the pillars that uphold the story you’re aiming to tell. A well-designed dashboard isn’t just visually pleasing; it’s also intuitive and user-friendly. Good UX design takes into account human behaviour and cognition, aiming to create an experience that’s not just functional but also meaningful.
Data visualisation tools
Your choice of tools should be guided by your project requirements, your existing skill set, and the level of complexity you need in your visualisations. Microsoft Excel offers a straightforward way to create basic charts and visualisations. However, for more advanced analytics and interactive dashboards, Power BI and Tableau stand as industry leaders. If you prefer Python, offers a wealth of libraries like Matplotlib, Seaborn, or Plotly to meet your data visualisation needs. If R is more your style, there are plenty of packages, such as ggplot2, lattice, and ggvis, to suit your needs. Of course, there are many other options available as well.
16 techniques to tell a compelling data story
Today, I’m going to share some tips and tricks that I’ve gained from my experience in creating user-friendly, storytelling dashboards. These dashboards do more than just display data; they also narrate a compelling story. To illustrate, I will demonstrate these techniques using a prototype dashboard that I built specifically for a bank’s risk management division. This dashboard focuses on Basel II requirements related to credit risk, delinquency, and Non performing Loan, among other factors. It incorporates both storytelling and UX design concepts and techniques and can be implemented and adapted across various platforms, such as Excel, PowerBI, and Tableau.
Analysis and Insights Takeaways for you
In a prior blog post, I highlighted how a professional data analyst transforms raw data into actionable business wisdom. The true value lies not merely in what the data indicates, but in its business contextual interpretation that drives informed decisions and foster innovative strategies. In the illustrations for Techniques 10, 11, and 12, I’ve integrated real-world credit risk analysis and insights. I believe there are important takeaways for you on how to streamline narratives, derive insights through analysis, and offer recommendations for addressing business issues, risks, and opportunities for improvement. Particularly if you work in risk management within the banking sector, you’ll find these insights invaluable. Let’s start the
Prototype Dashboard:
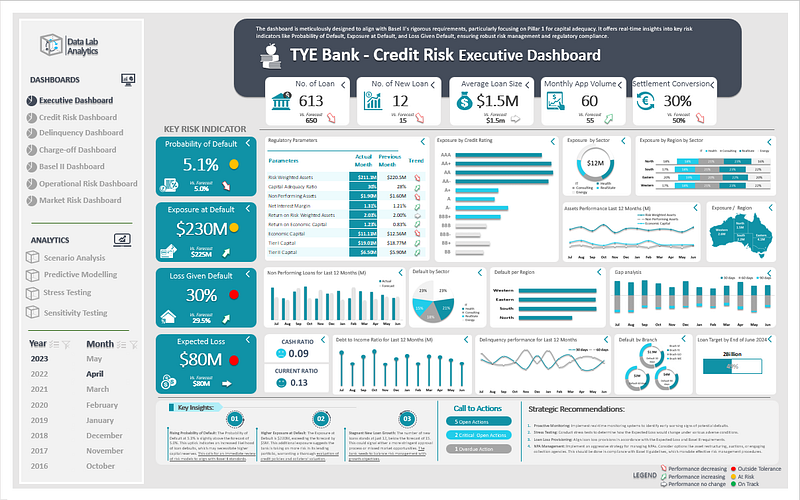
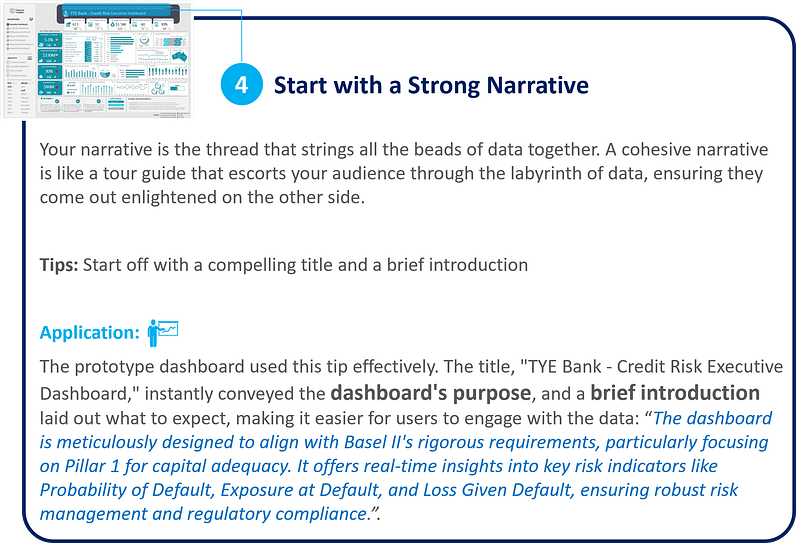
Illustration:

Illustration:

Illustration:

Illustration:

Illustration:

Illustration:

Illustrations:

Loan portfolio
- Number of Loans: We have 613 active loans against a forecast of 650. While this is under target, it might suggest a more stringent approval process, aligning with our conservative risk posture.
- Number of New Loans: Just 12 this month, against a forecast of 15. It’s vital to explore if we are missing market opportunities here.
- Average Loan Size: At $1.5 million, we are dealing with substantial figures that require meticulous risk analysis.
- Monthly App Volume and Settlement Conversion: Low application volume and a 30% conversion rate might be a sign to revisit our marketing and vetting strategies.
Recommendation: The lower number of new loans suggests that we may need to re-evaluate our marketing strategies or loan approval criteria. Given the average loan size, implementing advanced risk-assessment models compliant with Basel II can be beneficial.

Key Risk Indicators
1. Probability of Default (PD) — 5.1% vs Forecast 5.0%
Explanation: The Probability of Default at 5.1% indicates that, statistically, about 5.1 out of every 100 loans are expected to default. For a non-retail business division within a large bank, this is particularly concerning because the loans are generally of a larger size and have a more substantial impact on the bank’s portfolio. The slight increase from the forecasted 5.0% could indicate a growing risk in the portfolio or a change in the economic conditions affecting the clients.
Strategic Recommendations:
- Model Review: Revisit the risk assessment models to ensure they are capturing all the current market dynamics and client-related risks.
- Client Segmentation: Consider classifying business clients into different risk categories and tailor the loan terms and monitoring efforts accordingly.
- Capital Reserve: Increase the capital reserve slightly to align with the higher-than-forecasted PoD, as per Basel II Pillar 1 requirements.
2. Exposure at Default (ED) — $230M vs Forecast $225M
Explanation: Exposure at Default represents the total value at risk in the event of default. At $230M, the bank is exposed to $5M more than what was initially forecasted. While this could imply a robust lending business, it also signifies heightened risk.
Strategic Recommendations:
- Collateral Revaluation: Periodically revaluate the collateral against which loans have been extended to better manage the exposure.
- Portfolio Diversification: Consider diversifying the loan portfolio to mitigate risk concentrations.
- Limit Management: Introduce or tighten exposure limits for different sectors or business categories.
3. Loss Given Default (LGD) — 30% vs Forecast 29.5%
Explanation: The Loss Given Default is the portion of the asset that will be lost if a default occurs. For a non-retail business division, an LGD of 30% is significant as it translates to substantial financial losses in real terms.
Strategic Recommendations:
- Loan Structuring: Opt for loan structures that have protective covenants or higher collateral requirements.
- Recovery Strategies: Implement robust recovery strategies to minimize losses in case of default.
- Regular Audits: Undertake periodic audits to ensure that the risk mitigation mechanisms are effective and in line with Basel II standards.
4. Expected Loss (EL) — $80M vs Forecast $80M
Explanation: Expected Loss represents the average loss that the bank expects to bear over time. Even though the EL is in line with forecasts, it’s essential to remember that this is a number that the bank aims to reduce rather than maintain.
Strategic Recommendations:
- Proactive Monitoring: Implement real-time monitoring systems to identify early warning signs of potential defaults.
- Stress Testing: Conduct stress tests to determine how the Expected Loss would change under various adverse conditions.
- Loan Loss Provisioning: Align loan loss provisions in accordance with the Expected Loss and Basel II requirements.

Regulatory Parameters and Trends
1. Risk-Weighted Assets — $211.1M (Actual) vs $220.5M (Previous Month)
Explanation: Risk-Weighted Assets (RWA) are assets adjusted for their associated risks. A decline in RWA from $220.5M to $211.1M could signify a risk-averse approach, possibly due to reduced lending or a shift towards less risky asset classes. For a non-retail business unit, managing RWA is crucial for maintaining capital adequacy as per Basel II.
Strategic Recommendations:
Asset Review: Conduct a portfolio review to identify and offload high-risk assets. Capital Planning: Link capital planning exercises directly to RWA metrics to maintain an optimal capital buffer.
2. Capital Adequacy Ratio (CAR) — 30%
Explanation: The CAR of 30% is considerably healthy, suggesting that the bank has a comfortable capital buffer to absorb a reasonable level of losses. While this is good, it could also indicate an overly conservative stance that might limit profitability.
Strategic Recommendations:
Strategic Capital Allocation: Consider reallocating capital towards higher-yielding, albeit somewhat riskier, asset classes, without breaching Basel II norms. Regular Monitoring: Set up a dashboard specifically to monitor CAR in real-time to anticipate and prepare for any fluctuations.
3. Non-Performing Assets (NPA) — $1.90M
Explanation: The NPA amount of $1.90M in a non-retail business portfolio can have a significant impact, especially if these are large, concentrated exposures. NPAs can erode the asset quality and, by extension, the bank’s profitability and capital adequacy.
Strategic Recommendations:
Asset Quality Review: Conduct an immediate asset quality review to identify the root cause of these NPAs.
Debt Recovery: Establish a dedicated debt recovery unit or enhance the capabilities of the existing one.
4. Net Interest Margin (NIM) — 1.31%
Explanation: A NIM of 1.31% in a non-retail business segment of a bank is modest. While this suggests that the bank is not taking on excessive risk, it could also imply missed revenue opportunities.
Strategic Recommendations:
Pricing Strategy: Revisit the loan pricing strategy to improve the net interest margin without significantly increasing the risk profile.
Cost Management: Look for ways to reduce the cost of funds, possibly by exploring low-cost, long-term funding options.
5. Return on Risk-Weighted Assets (RoRWA) — 2.03%
Explanation: RRWA is a measure of how well the bank is using its risk-weighted assets to generate returns. A RRWA of 2.03% is reasonable but leaves room for improvement, especially in a non-retail business segment where larger bets are often placed.
Strategic Recommendations:
Asset Utilisation: Explore opportunities to better utilise the risk-weighted assets, perhaps by entering new, yet thoroughly vetted, market segments.
Risk Management: Integrate advanced risk management techniques to improve the risk-return profile.
6. Return on Economic Capital (REC) — 1.23%
Explanation: Return on Economic Capital (REC) measures the return generated on the economic capital allocated. An REC of 1.23% may indicate either that the capital is not being efficiently utilized or that the risks undertaken are not generating commensurate returns. For a non-retail business unit, optimizing REC is crucial for maximizing shareholder value.
Strategic Recommendations:
Capital Optimization: Evaluate the efficiency of capital allocation across different portfolios and reallocate if necessary.
Risk-Reward Analysis: Conduct a detailed risk-reward analysis to identify portfolios or sectors that could potentially offer better returns for the same or lower risk.
7. Economic Capital — $11.11M
Explanation: Economic Capital represents the amount of capital that the bank needs to sustain all risks (credit, market, operational). At $11.11M, it’s vital to determine if this is adequate in covering the various risks, especially in a non-retail sector where large financial exposures are common.
Strategic Recommendations:
Risk Assessment: Conduct a comprehensive risk assessment to confirm if the economic capital is adequate.
Capital Planning: If necessary, devise a capital augmentation plan either through internal accruals or market instruments, ensuring alignment with Basel II regulations。
8. Tier I and Tier II Capital — $19.01M and $18.77M
Explanation: Tier I and Tier II capitals serve as the financial bedrock of the bank, with Tier I being the core capital and Tier II serving as supplementary. These levels indicate the bank’s financial strength and flexibility.
Strategic Recommendations:
Capital Structure: Review the current mix of Tier I and Tier II capital to ensure it aligns with the bank’s long-term strategy and Basel II requirements.
Contingency Planning: Create contingency plans to bolster Tier I or Tier II capital if certain risk thresholds are reached.

Exposure by Credit Rating
Explanation: The “Exposure by Credit Rating” provides a segmented view of how the bank’s non-retail lending portfolio is distributed across different credit ratings, ranging from BB to AAA. The figures represent the exposure in millions.
- Higher-Risk Categories (BB, BB+, BBB-): Exposure is considerable here, especially in the BB+ category at approximately $16.7 million.
- Medium-Risk Categories (BBB, BBB+, A-, A): Exposure is highest in the BBB+ and A- categories at about $21.9 million and $25.5 million respectively.
- Lower-Risk Categories (A+, AA-, AA, AA+, AAA): The exposure is notably high in the AA- and AA categories, standing at approximately $45.2 million and $47.5 million.
For a non-retail business division in a large bank, this kind of distribution poses several questions regarding risk concentration and portfolio diversification, especially considering the more significant impacts such loans can have.
Strategic Recommendations:
- Rebalance Portfolio
- Consider reducing exposure in higher-risk categories like BB and BB+.
- Increase investments in lower-risk categories like AA and AAA to balance the portfolio.
2. Credit Limit Reviews
- Regularly review and adjust credit limits for each category to align with the bank’s overall risk appetite.
3. Dynamic Pricing Strategy
- Implement risk-based pricing for new loans and for the renewal of existing ones, particularly in riskier categories.
4. Risk Mitigation Instruments
- Use credit derivatives or collateral as risk mitigation tools, especially for higher-risk exposures.
5. Sector-Based Analysis
- Conduct a sector-wise exposure analysis in conjunction with credit ratings to identify any sectoral concentration of risks.
6. Early Warning Indicators
- Introduce real-time monitoring systems for categories showing elevated risk, enabling quicker management actions.
7. Stress Testing and Capital Allocation
- Conduct stress tests based on credit rating exposures to determine the impact on capital under adverse conditions.
- Ensure that the capital allocated for credit risk is sufficient to cover potential losses across all credit rating categories, in line with Basel II requirements.
8. Regulatory Reporting
- Maintain meticulous records of exposure by credit rating for both internal risk management and compliance with Basel II regulatory reporting.
By adopting these strategic recommendations, the bank can manage its credit risk more effectively, ensuring a more diversified portfolio that is resilient to economic volatility. Moreover, these steps will assist the bank in maintaining compliance with Basel II regulations, particularly under Pillar 1 for capital adequacy and Pillar 2 for supervisory review.
Illustrations:

Analytics Tools
- Scenario Analysis: Ratios like Debt-to-Income, Loan-to-Value, and many others can be pivotal in scenario analyses. For example, what happens to the PD if the average Debt-to-Income ratio in your portfolio increases by 10%?
- Predictive Modelling: Utilizing machine learning algorithms, predictive modelling can forecast potential future outcomes based on current data. For instance, you could predict the Expected Loss for the next quarter based on current loan disbursements and PD.
- Stress Testing: Stress tests are essential for understanding how extreme scenarios would impact your portfolio. For example, how would a sudden economic downturn affect your Capital Adequacy Ratio?
- Sensitivity Testing: Sensitivity testing involves changing one variable at a time to see its impact on a specific outcome, like Exposure at Default. It’s a less extreme form of stress testing but equally insightful.
Call to Actions
Open Actions:
- Revisit Risk Models
- Task: Review and update the current risk assessment models to align with the observed Probability of Default and Loss Given Default.
- Deadline: End of this month.
- Responsible: Risk Management Team.
2. Portfolio Rebalancing Plan
- Task: Develop a strategy to rebalance loan exposure across different credit ratings.
- Deadline: Within two weeks.
- Responsible: Portfolio Management Team.
3. Client Segmentation Review
- Task: Re-evaluate the current client segmentation to identify high-risk clients that may be affecting the Probability of Default.
- Deadline: End of this month.
- Responsible: Client Relationship Managers.
4. Stress Testing
- Task: Conduct stress tests to assess how the portfolio would respond to adverse market conditions.
- Deadline: Next quarter.
- Responsible: Risk Management Team.
5. Sector Exposure Analysis
- Task: Perform a sector-wise analysis to evaluate if there is any concentration of risks that need to be addressed.
- Deadline: Within three weeks.
- Responsible: Data Analytics Team.
Critical Open Actions:
- Immediate Review of High Non-Performing Assets (NPAs)
- Task: Conduct an immediate review of the Non-Performing Assets which have shown an uptick.
- Deadline: Within one week.
- Responsible: Credit Review Team.
2. Capital Adequacy Compliance Check
- Task: Ensure that the capital reserves are adequate as per Basel II requirements, especially given the higher Exposure at Default.
- Deadline: Immediate.
- Responsible: Compliance and Finance Teams.
Overdue Action:
Update Early Warning Indicators
- Task: The system for early warning indicators was supposed to be updated to include real-time monitoring features.
- Deadline: Was due last month.
- Responsible: IT and Risk Management Teams.
- Urgency: This is now a critical task that needs immediate attention to enhance proactive risk management.
Each of these actions is designed to address specific challenges identified in the dashboard, ensuring that risk is managed effectively while also maintaining compliance with Basel II regulations. Immediate attention to the critical and overdue actions is crucial for maintaining the bank’s financial stability and regulatory compliance.
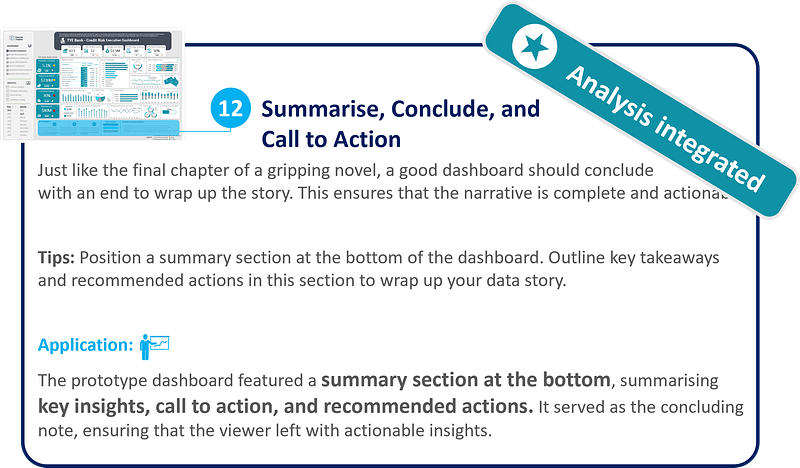
Illustration:
Key Insights
1. Rising Probability of Default:
The Probability of Default at 5.1% is slightly above the forecast of 5.0%. This uptick indicates an increased likelihood of loan defaults, which may necessitate higher capital reserves. This calls for an immediate review of risk models to align with Basel II standards.
2. Higher Exposure at Default:
The Exposure at Default is $230M, exceeding the forecast by $5M. This additional exposure suggests the bank is taking on more risk in its lending portfolio, warranting a thorough evaluation of credit policies and collateral valuation.
3. Stagnant New Loan Growth:
The number of new loans stands at just 12, below the forecast of 15. This could signal either a more stringent approval process or missed market opportunities. The bank needs to balance risk management with growth objectives.
Strategic Recommendations
- Proactive Monitoring: Implement real-time monitoring systems to identify early warning signs of potential defaults.
- Stress Testing: Conduct stress tests to determine how the Expected Loss would change under various adverse conditions.
- Loan Loss Provisioning: Align loan loss provisions in accordance with the Expected Loss and Basel II requirements.
- NPA Management: Implement an aggressive strategy for managing NPAs. Consider options like asset restructuring, auctions, or engaging collection agencies. This should be done in compliance with Basel II guidelines, which mandate effective risk management procedures.
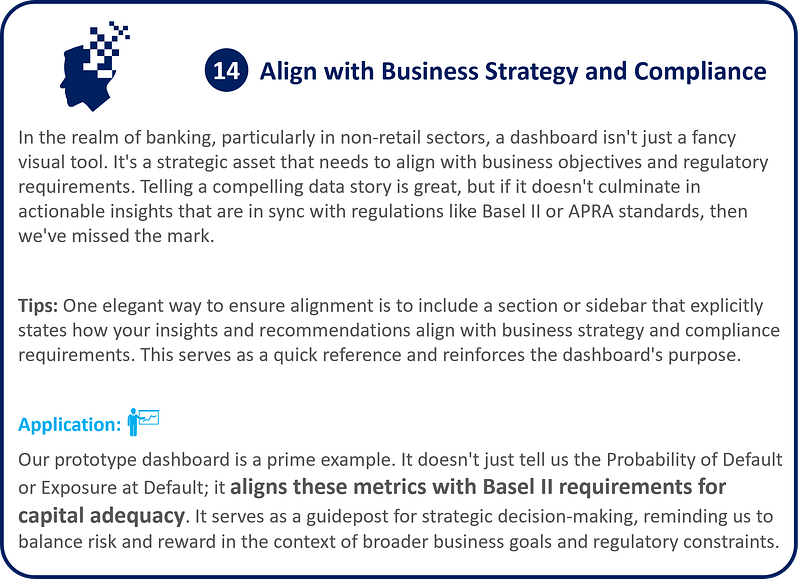
Take the prototype dashboard on credit risk for a non-retail business division in a bank. It employs effective KPIs like Probability of Default, tailored to align with Basel II. Its UX design is intuitive, focusing only on critical metrics and presenting them in an easy-to-navigate layout. It doesn’t overwhelm the user with information but keeps the narrative focused on the bank’s financial health and credit risk.
Last Few Handy Words:
- Ensure Data Quality and Compliance: Accurate data is the backbone of trustworthy insights. Always prioritise data integrity and regulatory compliance.
- Set Up Effective KPIs, Metrics: Choose KPIs that really matter. They should align with your objectives and offer actionable insights.
- Keep It Simple, Make It Intuitive: Complexity can cloud clarity. A straightforward, intuitive design facilitates better decision-making.
- Too Much Information Can Overwhelm the Viewer and Dilute the Story: Less is often more. Overloading your dashboard can distract from its main narrative.
- Be Concise. Remove Any Elements That Don’t Serve the Story or the User’s Needs: Every element should add value. If it doesn’t, it’s just noise. Keep it lean.
- A Good Dashboard Should Be Easy to Navigate, Even for Someone Unfamiliar With the Data: User-friendliness is key. Your dashboard should be a helpful guide, not a puzzling maze.
- Use Familiar UI Elements, Clear Labels, and a Simple Layout to Make the Dashboard User-Friendly: Familiarity breeds comfort. Use common UI elements and clear labels to enhance user experience.
To conclude, the real magic happens when storytelling, dashboards, and embedded UX design coalesce into a compelling data story. They’re not just isolated elements; they are complementary tools that enhance the readability, usability, and impact of your data.
So why not start your journey in data visualisation storytelling? From ideation to deployment, try using the techniques and combining all the tips and tricks above to create your own storytelling dashboard.
To dive deeper, consider these resources:
- Interaction Design: Dashboards and Visualization
- Data Analytics: Dashboards vs. Data Stories
- Power BI Data Dashboards
If you found this article helpful, I’d appreciate it if you could show some love with a few claps at the bottom of the page. Don’t hesitate to leave your insights or feedback in the comments, and feel free to pass this along to your friends and follow me on Medium.
Some other articles from Jing Chen
- Customer Churn Prediction — 8 Steps For Building XG Boost Model Part 2 — Model Training, Evaluation, Prediction, and Interpretation
- Customer Churn Prediction — A Step by Step Tutorial of Building XG Boost ML Model Part 1 — Exploratory Data Analysis (EDA)
- Time Series Forecasting — 6 steps to build a Stock Price Prediction LSTM Model: Give it a Try and See What You Can Get for the Next Day’s Stock Price
- Beyond the Spreadsheet toward Analytics Role Upskilling: A cheat sheet for people scared coding
- Mastering Financial Modelling 101: From Common Techniques to the Data Analytics Revolution
- The Power of AI for Data Analytics: A Comprehensive Exploration
- Empowering Decision Making in Banking and Public Sector: The Role of Financial Modelling and Reporting Tools
- Building a Risk Management Model: A Journey of Transparency and Resilience
- Transforming Internal Audit: Unleashing the Power of Data Analytics in Banking and the Public Sector
Want to connect ?
- Follow me on Medium
- Connect me on LinkedIn


