
Sacred coding? A Conversion Cheat Sheet of SQL, Python, Alteryx, PowerQuery: Upskill your Analytics Skills

Are you someone who feels intimidated by coding and the world of analytics? Are spreadsheets the sole basis of your proficiency in data analysis? If so, fear not! This blog is here to introduce individuals like you through a journey of transitioning to analytics using powerful tools such as SQL, Python, Power Query, and Alteryx. I understand the apprehension and fear that comes with stepping out of your comfort zone, but I assure you that with the right mindset and approach, you can successfully upskill and embark on a fulfilling career in analytics. Let’s delve into this exciting adventure!
Overcoming Fear: The Journey into the World of Analytics
Imagine yourself sitting at your desk, armed with basic Excel skills, tackling data analysis tasks with spreadsheets as your sole companion. While this approach may have served you well in the past, you start to feel limited by the constraints and drawbacks of spreadsheet-based analysis. The need for a more robust and efficient solution becomes apparent.
At this point, fear and apprehension creep in. The thought of delving into coding languages like SQL, Python, and Power Query can be overwhelming, especially for those with little to no prior experience. You may ask yourself, “Can I really do this? Will I be able to keep up with the pace of technology?”
Rest assured, these concerns are valid and experienced by many. However, it’s essential to recognize that they should not hold you back from pursuing your passion for analytics. In fact, acknowledging and confronting your fear is the first step towards personal and professional growth.
Reason Why Transitioning to Powerful Analytics Tools

As you embark on your journey into analytics, it’s essential to understand the reasons why transitioning from spreadsheets to more powerful data analysis tools is beneficial.
While Excel certainly offers user-friendly interfaces, quick data entry, and calculation capabilities, it does have limitations when it comes to complex data analysis tasks. These limitations can hinder your ability to derive accurate insights and make informed decisions.
Limited Data Size and Performance:
One significant limitation is the size and performance of spreadsheets. Excel has a maximum number of rows and columns, which can restrict the amount of data you can work with. As datasets grow larger, you may experience slower performance and increased processing times, making it challenging to handle complex calculations or perform advanced analyses. This limitation can impede your ability to analyze big data or work with extensive datasets.
Lack of Data Integrity:
Another drawback is the lack of data integrity mechanisms in spreadsheets. With multiple users working on the same spreadsheet, version control becomes difficult, and accidental deletions or errors can occur. Without robust data validation and auditing capabilities, ensuring the accuracy and reliability of your analyses becomes a challenge. This limitation can lead to incorrect conclusions and decisions if data inconsistencies or errors go unnoticed.
Difficulty in Data Transformation:
Data transformation and cleaning are also areas where spreadsheets fall short. While they offer basic data manipulation functions, handling complex transformations or dealing with messy data can be time-consuming and prone to errors. Spreadsheets may not provide the flexibility and scalability required for advanced data cleansing and merging tasks. This limitation can hinder your ability to work with diverse data sources or perform complex data transformations efficiently.
Limited Collaboration and Accessibility:
Collaboration and accessibility can also be challenging with spreadsheets. Sharing and distributing spreadsheets may lead to security concerns, as sensitive information can be mishandled or accessed by unauthorized individuals. Collaboration among multiple users can become cumbersome, especially when tracking changes, consolidating inputs, or ensuring data consistency. This limitation can hinder seamless teamwork and create difficulties when working on shared analyses or projects.
Lack of Advanced Analytical Capabilities:
Lastly, spreadsheets have limited advanced analytical capabilities. While they offer basic formulas and functions for calculations, performing complex statistical modeling, machine learning, or predictive analytics within a spreadsheet environment can be challenging. Advanced analysis techniques often require specialized tools like SQL, Python, Power Query, or Alteryx, which provide more robust capabilities and libraries for in-depth data analysis.
Recognizing these limitations is crucial for professionals looking to expand their data analysis skills. Transitioning to more powerful analytics tools addresses these drawbacks and empowers you to overcome the limitations of spreadsheets.
- SQL allows for efficient data retrieval and manipulation
- Python offers extensive libraries for advanced analytics and machine learning
- Power Query provides intuitive data transformation capabilities
- Alteryx offers a no-code solution for complex data workflows.
By leveraging these tools, you can enhance your analytical capabilities, work with larger datasets, ensure data integrity, collaborate seamlessly, and perform advanced analyses..
To ease your transition, I have prepared a cheat sheet that showcases the equivalence of Excel formulas in SQL, Python, PowerQuery, Alteryx. This cheat sheet will serve as your starting point for learning to code, allowing you to leverage your existing spreadsheet knowledge as a foundation for learning new tools.
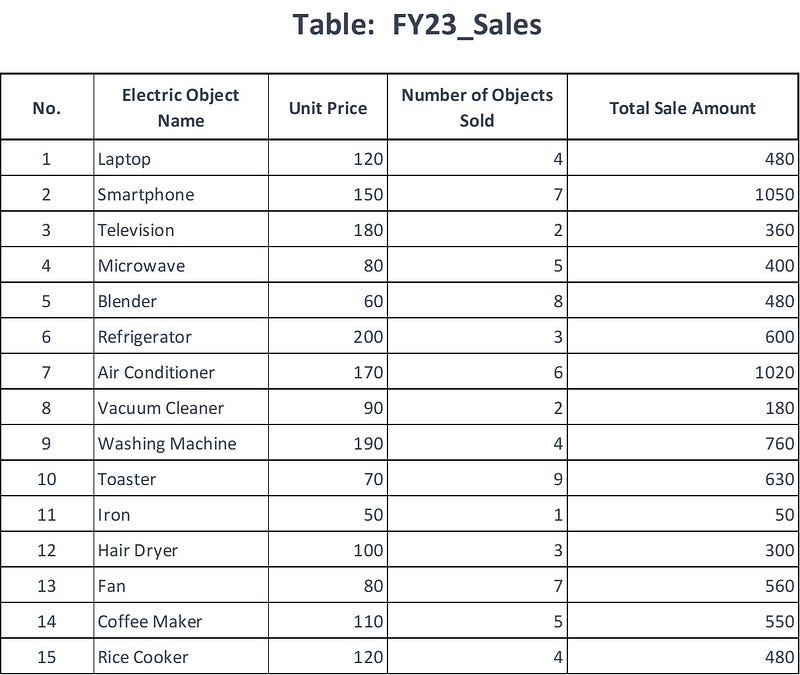
A table below used as a reference dataset:
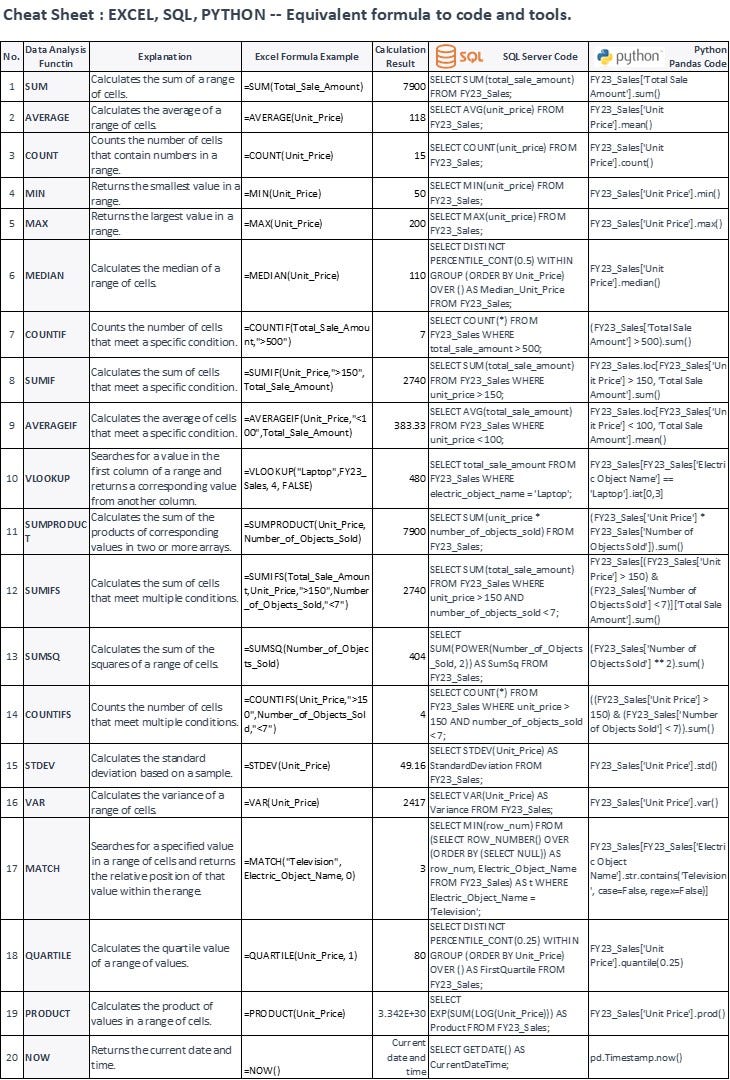
--- SQL Code Reference as Above
SELECT SUM(total_sale_amount) FROM FY23_Sales;
SELECT AVG(unit_price) FROM FY23_Sales;
SELECT COUNT(unit_price) FROM FY23_Sales;
SELECT MIN(unit_price) FROM FY23_Sales;
SELECT MAX(unit_price) FROM FY23_Sales;
SELECT DISTINCT PERCENTILE_CONT(0.5) WITHIN GROUP (ORDER BY Unit_Price) OVER () AS Median_Unit_Price FROM FY23_Sales;
SELECT COUNT(*) FROM FY23_Sales WHERE total_sale_amount > 500;
SELECT SUM(total_sale_amount) FROM FY23_Sales WHERE unit_price > 150;
SELECT AVG(total_sale_amount) FROM FY23_Sales WHERE unit_price < 100;
SELECT total_sale_amount FROM FY23_Sales WHERE electric_object_name = 'Laptop';
SELECT SUM(unit_price * number_of_objects_sold) FROM FY23_Sales;
SELECT SUM(total_sale_amount) FROM FY23_Sales WHERE unit_price > 150 AND number_of_objects_sold < 7;
SELECT SUM(POWER(Number_of_Objects_Sold, 2)) AS SumSq FROM FY23_Sales;
SELECT COUNT(*) FROM FY23_Sales WHERE unit_price > 150 AND number_of_objects_sold < 7;
SELECT STDEV(Unit_Price) AS StandardDeviation FROM FY23_Sales;
SELECT VAR(Unit_Price) AS Variance FROM FY23_Sales;
SELECT MIN(row_num) FROM (SELECT ROW_NUMBER() OVER (ORDER BY (SELECT NULL)) AS row_num, Electric_Object_Name FROM FY23_Sales) AS t WHERE Electric_Object_Name = 'Television';
SELECT DISTINCT PERCENTILE_CONT(0.25) WITHIN GROUP (ORDER BY Unit_Price) OVER () AS FirstQuartile FROM FY23_Sales;
SELECT EXP(SUM(LOG(Unit_Price))) AS Product FROM FY23_Sales;
SELECT GETDATE() AS CurrentDateTime;
#### Python Pandas Code reference as Above
FY23_Sales['Total Sale Amount'].sum()
FY23_Sales['Unit Price'].mean()
FY23_Sales['Unit Price'].count()
FY23_Sales['Unit Price'].min()
FY23_Sales['Unit Price'].max()
FY23_Sales['Unit Price'].median()
(FY23_Sales['Total Sale Amount'] > 500).sum()
FY23_Sales.loc[FY23_Sales['Unit Price'] > 150, 'Total Sale Amount'].sum()
FY23_Sales.loc[FY23_Sales['Unit Price'] < 100, 'Total Sale Amount'].mean()
FY23_Sales[FY23_Sales['Electric Object Name'] == 'Laptop'].iat[0,3]
(FY23_Sales['Unit Price'] * FY23_Sales['Number of Objects Sold']).sum()
FY23_Sales[(FY23_Sales['Unit Price'] > 150) & (FY23_Sales['Number of Objects Sold'] < 7)]['Total Sale Amount'].sum()
(FY23_Sales['Number of Objects Sold'] ** 2).sum()
((FY23_Sales['Unit Price'] > 150) & (FY23_Sales['Number of Objects Sold'] < 7)).sum()
FY23_Sales['Unit Price'].std()
FY23_Sales['Unit Price'].var()
FY23_Sales[FY23_Sales['Electric Object Name'].str.contains('Television', case=False, regex=False)]
FY23_Sales['Unit Price'].quantile(0.25)
FY23_Sales['Unit Price'].prod()
pd.Timestamp.now()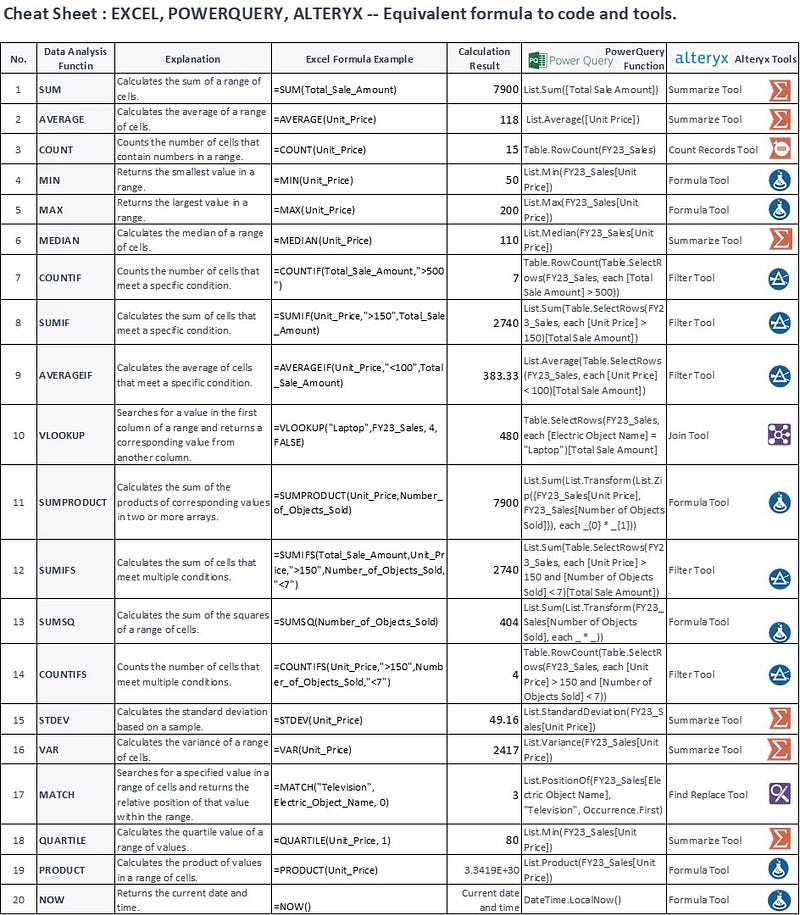
Power Query and Alteryx are valuable no-code/low-code tools for data merging and calculations. They empower users without coding expertise to effortlessly perform complex data operations. These tools provide a user-friendly interface that simplifies the process of transforming and manipulating data, eliminating the need for manual coding. With intuitive drag-and-drop functionality in Alteryx, users can easily merge, filter, aggregate, and calculate data without writing code. This accessibility enables individuals with limited coding knowledge to efficiently handle data tasks, saving time and increasing productivity in data analysis and preparation workflows.
Learning any new skill comes with its fair share of challenges, and coding is no exception. However, with the right learning techniques, practice, and access to valuable resources, you can overcome these challenges and emerge as a proficient analyst. I recommend engaging in hands-on practice, working on real-world projects, and utilizing online learning platforms such as LinkedIn Learning, Udemy, which offer comprehensive courses on SQL, Python, Power Query, and Alteryx.
Here I gathered some LinkedIn courses for your reference:
- Microsoft SQL Server Essential Training
- Python for Data Science Essential Training
- Excel Business Intelligence: Power Query
- Introduction to Alteryx
Transitioning to analytics through SQL, Python, Power Query, and Alteryx may seem daunting at first, but with determination, persistence, and the right resources, you can overcome your fear of coding and embark on a successful career in analytics. Embrace the power of these tools, tap into your passion for data analysis, and watch as you unlock new heights of personal and professional growth. The journey beyond the spreadsheet awaits you.
If you found this article helpful, I’d appreciate it if you could show some love with a few claps at the bottom of the page. Don’t hesitate to leave your insights or feedback in the comments, and feel free to pass this along to your friends and follow me on Medium.
Some other articles from Jing Chen
- Customer Churn Prediction — A Step by Step Tutorial of Building XG Boost ML Model Part 1 — Exploratory Data Analysis (EDA)
- Time Series Forecasting — 6 steps to build a Stock Price Prediction LSTM Model: Give it a Try and See What You Can Get for the Next Day’s Stock Price
- Mastering Financial Modelling 101: From Common Techniques to the Data Analytics Revolution
- The Power of AI for Data Analytics: A Comprehensive Exploration
- Empowering Decision Making in Banking and Public Sector: The Role of Financial Modelling and Reporting Tools
- Building a Risk Management Model: A Journey of Transparency and Resilience
- Transforming Internal Audit: Unleashing the Power of Data Analytics in Banking and the Public Sector
Want to connect ?
- Follow me on Medium
- Connect me on LinkedIn