
Service Fabric part.2— How to attach Visual studio code to the ASP .NET core process in the Service Fabric cluster?
Introduction
Attaching Visual studio code to the process for debugging is easy. However, There are some differences between an ASP .NET process and an ASP .NET core process deployed to the local Fabric cluster when you attach.
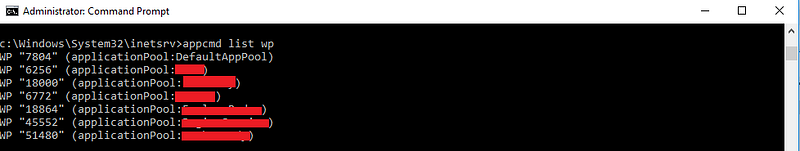
- You can’t find process ID from appcmd when you want to attach the process because the process is independent of IIS.
- You can’t start debugging from Visual studio if other services depend on the service behind the local Service Fabric.
Finally, I found out the solution after I tried many ways. The following steps are my thoughts.
1. Attach the process from Visual Studio — Failed
- The first step is getting the process ID from the following PowerShell scripts:
Connect-ServiceFabricCluster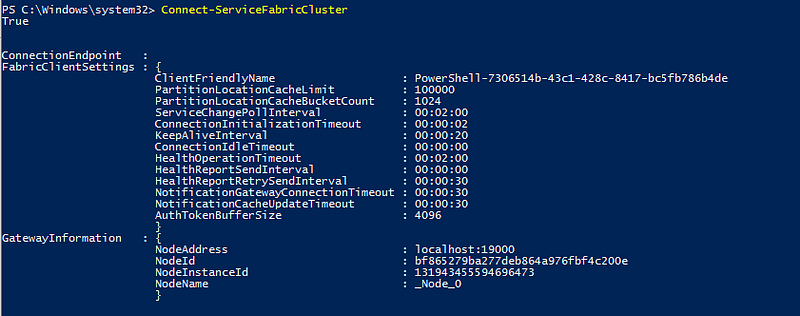
Get-ServiceFabricApplication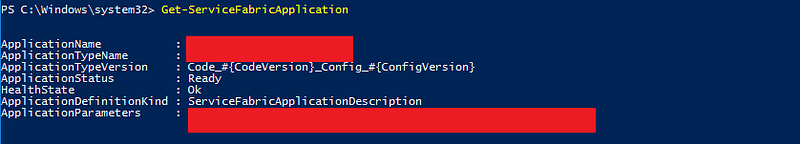
Get-ServiceFabricDeployedReplica -NodeName "_Node_0" -ApplicationName "{name}"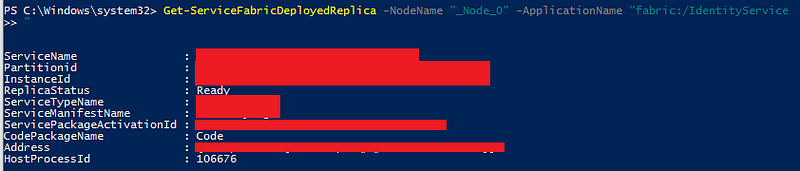
- Finally, we got the process ID “106676” but the breakpoints don’t work if you attach from this process from Visual Studio. So I tried to use other ways to complete the task.
2. Attach the process from Task Manager — Failed
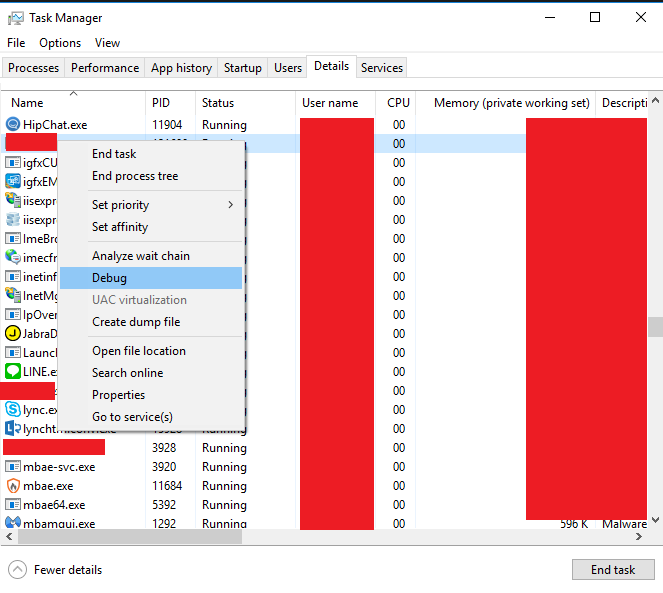
- Open Task Manager and search your process. Right click on it and choose Debug.
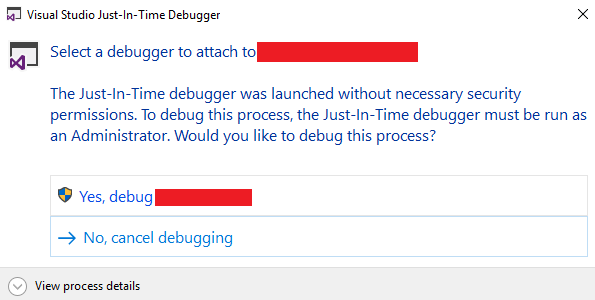
- Click Yes.
- However, the breakpoints will not currently be hit.
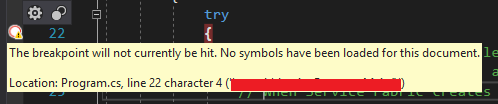
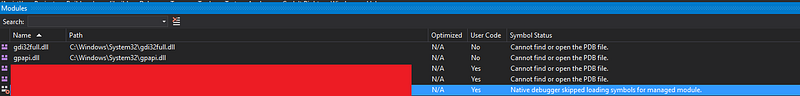
- Check the loaded symbols. Click Debug-> Windows->modules then we can find out that: - Some modules show that Cannot find or open the PDB file. - Some modules show that Native debugger skipped loading symbols.
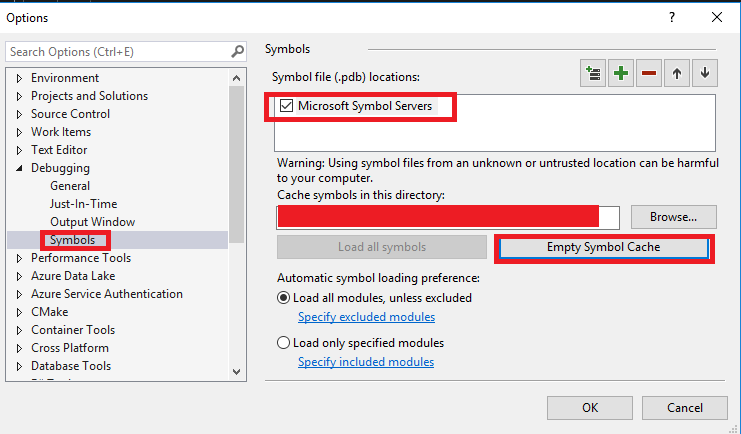
- So modules can’t load somehow. Click Debug->Options->Debugging. Check Microsoft Symbol Servers and click Empty Symbol Cache.
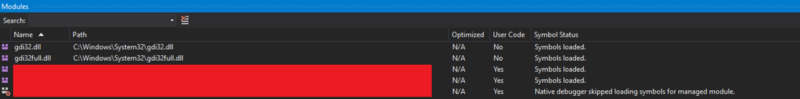
- However, the breakpoints will still not currently be hit. Check the loaded symbols. It’s better than before now. - Some modules show that Symbol loaded. - Some modules show that Native debugger skipped loading symbols.
3. Attach the process from Task Manager (Enable native compilation)-Success
- Now we open Task Manager again. Right click on it and choose Debug.
- Click Yes.
- Check Manually choose the debugging in this time.
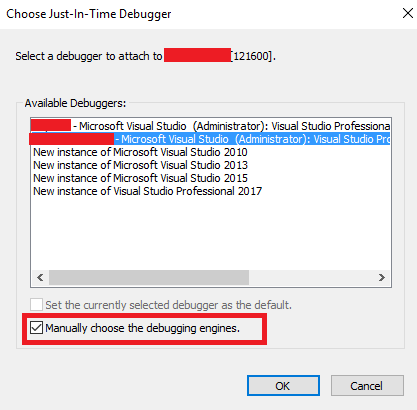
- Check Managed (Native compilation).
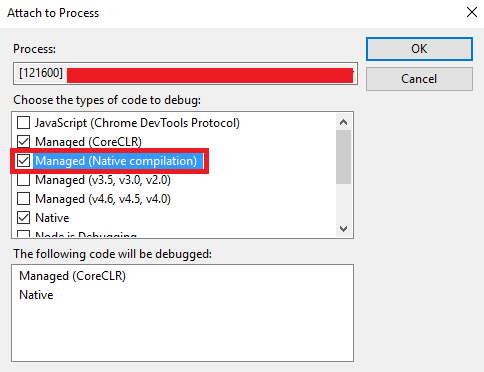
- The breakpoints will be hit in this time.
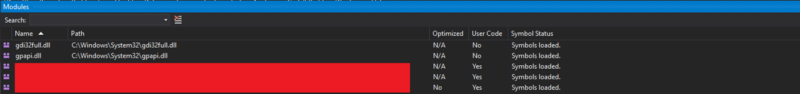
- Check the loaded symbols. Click Debug-> Windows->modules then we can find out that all modules show Symbols loaded.
Summary
Thanks for your patient. I am Sean. I work as a software engineer.
This article is my note. Please feel free to give me advice if any mistakes. I am looking forward to your feedback.
Please feel free to clap if this article can help you, thank you.
Here is my page on Facebook.
Related topics
Database:
Debugging:
[DevOps] Ansible Provisioning for Windows:
Software testing:
DevOps:
References
- [Visual Studio] 偵錯模式無法叫用中斷點
- How to debug and step into a native code project from inside a .NET core C# project?
- 教學課程:在同一個偵錯工作階段中進行 C# 和 C++ 偵錯
- Getting started with Azure Service Fabric
- [Day02] ASP.NET Core 2 系列 — 程式生命週期 (Application Lifetime)
- Attach to Process missing processes for local service fabric cluster
- Debugging ASP.NET Core 2.0 Source Code


