
[DevOps]Introduction to Opserver

Introduction
Opserver is a monitoring software based on ASP .NET. It’s an open source project by the team at Stack Exchange, home of Stack Overflow. The team use Opserver to monitor their components.
Let ‘s have a look and see the stack of Stack Exchange. It uses web servers, Redis servers, SQL servers, and ElasticSearch severs. So Opserver has abilities to monitor these components.

This article is an instruction for:
- How to build Opserver in the local side
- Monitor web server and MS SQL
- Dashboard — Infrastructure information (WMI)
- Monitor Redis server
- Monitor ElasticSearch
If you have already set up for Opserver and have issues about web deploy, you can refer to the following article:
How to build Opserver in the local side?
- Clone the Opserver from Github.
- Generate SecuritySettings.config in the Config folder. You can edit from SecuritySettings.config.example. You have 2 options:
1.Set security settings provider to default:
- First, edit SecuritySettings.config.
- Then build the solution and start the Opserver

- You will see the homepage.

2.Set security settings provider to admin:
- Edit SecuritySettings.config.
- Then build the solution and start the Opserver. You can log in to the Opserver by using username admin.
Monitor web server and MS SQL
Generate SQLSettings.config in the Config folder. You can edit from SQLSettings.example.config.
- defaultConnectionString is required. You don’t have to modify anything.
- clusters is optional. You can modify the name of nodes.
- instances is optional. You can just give name or you can give connectionString.
For single instance:
Then build the solution and start the Opserver.
Trouble shooting
Maybe you will get this message: ‘Unable to fetch from SQL: Error opening connection to …”

Solution
- Open the SQL Server Configuration Manager on the target machine. You can find it from Start->All programs-> Microsoft SQL Server 2008->Configutation Tools-> SQL Server Configuration Manager
- Enable TCP/IP. Right click on TCP/IP and choose enable.

SQL instance page
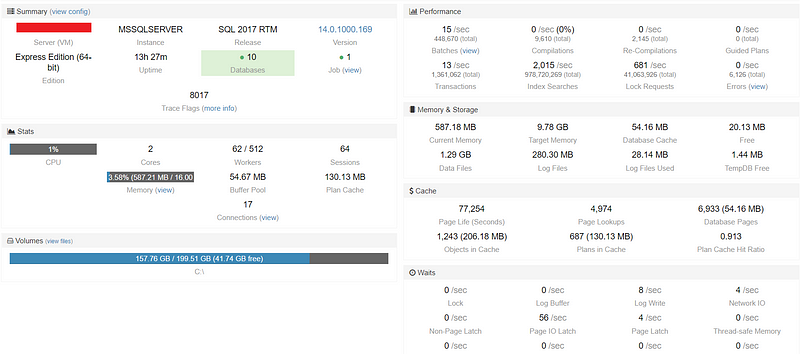
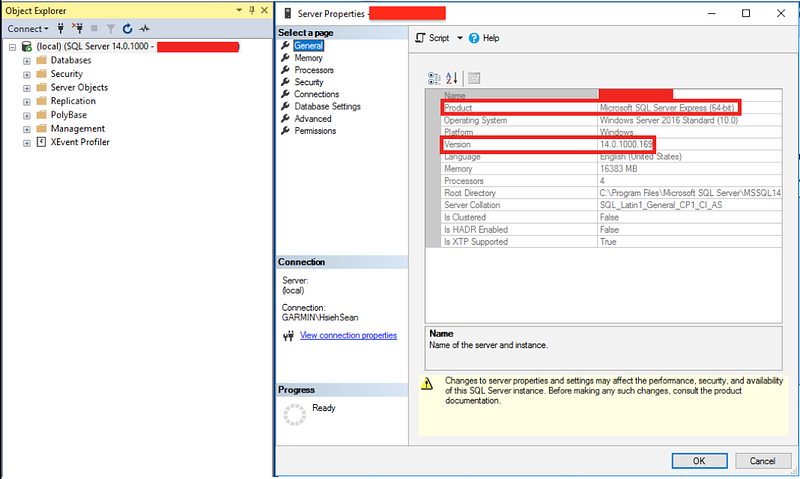
In the Summary block, we can get the server’s name, version, edition, database, and job information…etc.
We can open SQL Server Management Studio (SSMS) and right click on the database, select Property. Then we can retrieve some of these information.
In the Stats block, we can get CPU utilization, memory utilization, workers, session, and connections.
We can open SQL Server Management Studio (SSMS) and use the following SQL query to get the worker information.
select (select max_workers_count from sys.dm_os_sys_info) as 'TotalThreads',sum(active_Workers_count) as 'Currentthreads',(select max_workers_count from sys.dm_os_sys_info)-sum(active_Workers_count) as 'Availablethreads',sum(runnable_tasks_count) as 'WorkersWaitingfor_cpu',sum(work_queue_count) as 'Request_Waiting_for_threads'from sys.dm_os_Schedulers where status='VISIBLE ONLINE'
And the following query to get the session information.
sp_who2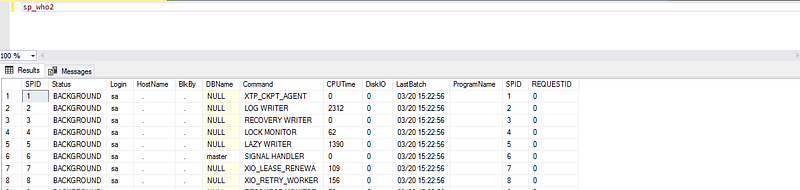
Right click on the database, select Activity Monitor. Then we can retrieve I/O wait time from Resource waits.

Connections page

In connections page, we can get all connections of the database.
In SQL Server Management Studio (SSMS) and right click on the database, select Report->Standard Report->Activity — All Sessions. We can also get the same information.

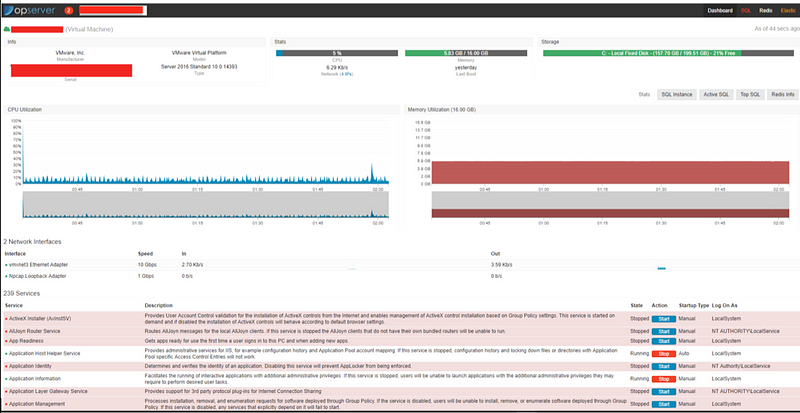
Dashboard — Infrastructure information (WMI)
Opserver can explore more information for us by manipulating the Windows Management Instrumentation (WMI) in the machine.
- Generate DashboardSettings.config in the Config folder. You can edit from DashboardSettings.example.config.
- Add the name in the nodes of WMI.
- Then build the solution and start the Opserver.
- In the Dashboard page, we can get the information about CPU utilization, memory utilization, network interfaces, and Windows services information.
Warning thresholds
You can set thresholds for machines from DashboardSettings.config.
Monitor Redis server
- Generate RedisSettings.config in the Config folder. You can edit from RedisSettings.example.config. For single node:
- Then build the solution and start the Opserver.

- In the Redis page, we can get the information about: - Redis replication: is master or slave? how any slaves? - Memory - Persistence: is AOF mode enable? - Keyspace: how many keys in the Redis? - Clients: how many clients connect to Redis?
- redis-cli is a native command. We can retrieve some important information and health condition from redis-cli:
redis-cli
info client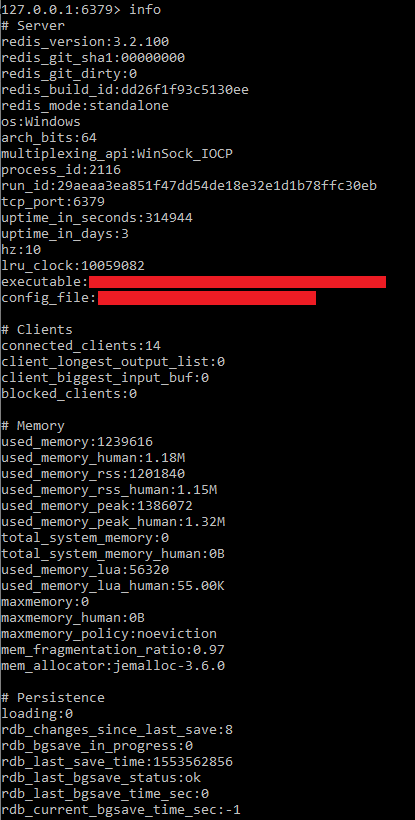
- Server: the information of redis server - Clients: the connection information of client side - Memory: the use condition of memory - Persistence: RDB and AOF information - Stats: common statistics information - Replication: Master/Slave information - CPU: CPU usage - Cluster: redis cluster information - Keyspace
- You can get the same information from View INFO as using redis-cli (Exclude cluster, and keyspace):

Monitor ElasticSearch
- Generate ElasticSettings.config in the Config folder. You can edit from ElasticSettings.example.config. For single node:
- Then build the solution and start the Opserver.
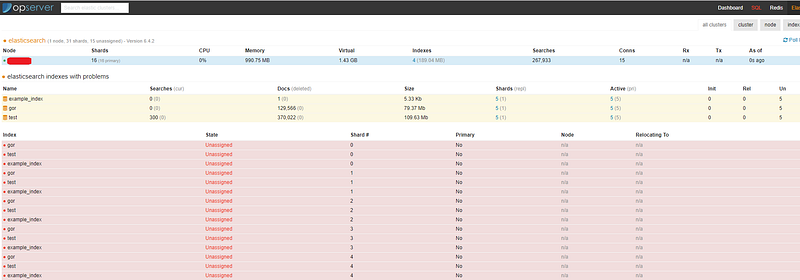
- In the Elastic page, we can get the information about ElasticSearch nodes and index.
Summary
Thanks for your patient. I am Sean. I work as a software engineer.
This article is my note. Please feel free to give me advice if any mistakes. I am looking forward to your feedback.
If you have create a monitoring service and you have encountered some problems when you do the web deployment, you can see my next article.
Please feel free to clap if this article can help you. Thank you.
You can also subscribe my page on Facebook.
Related topics
Algorithm:
.NET solutions:
APM & Logging Services
[Golang] Build A Simple Web Service:
Back to basic:
Database:
Debugging:
DevOps:


