
Host Your Google Earth Engine RESTful APIs on Colab for Free
With FastAPI and ngrok

Geospatial data has been in high demand. It reveals how our planet changes over time. When we talk about geospatial, we think of Google Earth Engine (GEE). This service has several advantages. It hosts many large data collections that span over 37 years. All computations run on Google’s powerful cloud infrastructure. What’s more, it is free for non-profit projects. With GEE, we can study the land use land cover (LULC), the vegetation, the local climate (here and here), and even the crop production in the US for free.
However, GEE does have a high barrier to entry. Firstly, proficiency in JavaScript or Python is a must. Secondly, we need to be familiar with many geospatial concepts, such as image collection, geometry, and satellite bands. Thirdly, its asynchronous request-response pattern takes some getting used to for newcomers.
This poses a small challenge for many data scientists. More often than not, they just want some values for a set of coordinates quickly, such as the soil pH or the mean land temperature. As of this writing, they would need to go through a fair bit of coding because GEE provides no RESTful API. Wouldn’t it be nice if we can fill that gap ourselves (Video 1)? Our APIs should wrap up some common GEE computations and offer HTTP access across the internet.
Let’s do it in this article. I choose FastAPI for the job. This trendy library allows us to build high-performance APIs in Python, one of the two service languages in GEE. And Google Colab is the platform of choice. Colab not only is integrated with GEE seamlessly, but it can also serve the APIs on HTTP publicly with the help of ngrok (Video 1). In this article, I am going to describe the construction of two APIs. One returns the land temperature and the other calculates the soil pH for a given set of coordinates. Afterward, I will demonstrate how to use the APIs to get the metadata for some bacteria from BacDive.
The APIs are defined here.
This is the Python app that validates data in BacDive with our GEE APIs.
1. Google Earth Engine APIs with FastAPI and ngrok
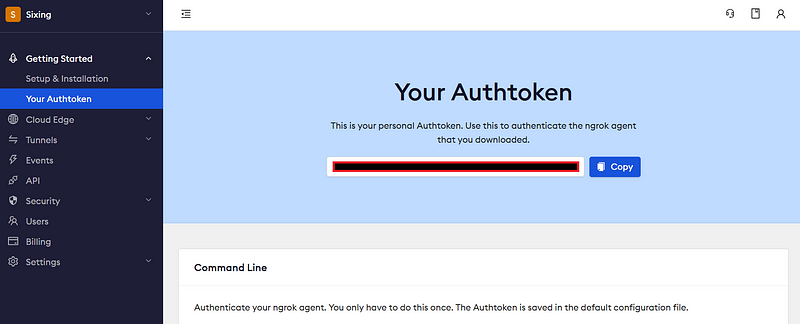
First off, you will need a Google Earth Engine account and an ngrok account. Find your ngrok Authtoken on your account page (Figure 1).
1.1 Initialization
Create a Colab notebook. After the library imports, let’s initialize both GEE and ngrok. First, follow Google’s instructions to authenticate and initialize GEE (Lines 1 & 2). Afterward, the input function will prompt you for your ngrok Authtoken (Line 3). Paste your Authtoken in the input box and confirm. The code will then authorize your ngrok instance at Line 4.
# Trigger the authentication flow.
ee.Authenticate()

# Initialize the library.
ee.Initialize()

ngrok_key = input("Your ngrok Authtoken")

!ngrok authtoken {ngrok_key}
1.2 GEE wrapper functions
Next, we can create some wrapper functions that encapsulate the GEE interactions.
def generate_collection(geometry, dataset, startDate, endDate):
    collection = ee.ImageCollection(dataset).filterDate(startDate, endDate).filterBounds(geometry);
    return collection

def get_mean(image_collection, point, property, scale_factor):
    image = image_collection.select([property]).reduce(ee.Reducer.mean()).multiply(scale_factor)

    fcPoint = ee.FeatureCollection([ee.Feature(point)])

    geojson = image.sampleRegions(collection = fcPoint,  scale = 1000, geometries = True)

    return geojson.getInfo()["features"][0]["properties"]

def generate_image(dataset):
    return ee.Image(dataset)

def get_image_value(image, point, property, scale_factor):
    return image.reduceRegion(ee.Reducer.mean(), point, 100).get(property).getInfo() * scale_factor
In general, GEE stores measurement results in images. Some measurements, such as elevation and soil pH, were done only once. They are stored in single images. In contrast, other measurements, such as soil temperature and precipitation, are done periodically. They are instead stored in image collections. The two functions generate_collection (Lines 1–3) and generate_image (Lines 14–15) return image collections and single images, respectively. Then, we would like to get the mean measurement values for the target regions (Lines 5–12 & Lines 17–18).
1.3 FastAPI
It is time to set up FastAPI in our notebook.
app = FastAPI()

@app.get('/')
async def root():
    return {'hello': 'world'}


@app.get("/land-surface-temperature")
async def get_land_surface_temperature(lat: float, lon: float, start_date: datetime.date, end_date: datetime.date):
    dataset = "MODIS/061/MOD11A1"

    point = ee.Geometry.Point([lon, lat])

    image_collection = generate_collection(point, dataset, start_date.strftime("%Y-%m-%d"), end_date.strftime("%Y-%m-%d"))

    result = get_mean(image_collection, point, "LST_Day_1km", 0.02)

    return {'result': result}


@app.get("/soil-ph")
async def get_soil_ph(lat: float, lon: float):
    dataset = "OpenLandMap/SOL/SOL_PH-H2O_USDA-4C1A2A_M/v02"

    point = ee.Geometry.Point([lon, lat])

    image = generate_image(dataset)

    scale_factor = 0.1

    ph = get_image_value(image, point, "b0", scale_factor)

    return {"result": {"pH": ph}}
In this code block, we first initialize a FastAPI app. Then we define three routes: the root, land-surface-temperature, and soil-ph. In the latter two, we use our functions from Section 1.2 to request the measurement values from GEE. The temperature values come from the MOD11A1.061 Terra Land Surface Temperature and Emissivity Daily Global 1km dataset (MODIS data and products acquired through the LP DAAC have no restrictions on subsequent use, sale, or redistribution), while the pH values are provided by the OpenLandMap Soil pH in H2O dataset (CC-BY-SA-4.0).
1.4 ngrok
Now let’s start the API service. The code here is borrowed from an answer on stackoverflow.com.
ngrok_tunnel = ngrok.connect(8000)
print('Public URL:', ngrok_tunnel.public_url)
nest_asyncio.apply()
uvicorn.run(app, port=8000)
The code will generate an endpoint URL and keep running (Video 1).
1.5 Test
We can now test the service. Click the endpoint URL, and you will be greeted by the “hello world” message at the root (Video 1).
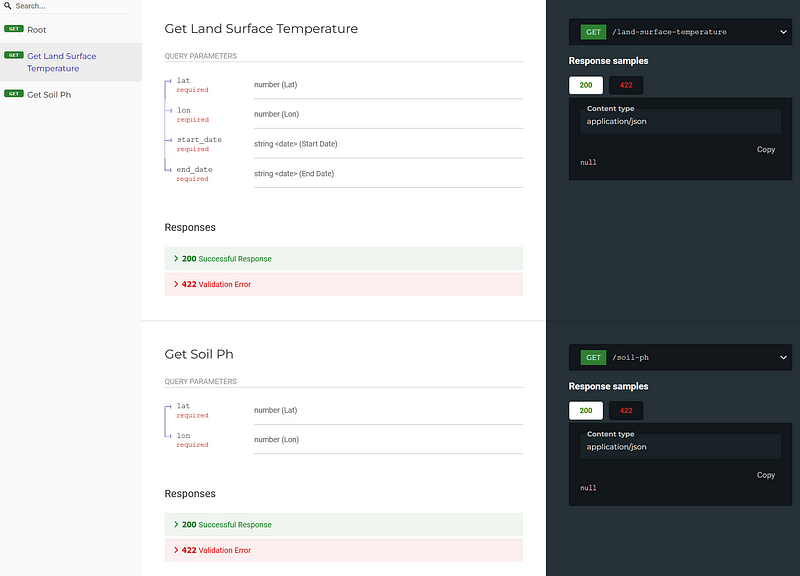
Amazingly, FastAPI will generate the documentation automatically. You can visit it at the /redoc route (Figure 2).
Let’s test the land-surface-temperature API. Encode the required parameters as key-value pairs after the “?” mark in your URL. For example, the following query string allows us to get the land surface temperature for (52.72389418745157, -92.03593750000002) between 2020–01–1 and 2020–05–01.
/land-surface-temperature?lat=52.72389418745157&lon=-92.03593750000002&start_date=2020-01-01&end_date=2020-05-01
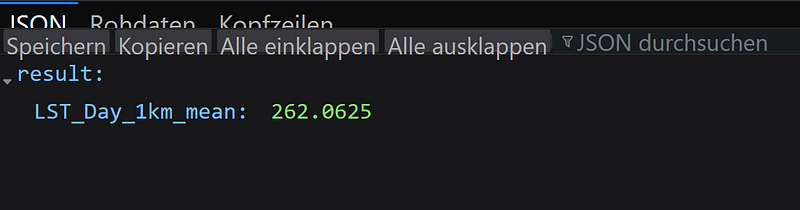
Be aware that the returned value is in Kelvin (Figure 3).
The soil-ph API works similarly. But it does not require a sampling period. So the following query string alone can request the soil pH for the same pair of coordinates (Video 1).
/soil-ph?lat=52.72389418745157&lon=-92.03593750000002
2. Compare BacDive’s lab results to the wild metadata from GEE
The BacDive database by DSMZ collects information about bacterial isolates, including their growth temperature, pH, and metabolic profiles. Be aware that nearly all its information is generated in the lab. And it is likely that microorganisms behave quite differently in the wild.
Recently, BacDive has integrated Microbeatlas. The embedded maps of Microbeatlas show the global distributions of 16S sequences of many bacteria (Figure 4).
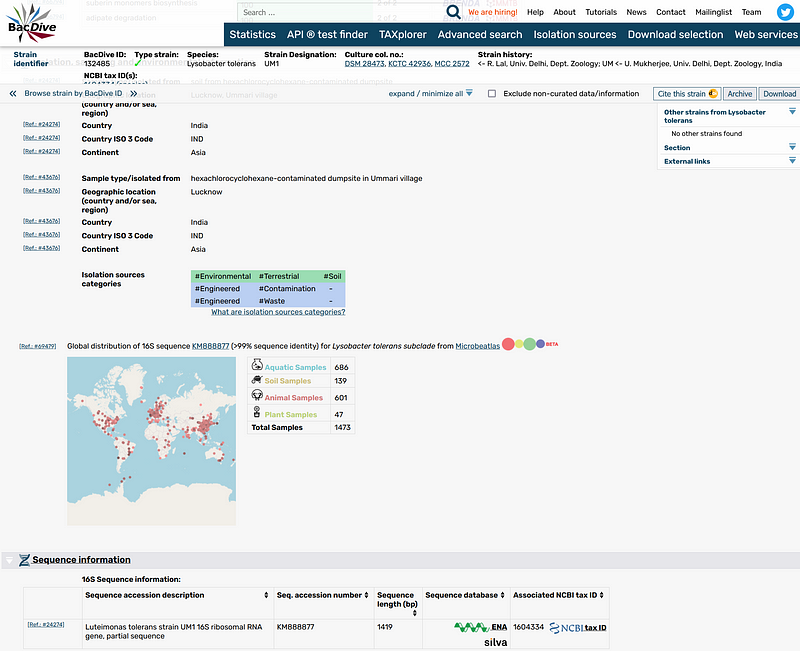
This crossover is great. Now, researchers can not only learn how the bacteria behave in the lab (BacDive) but also where they can be found around the world (Microbeatlas). But we can do more. We can gather the wild metadata from our freshly minted GEE APIs and compare them with BacDive’s lab results. This comparison can show us whether bacteria live differently in the lab and in the wild.
Let’s take the bacterium Rhodopseudomonas palustris R1 as our example. Its Microbeatlas page shows us that this bacterium can be found in a long list of samples (Figure 5).
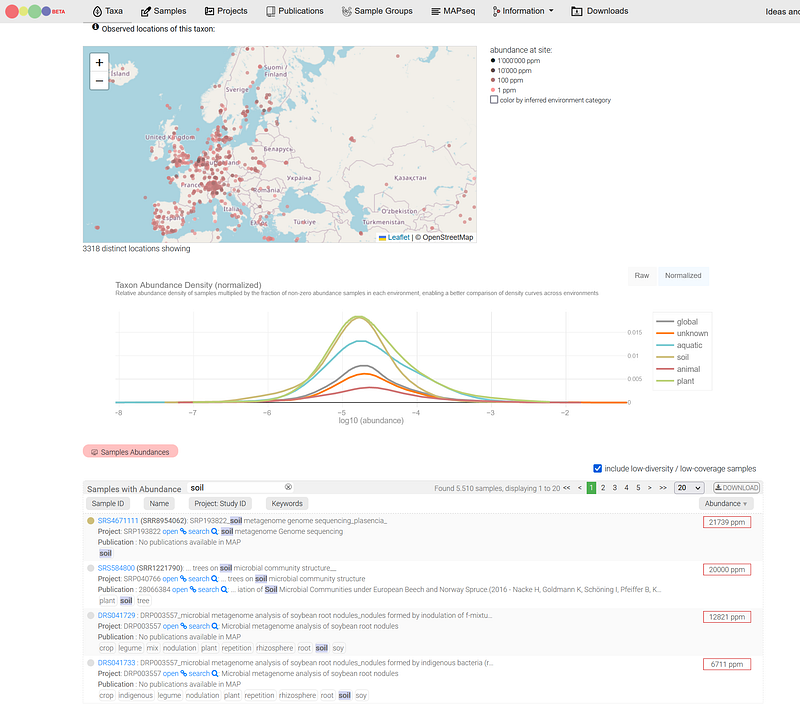
As of 2023–01–05, the DOWNLOAD button in Microbeatlas does not work. So I filtered these samples with the keyword “soil”. And then I examined the top samples and chose those with complete location and time data (Table 1).
With the following Python code, we can get the land temperature and pH values for these samples (also available in my Colab link above).
sheet_id = "YOUR GOOGLE SHEETS ID"
sheet_name = "YOUR GOOGLE SHEETS NAME"

url = f"https://docs.google.com/spreadsheets/d/{sheet_id}/gviz/tq?tqx=out:csv&sheet={sheet_name}"
df = pd.read_csv(url)

api_url = "YOUR ngrok ENDPOINT"

land_temperature_route = "/land-surface-temperature/?"
land_ph_route = "/soil-ph/?"

for index, row in df.iterrows():
    date = datetime.strptime(row["date"], "%Y-%m-%d")

    start_date = datetime.strptime(f"{date.year}-{date.month}", '%Y-%m').date()
    end_date =  datetime.strptime(f"{date.year}-{date.month + 1}", '%Y-%m').date()

    lat = row["lat"]

    lon = row["lon"]

    temp_url = f"{api_url}{land_temperature_route}lat={lat}&lon={lon}&start_date={start_date}&end_date={end_date}"
    ph_url = f"{api_url}{land_ph_route}lat={lat}&lon={lon}"

    temp = requests.get(temp_url).json()["result"]["LST_Day_1km_mean"] -273.15
    ph = requests.get(ph_url).json()["result"]["pH"]

    print (f'{row["sample"]}\t{temp}\t{ph}')
The results are shown in Table 2.
On the one hand, the temperature values of these top five samples range from 11 to 19 °C. They are much lower than the growth temperature of 28–30 °C shown in BacDive. On the other hand, BacDive does not record the growth pH for this bacterium. But our results indicate that Rhodopseudomonas palustris R1 can be found abundantly in acidic soil and thus fill the information gap in BacDive.
Conclusion
This article shows how easy it is to prototype our own RESTful APIs for GEE with FastAPI and ngrok on Colab. With several lines of code, we can set up fully functional APIs for free on the internet. We can now request geospatial results from GEE via simple URLs. Hopefully, these APIs will attract more users and researchers to GEE, too. I have only showcased two APIs in this article. And I encourage you to build more APIs for your projects. You can modify the query string design, too. But be aware that this setup is not scalable. In production, we’d better deploy the APIs on Deta or other cloud infrastructure.
As you can see in the BacDive section, these simple APIs are very useful. We used them to fill the information gaps in BacDive. But why stop there? For example, we can sequence microbial DNA around the world and combine the results with the GEE metadata. These analyses may reveal the environmental factors that facilitate or limit the spread of certain microorganisms. This knowledge can help us fight infectious diseases and contain pandemics.
Data from BacDive is licensed under a Creative Commons Attribution 4.0 International License.


