
Monitor Regional Climate with Google Earth Engine
Create temperature+precipitation time series for a region

We have been struck by an unfortunate string of climate disasters in 2022. It is clear that we need to take immediate action. And before we act, we need data, especially satellite data. They can show us the actual changing Earth. With them, we can make data-driven decisions to promote conservation and preservation.
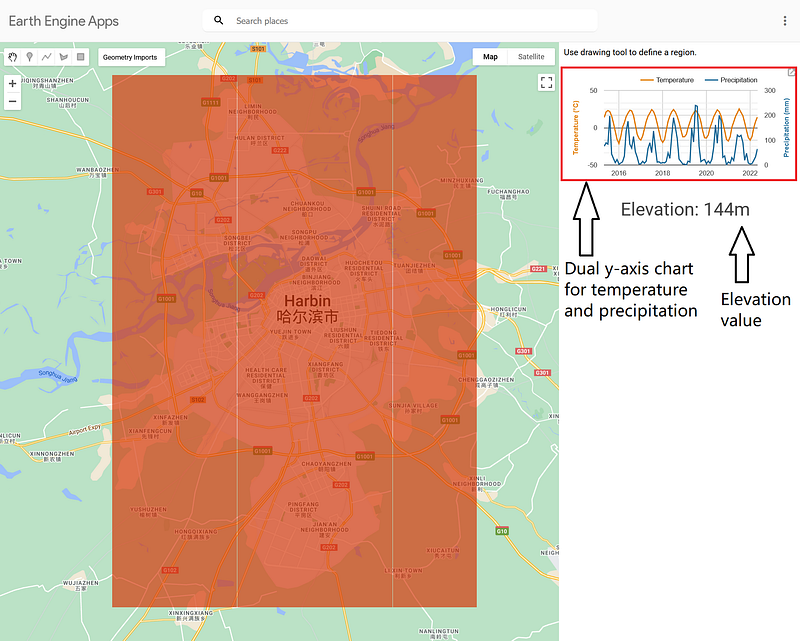
Google Earth Engine is one of the most prominent satellite imagery platforms. It is free for noncommercial use. In my previous articles, I have shown the readers how to make apps to monitor land use changes and vegetation. In this article, I want to show you how to create temperature and precipitation time series over a given region with Google Earth Engine. And I throw in the regional average elevation for good measure (Figure 1).
The code for this project is hosted on my GitHub repository here.
And the finished app is here.
1. The datasets
There are several datasets for temperature and precipitation, such as the ERA5 Monthly Aggregates and ERA5-Land Monthly Averaged — ECMWF Climate Reanalysis (ECMWF/ERA5_LAND/MONTHLY). In this case, I have chosen the latter one because it has better resolution and fresher data.
As for elevation, the options are SRTM Digital Elevation Data Version 4 and NASADEM (NASA/NASADEM_HGT/001). Their measurement results are very close to each other. I have chosen the latter one for its better resolution.
The app takes images from 01.05.2015 to 30.05.2022 into account.
2. The app
This app has the same layout as my previous two. It also has a similar code structure. Whenever the user selects a new region on the map, the generate_collection function retrieves the regional data from ECMWF/ERA5_LAND/MONTHLY. The data are then transferred to the sidebar. Although there are criticisms over the dual y-axis chart, I still like to put one in the sidebar. Moreover, I display the elevation value below the chart (Figure 1).
2.1 The generate_collection function
The generate_collection function is based on the same function from my previous app. The ECMWF/ERA5_LAND/MONTHLY stores the temperature and precipitation values in its temperature_2m and total_precipitation bands.
The temperature from ECMWF/ERA5_LAND/MONTHLY is measured in Kelvin, while the precipitations are stored as daily averages in meters. My code converts the temperature values into Celsius (Lines 5–13). It calculates the monthly average precipitations in millimeters (Lines 14-29) based on the instruction from this site. Finally, it returns the image collection.
2.2 The dual-y axis chart
The generate_chart function produces the time series in the form of a dual-y axis chart. It takes the image collection from the generate_collection function and the user-defined region as arguments.
2.3 The elevation
It is quite easy to get the average elevation of a region in Google Earth Engine.
My code gets a single image from NASA/NASADEM_HGT/001. We need to use the get().getInfo() function chain to retrieve the results from reduceRegion because the latter is a server-side object.
2.4 The control component
The control component puts things together.
The first part of the code defines the sidebar panel. The temperature_chart variable holds the dual-y axis chart, and the elevation_string keeps the elevation value. The refresh function refreshes them both whenever the user selects a new region. When the code is finished, you can publish the app.
3. Test the app
Let’s test the app over three interesting regions.
3.1 Harbin, Heilongjiang, China
I first tested the app over Harbin, China. Harbin is a major city in Northern China. Its summer is comfortable, but its winter is brutal. Every year, the city plays host to the Harbin International Ice and Snow Sculpture Festival — now the largest ice and snow festival in the world (1).
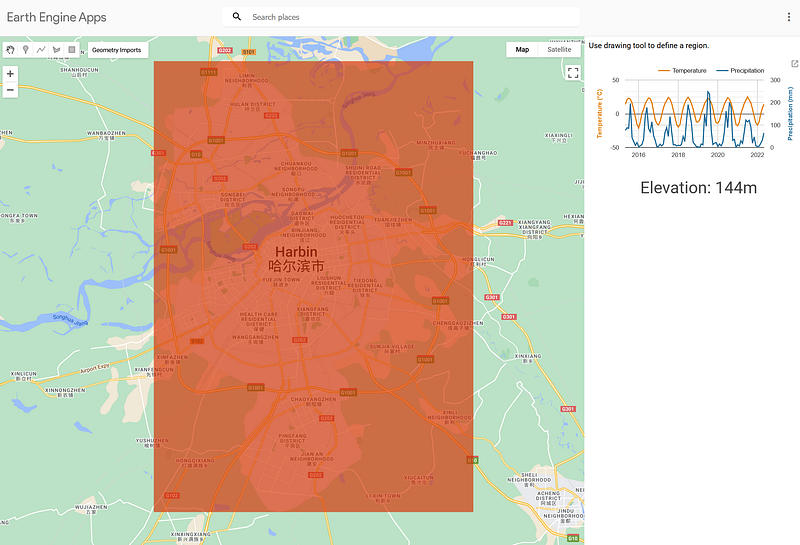
My app is able to get data over Harbin. And this eases the unsubstantiated concern that Google Earth Engine does not work in China. The app shows that its temperature peaked in July and August at around 23 °C and dropped to -20 °C in January each year. Its precipitation rose and fell with the temperature, too.
3.2 Tsunan, Japan
The next test region is Tsunan, Niigata Prefecture, Japan.
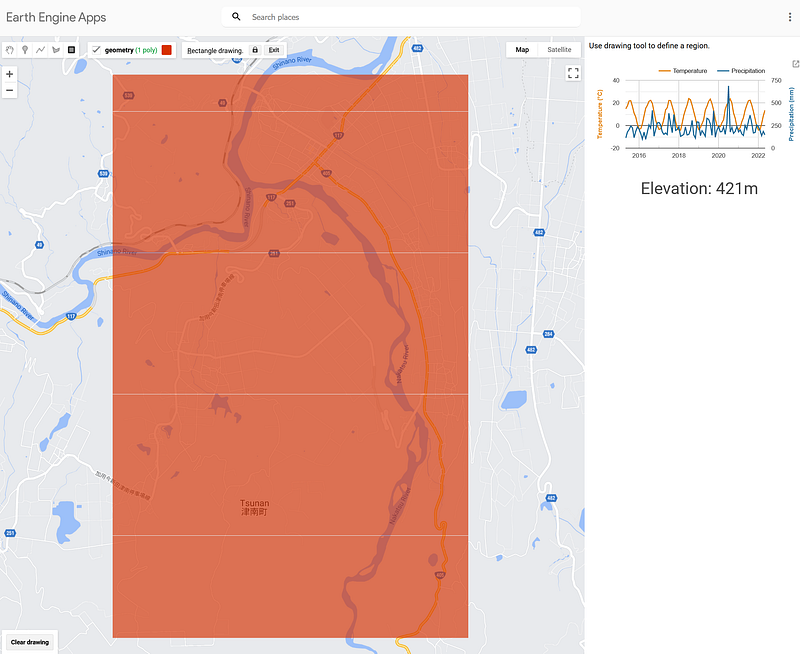

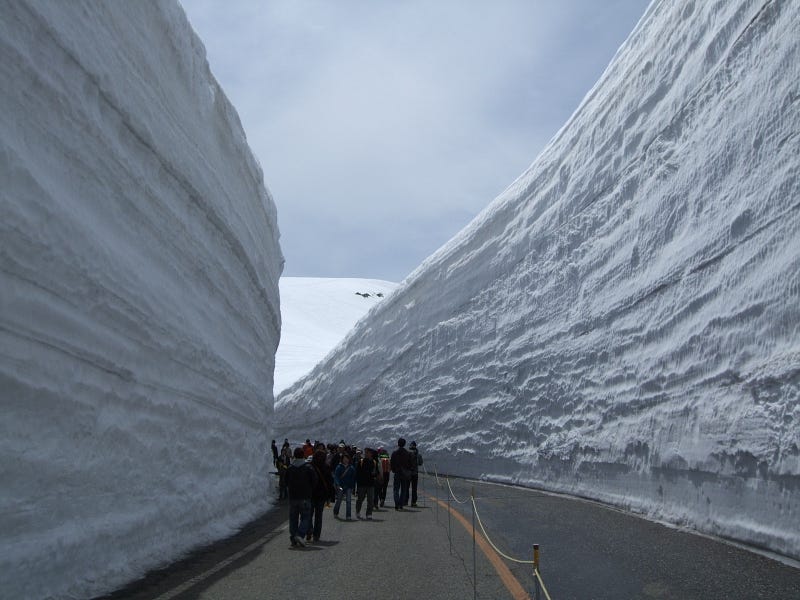
Although its temperature profile looks inconspicuous, this region holds the title of the snowiest town with a population of over 10,000 in Japan. This is because cold air from Siberia blows towards Japan with the moisture from the Sea of Japan in winter. When this wet, cold air hits the Japanese Alps and moves upward, snows are formed. Each year, heavy snow falls on the northern part of Honshu and Hokkaido. This area is also called the Snow Country (雪国) of Japan. And Tsunan sits in its middle. There, a snow depth of 419 cm was observed on February 24, 2022 — an all-time record.
3.3 The Atacama Desert
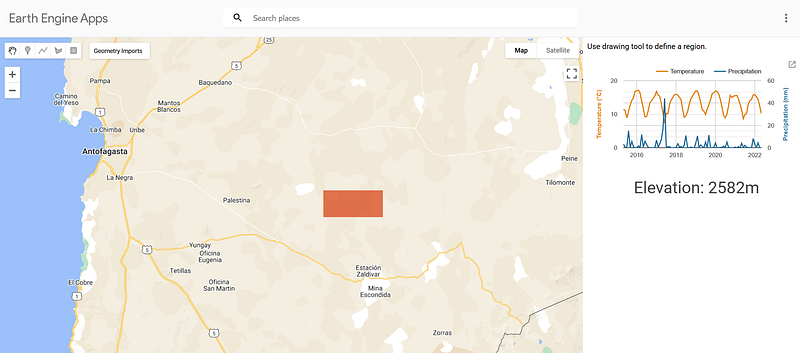
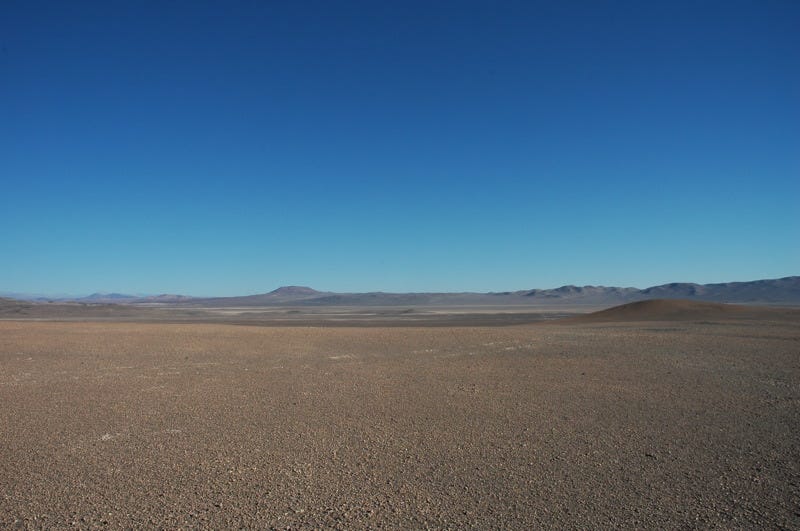
The Atacama Desert is known as the driest and oldest desert on Earth. It is in northern Chile. No rain had been recorded for the past 500 years. But the Spanish National Research Council (CSIC) reported that the situation has changed since 2015. A series of unexpected rainfall occurred. But they have not brought an explosion of life. On the contrary, it decimated the local microbial species. Because these microbes have developed strategies to thrive under the extremely dry environment, the sudden downpour gave them osmotic stress. As a result, up to 85% of the microbes were removed from the habitat (2). And you can see that precipitation series in Figure 4. The blue peak in the figure denotes a rainfall of 44 mm in June 2017 — a relatively large amount of water for the region.
Conclusion
Google Earth Engine is a treasure trove for climate scientists and biologists. From the past to the present and all over the globe, we can learn the land use, vegetation, and climate of a given region with a few mouse clicks or several lines of code. All data exchange and computation take place on the Google Cloud. It is actually a surprise that we haven’t seen more of it in the media or in scientific reports.
Of course, there is always imperfection if we look hard enough. For example, the height of Mount Everest (8848 m) has not been reported correctly in NASA/NASADEM_HGT/001 (8771 m). The pixel size in that dataset is 30 m. 8771 m should be the average elevation of that surrounding region — an area of 900 m². In this case, we sacrifice a little bit of accuracy for faster computation.
You can even assimilate my three apps into one. So the land use, vegetation, and climate of a given region can be displayed in one place. There are many other measurements in ECMWF/ERA5_LAND/MONTHLY, such as soil temperature, runoff, snow albedo, snow cover, and evaporation. So I encourage you to try them. Also, why not play with some new datasets and tell us more about your experience?


