
What’s Behind Google Looker Studio — Unlocking the Power of Data Visualization
Creating your own dashboard using Google Cloud Platform

In today’s world, data is the new gold. It drives businesses, shapes our decisions, and even influences the way we live our lives.
With the vast amount of information generated every second, it’s essential to have tools that help us make sense of it all.
Right?
That’s where data analytics and visualization come into play, turning raw data into meaningful insights.
And today, I am talking about one of my favorite tools! :)
Google Looker Studio
In this article, I’ll uncover the power of Google Looker Studio, a cutting-edge data visualization tool, and how it integrates with the Google Cloud Platform to make sense out of data.
So, let’s discover it all together! 👇🏻
Diving into the concept of a Dashboard
Dashboards are visual representations of data, often in the form of graphs, charts, and tables. They provide a comprehensive, at-a-glance view of critical metrics, making it easier to monitor performance, identify trends, and make data-driven decisions.
However, I know what you might be thinking right now — analyzing data is nice, but…
Where’s this data coming from?
There is a critical step in the construction of any Dashboard — and it is precisely assessing where data comes from.
Or as we — data geeks — say it…
Data Ingestion
Imagine data ingestion as an exciting journey, where we collect, import, and process data from various sources, all to make it ready for some analysis and intuitive visualization.
Creating a strong pipeline to transport data to the visualization platform is essential. It’s like building a solid bridge to prevent your dashboard from crashing, ensuring it stands strong even when the tides of data change.

Some platforms take care of both data storage and provide the tools to craft a dynamic dashboard, giving you the power to see your data come to life right away in the same environment.
Google Cloud Platform is a shining example of such a platform, allowing you to deploy all the processes — from collecting and storing the data to displaying it.
So the following natural question would be…
What is Google Cloud Platform?
Google Cloud Platform — or GCP for friends ;) — is a suite of cloud computing services offered by Google. It provides infrastructure, platform, and software services that help businesses and professionals alike to build, deploy, and scale applications and services on Google’s robust infrastructure.
One of the things I love most about the Google Cloud Platform is how intuitive and powerful all its services are. It includes a wide variety of tools and services for storage, data analytics, artificial intelligence, and machine learning.
The best part of it all?
GCP has a free tier for most of its products, so using it will be at no cost while keeping the usage within some limits.
By using GCP, anyone can harness the power of Google’s advanced technologies to analyze and process data — leading to more efficient and informed decision-making.
So let’s break down what services we need to create our very own dashboard.
Breaking down the Google Cloud concept
To harness the power of Looker Studio, you need to understand its integration first with Google cloud functions and BigQuery.
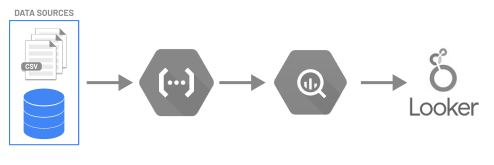
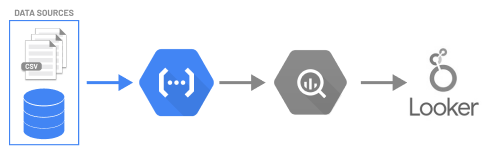
The main idea here is that we want to fetch some data and create a safe pipeline that goes all the way up to our dashboard. Hence, the natural steps are:
- First, we should know what data we want to ingest — and its data source.
- Fetch this data into our GCP environment using Cloud functions.
- Storing this data into our data warehouse BigQuery.
- Push our data into Google Looker studio and start displaying it.
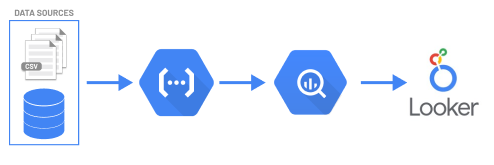
And our final pipeline looks something like this.
#1. Google Cloud Functions
Google Cloud Functions is the secret sauce that can spice up your dashboard experience by enabling you to fetch and process data from virtually anywhere.
Google Cloud Functions act as a bridge between our data source and Google BigQuery.
Whether you want to access APIs, databases, or other web services, Cloud Functions lets you write custom Python code to retrieve the data you need, process it, and push it to our Google environment so it can end up in Google BigQuery seamlessly.
#2. Google BigQuery
BigQuery is a fully-managed and serverless data warehouse that enables super-fast SQL queries using Google’s infrastructure. It allows to store, manage, and analyze massive amounts of data with ease.
The magic of BigQuery lies in its ability to quickly process and analyze vast datasets using SQL-like queries, all while delivering exceptional performance. Its seamless integration with Google Looker Studio means you can effortlessly push data from BigQuery to create stunning, insightful dashboards and reports.

#3. Google Looker Studio
Google Looker Studio is a powerful data visualization and analytics tool that enables users to create interactive, customizable dashboards. Looker Studio is part of the Looker platform, which is integrated with GCP.
This integration allows users to leverage the full suite of Google’s cloud-based tools and services.
The seamless integration of Google Cloud, BigQuery, and Looker Studio means that users can easily and efficiently move data between these services — and create robust data pipelines fast.
Looker Studio Main Features
Looker Studio comes with a variety of features that make it an attractive choice for data visualization and analytics.
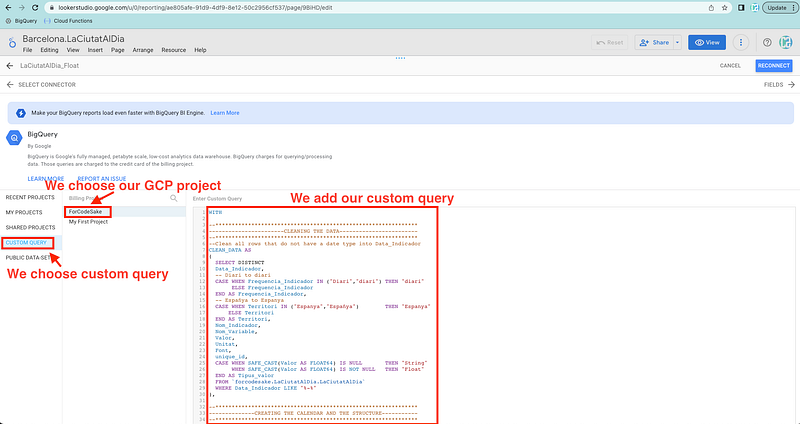
1. Customized SQL-like queries
Users can easily pull data from BigQuery by creating their own SQL queries within the dashboard. This is extremely useful to compute in real-time without the need to store any calculations.
And personally talking, being able to use native SQL to manipulate data is extremely useful and time-saving :D
When we want to add some data, the main option is to get it directly from BigQuery using a SQL query. First, we choose the BigQuery data source.
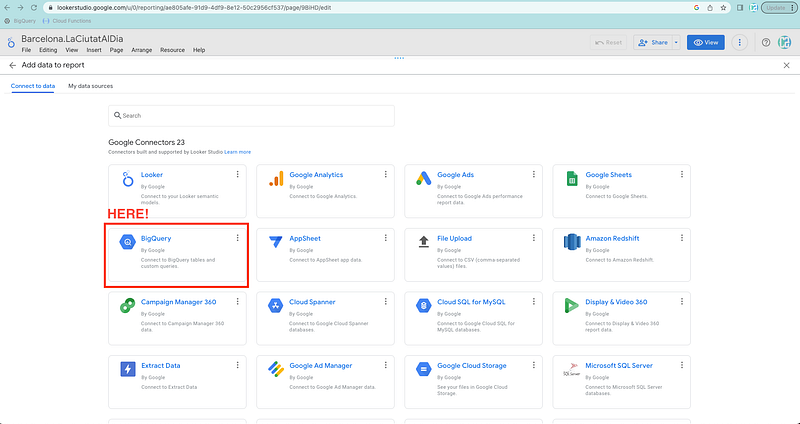
And then we can easily add our custom SQL query to push our data into the dashboard.
2. Drag-and-drop interface
Users can easily create and customize dashboards using the drag-and-drop functionality, without the need for extensive coding knowledge.
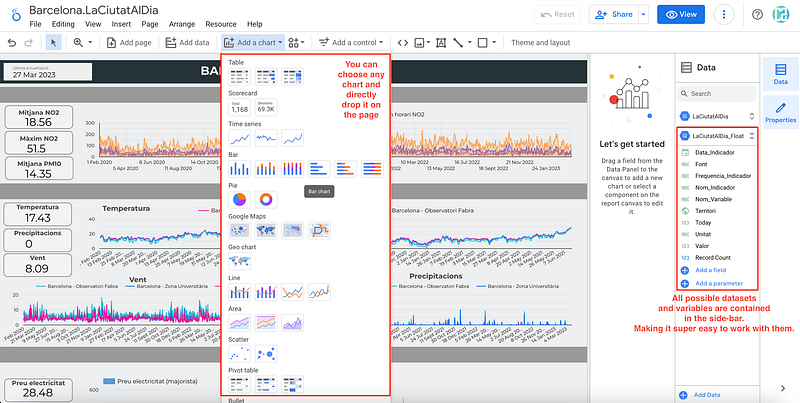
As you can observe in the following gif, creating a chart is as easy as dragging a chart element and choosing what variables you want on it.
3. Data exploration
Looker Studio allows users to explore their data using a point-and-click interface, making it easy to drill down into specific data points and discover hidden insights.
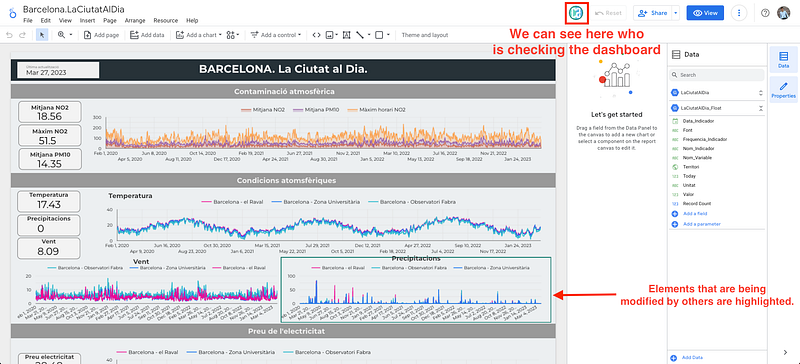
4. Collaboration
Share dashboards with other team members or even clients — anyone that has a gmail account can contribute!
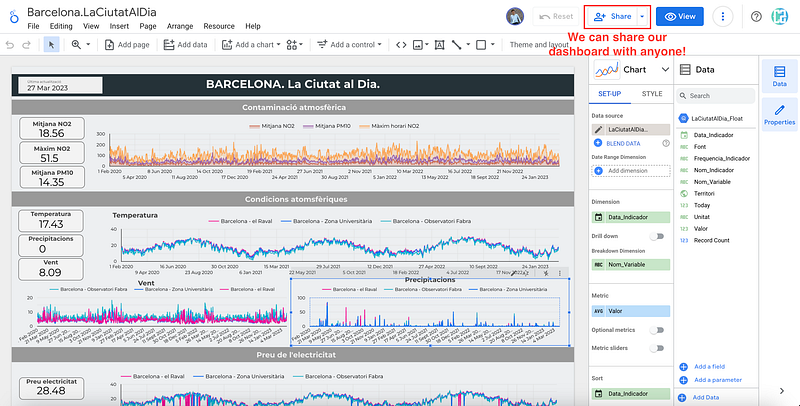
This is extremely useful when collaborating with others. You can share your dashboard with any other person and you can work together — at the same time — in the dashboard. Enabling collaboration with others nowadays is of utter importance.
5. Customization
Looker Studio offers a wide range of visualization types and customization options, allowing users to create dashboards that best represent their data and tell a compelling story.
Main Conclusions
Data is the driving force behind countless decisions made by individuals and organizations worldwide. To make sense of this data, we need powerful tools like Google Looker Studio to transform raw information into actionable insights.
Google Cloud Platform provides the infrastructure and tools necessary to store and manage this data.
This powerful combination empowers you to create dynamic, data-driven dashboards and reports, showcasing insights from a wide range of sources.
So, let your imagination run wild and bring your data to life by harnessing the limitless capabilities of Google Cloud Functions and Google Looker Studio.
Let’s put this into action in the following article!
Don’t forget to follow ForCode’Sake to get more articles like this one! ✨

Did you like this article? Then you can subscribe to my DataBites Newsletter to stay tuned and receive my content right to your mail!
I promise it will be unique!

You can also find me on X, Threads and LinkedIn, where I post daily cheatsheets about ML, SQL, Python and DataViz.
Some other nice medium related articles you should go check out! :D


