
Creating a Google Looker Studio Dashboard — Populating it with data
A step-by-step guide on building an automated process to update a Looker Studio dashboard
In the ever-evolving world of data visualization, businesses are always on the lookout for the most effective tools to harness the power of their data.
Google Looker Studio Dashboard is one such game-changers that make data exploration and analysis a breeze.
But how do you create a stunning Looker Studio Dashboard and populate it with the data you need to make informed decisions?
In this article, we will walk you through the process of filling a Looker Studio dashboard with essential data and creating an automated process to update it regularly that will propel your projects to new heights.
So, are you ready to dive into the world of data-driven insights?
Let’s discover it all together! 👇🏻
One of the easiest — and most effective — ways to populate a dashboard with data is by setting up our data pipeline in the GCP environment, integrating Google Cloud Functions and BigQuery with Looker studio.
I will assume that you already have a GCP account. If not, you can easily open one following these steps. Remember that all services that we will use during this tutorial have a free tier, so it will be at no cost.
First things first… what data are we going to use?
Barcelona — the up-to-date city
In this article, I will be working with the “Barcelona — the up-to-date city” Dataset for illustrative purposes.
This dataset contains information about Barcelona city that is updated on a daily basis. This dataset contains different information regarding the city such as meteorology, traffic and economy information among others.
The dataset consists of a .csv file with one entry per aspect a day. It can be found at the council city webpage, and we will get it using Python with the provided static link.
Our Goal
The final goal of the project is the construction and design of a Dashboard with the updated city information so people can check the data.
This article is the 2nd part of this prject, and it will mainly focus on the population of this dashboard with data.
That is why in this article our goal is to first build a successful Data Ingestion pipeline to make data available at the desired platform.
So let’s divide the tasks into 5 different steps 💥
#1. Setting up GCP and creating a new project (if required)
The first thing we need to do is creating a new project — in case you don’t have one already created. To do so, we just go to the top of GCP main view.
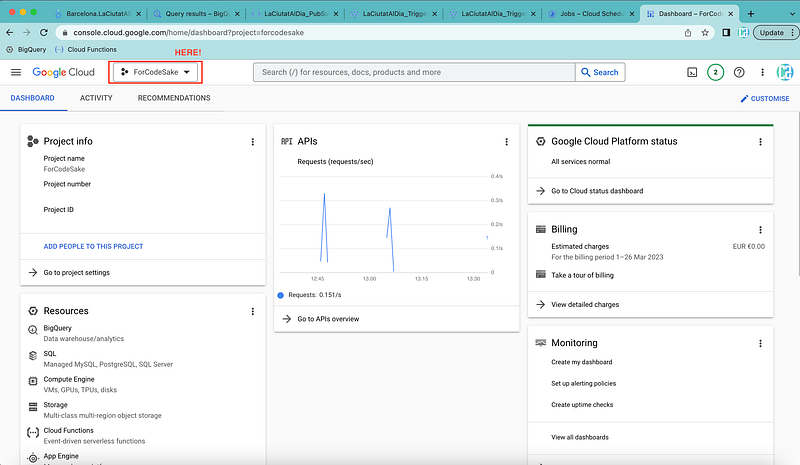
Get into the project selector on GCP and click on it.
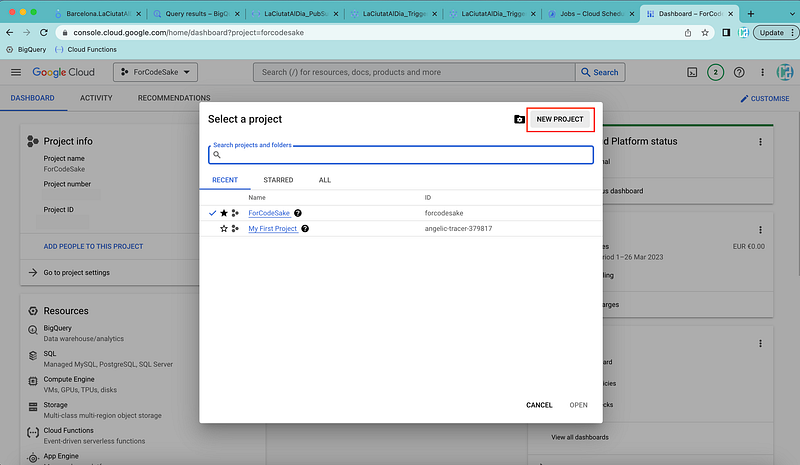
Once clicked on it, a pop-up like this should appear.
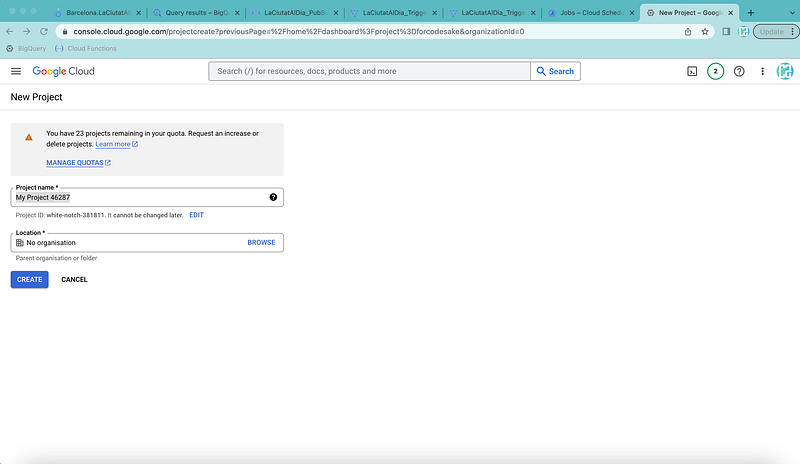
You can call this project as you prefer. In my case, I will be working under the ForCodeSake project.
Now it is time to…
💭 Recall our data pipeline concept
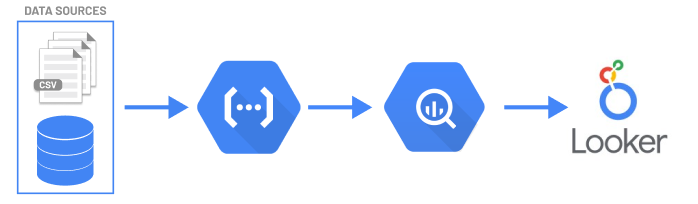
We intend to regularly retrieve data from an external data source and then transfer it into a BigQuery table. As described in the previous article, one possible way to achieve this is by taking advantage of the GCP environment and creating the following structure:
- A Python script able to query the external data from our Data Source.
- Encapsulating this Python script into a google Cloud Function that is able to update a BigQuery table with the new info available.
- Create a Looker Studio dashboard that uses the BigQuery table to display the data.
However… don’t you think something is missing?
In order to update regularly our dashboard, we need to keep pushing data into BigQuery. There’s where an additional Google service comes in.
- To make our push of data periodical, a Pub/Sub message that triggers the function is required.
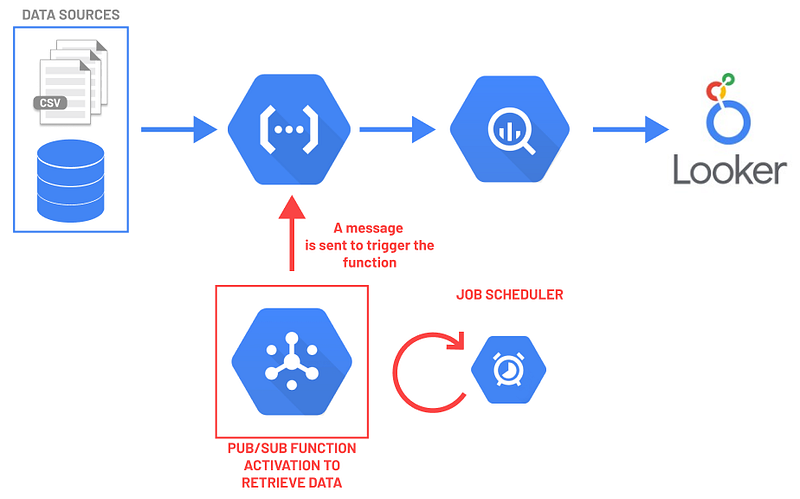
- Broadcasting a Pub/Sub message every day (let’s say at 10am!) that will be populated within the project.
Thus, every time the Pub/Sub message is sent, the Cloud Function will execute the Python script and update the BigQuery table.
Easy, right?
So let’s put all these concepts into practice.
#2. Data Preparation
The first thing we need to do is to get our data. As we stated before, we have a static link that contains the CSV file and we can easily get the data from there using Python.
1. Libraries required
- pandas: Powerful, open-source Python library designed for data manipulation and analysis.
- json: Allows us to encode and decode JSON strings.
- requests: User-friendly HTTP library. Simplifies data fetching and sending.
- gbq: Google BigQuery integration with pandas. Enables querying and loading data.
- io: It is a module for handling input/output operations involving streams and files.
2. Defining our CSV file URL and converting it into a DataFrame.
We first define the CSV_URL variable and get the data. We use the requests library to fetch the data contained in the CSV file and convert it into a pandas DataFrame.
3. Sanity check of the data
We check the data is correct and deal with the NaN values from the value column — which contains the indicators.
We define a unique identifier for each row so it is easier to manipulate data.
4. Connecting to our GCP environment
We first define the project, the dataset_name and our table_name. Then we just connect to BiqQuery to upload our data.
The final code can be found in the following GitHub repository.
#2. Defining our PUB/SUB function
Going back to our GCP environment, once your project is created, the real fun can start! ;)
Our new project comes with some already-embedded features — like BigQuery — but we need to activate some additional APIs.
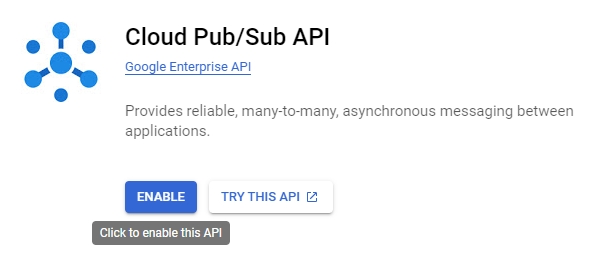
The first one we should look for in the search bar is Cloud Pub/Sub API, as this one is not activated by default.
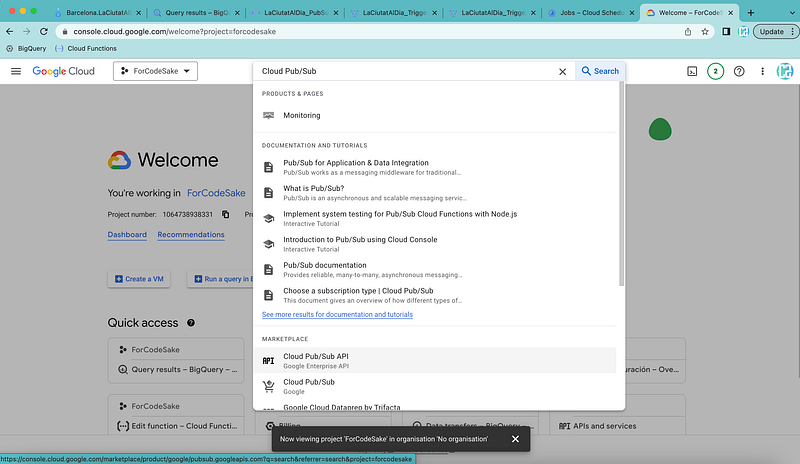
After reaching the corresponding page, we simply enable the API.
Now we need to create a Pub/Sub topic to activate our function. It is as easy as selecting the create topic button.
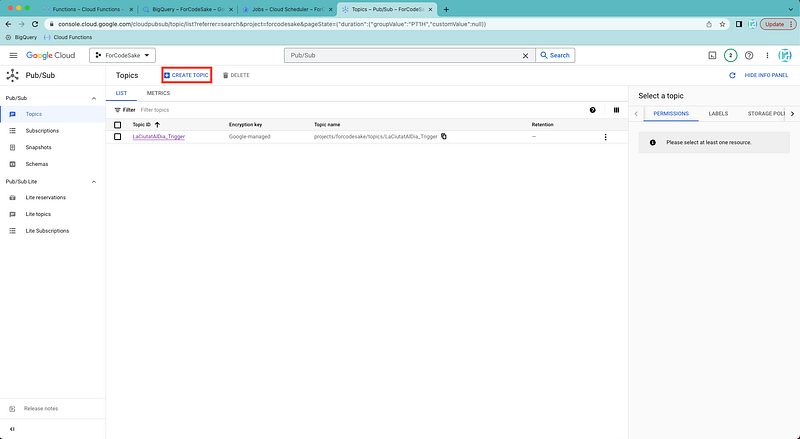
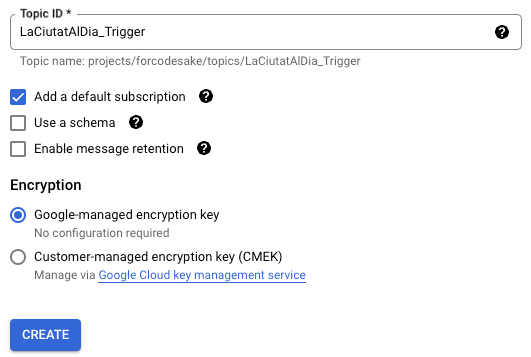
We add the name we prefer, and that’s it! We got a Pub/Sub function! :)
However… we need to define how frequently this Pub/Sub submits a message to activate our Cloud Function function. This is where the Cloud Scheduler comes in.
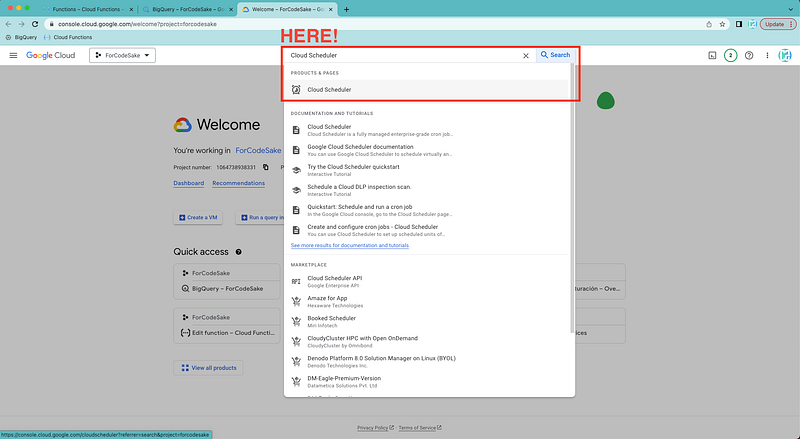
Creating a job with Cloud Scheduler
We can easily reach the Cloud Scheduler service using the search bar.
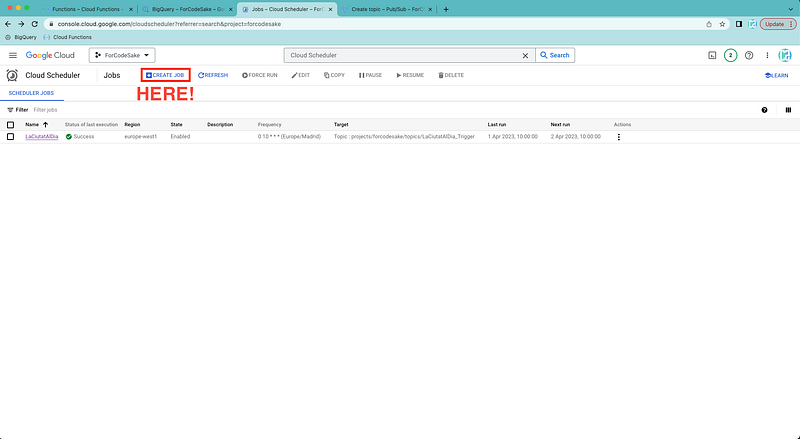
We select the Create Job button again.
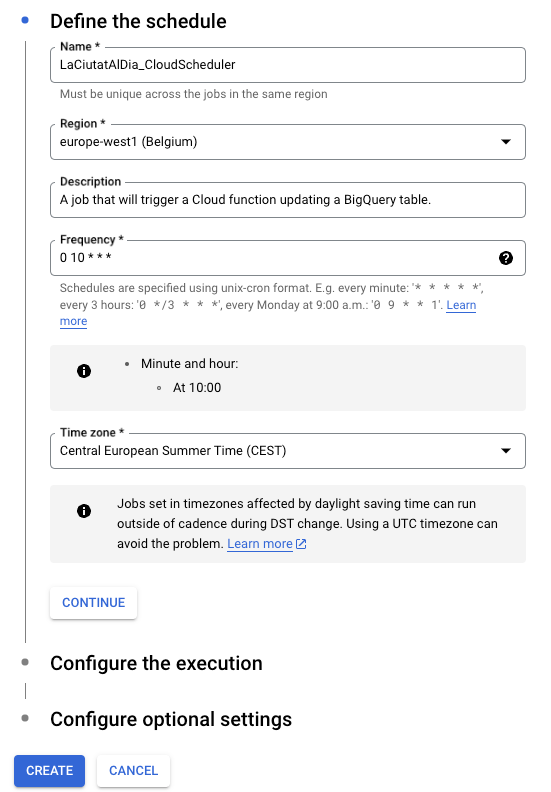
And then we create a new job and start by defining:
- The name of the job
- Region where it is executed.
- Some description to understand why we need it.
- Its frequency, specified under the Unix-cron format — ⚠️ If you are not familiar with it, you should check CronGuru.
- The time zone.
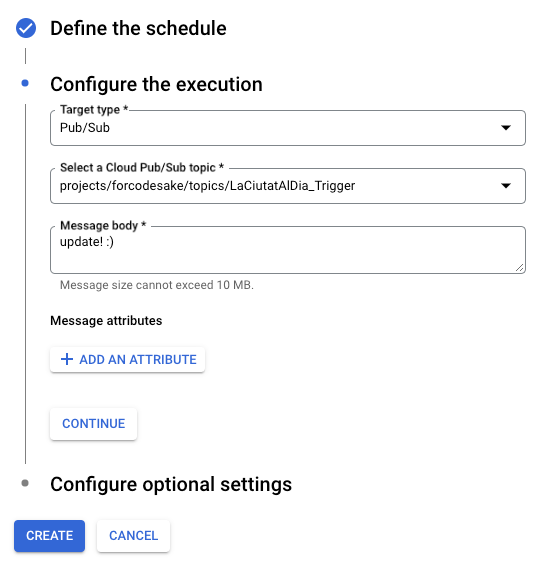
We also have to define the type of target that will be executed — in our case the Pub/Sub. After this, we picked the LaCiutatAlDia_Trigger topic that we just created in the previous step.
We will not use the message body specificities so you can put whatever you want. In my case, I will add “update! :)”
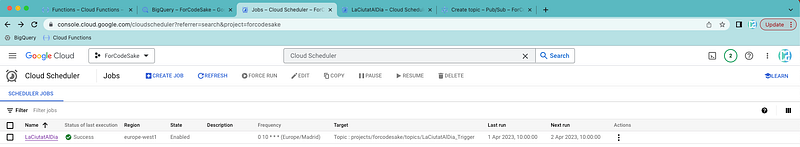
Once created, this new job should appear in the list, with its next scheduled execution indicated in the Next run column.
#3. Creating a Cloud Function
Before starting to deal with our Python code and Google Cloud functions, we need to perform an initial step. If you remember, we defined a Dataset and table_name in our Python script — so we need to make sure the Dataset exists so we can create a table under it.
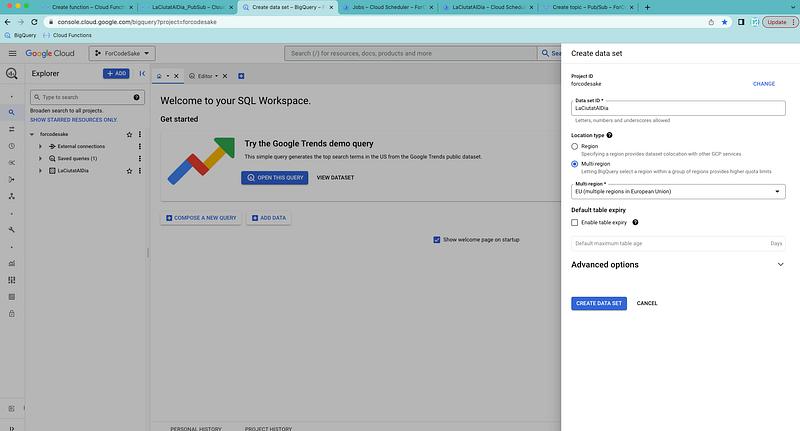
To do so, we just need to go to BigQuery and create a new dataset.
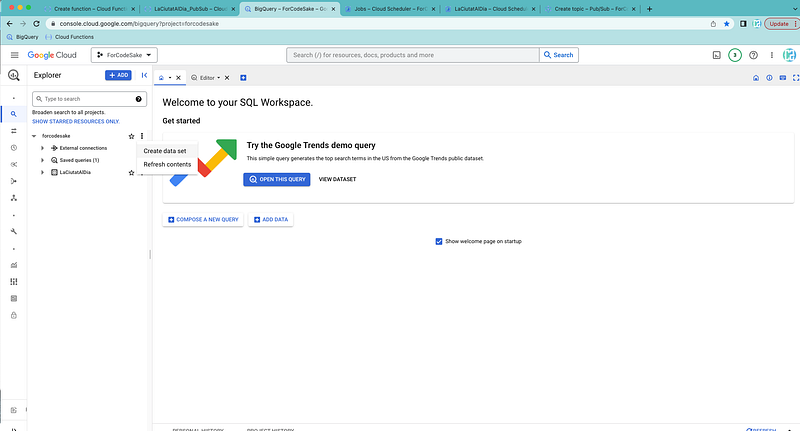
We define the characteristics of this dataset. In my case, I called it LaCiutatAlDia.
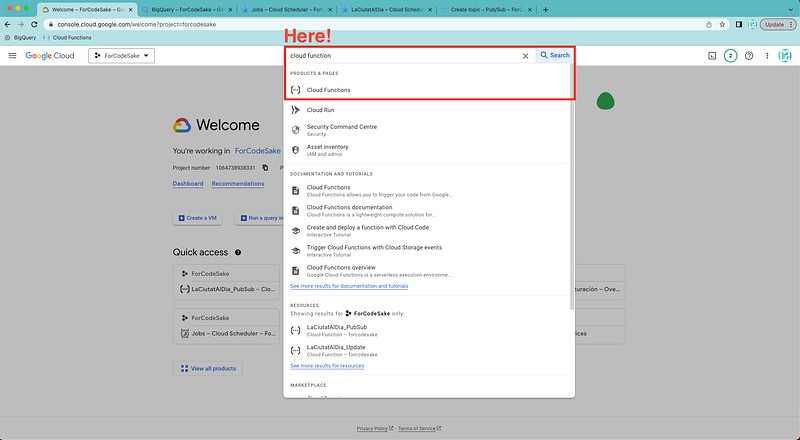
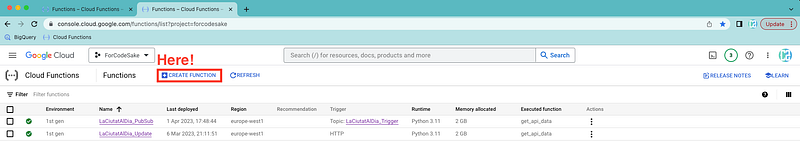
We can navigate to the Cloud Functions page through the search bar and click on Create Function.
⚠️ Google might ask you to activate additional APIs such as CloudFunctions.
Cloud Functions can be considered as small containers that will execute the code within them. They support different languages such as: .NEt, Go, Java, Node, PHP, Python, or Ruby.
In our case, we will use Python. We first need to crete a new function.
We create a function called LaCiutatAlDia_update, triggered by Pub/Sub messages of the BarcelonaAlDia trigger.
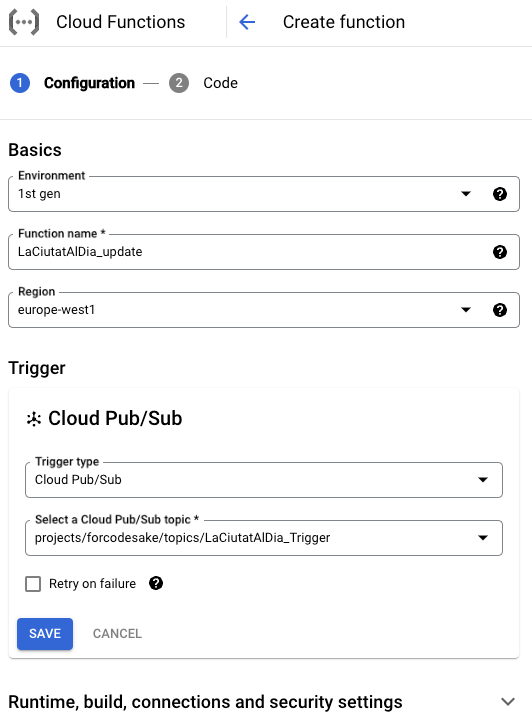
Once the configuration is done, we need to choose the corresponding language. We choose Python 3.11.
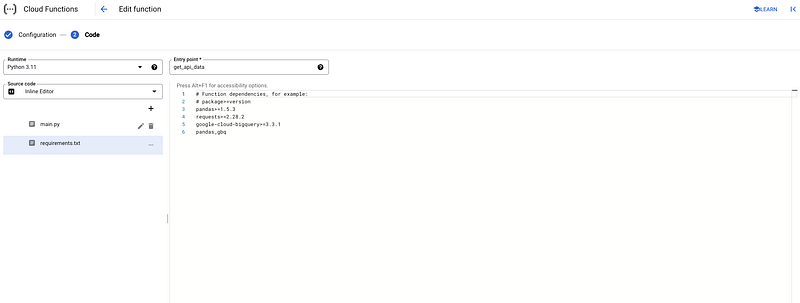
Any Google Cloud function always has two different files. A main.py file with the python script and a requirements.txt file where all required libraries are defined.
It is now only a matter of copy-pasting the code hosted in my GitHub for:
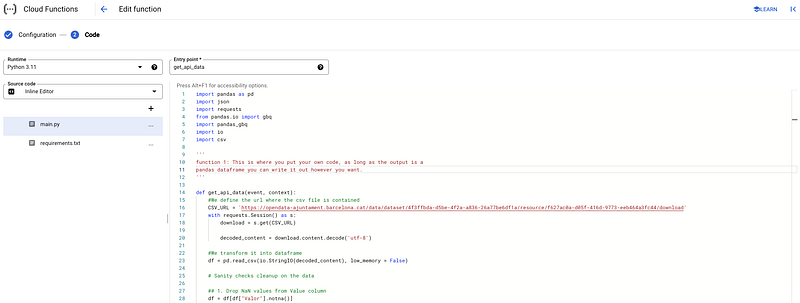
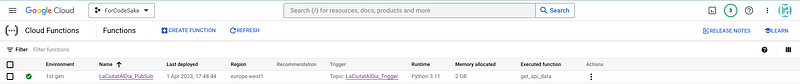
We click on Deploy and wait for the Cloud Function to be active.
As we want to make sure that the function is working well without waiting for the Pub/Sub message, we can check it out using the Test function to run it indmediately.
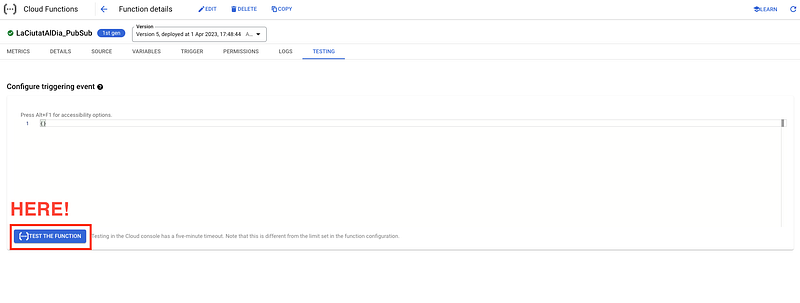
If the function is working properly, we will se the following message. For further info, we can always check the logs.
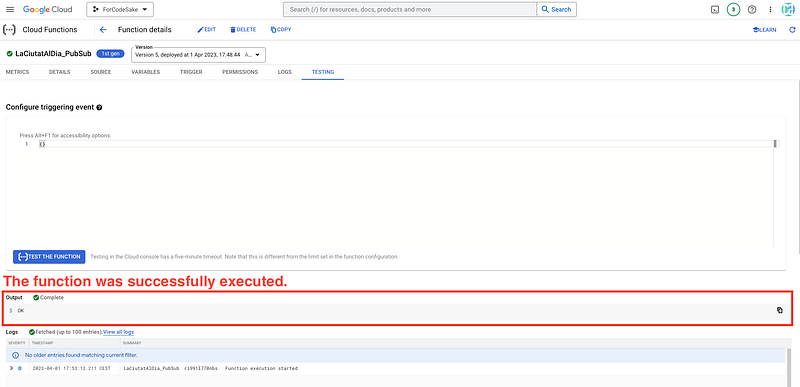
We can go to sleep 😪 and wait until the next morning to check whether the morning update went well.
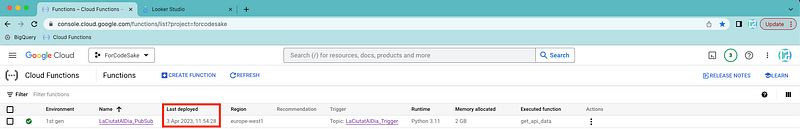
It worked!
⚠️ To make the code as simple as possible for this article, the Python script completely erases the table content and updates it with all available data every time. This is not the best way to optimize resources.
In production, we should work in delta mode, only retrieving new records from the API since the last update and transferring them to the table.
#4. Opening Up BigQuery
We go back to BigQuery page and check our dataset. In this case, at first we can already see that the new table has appeared under our dataset.
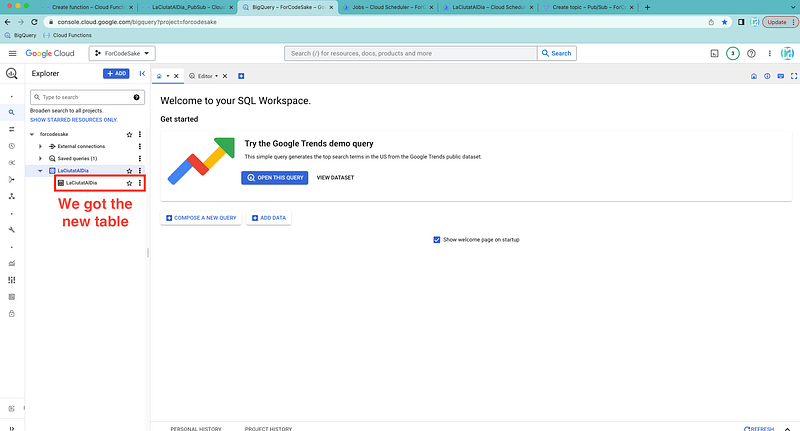
If we check the table, our data has been succesfully pushed into our GCP environment.
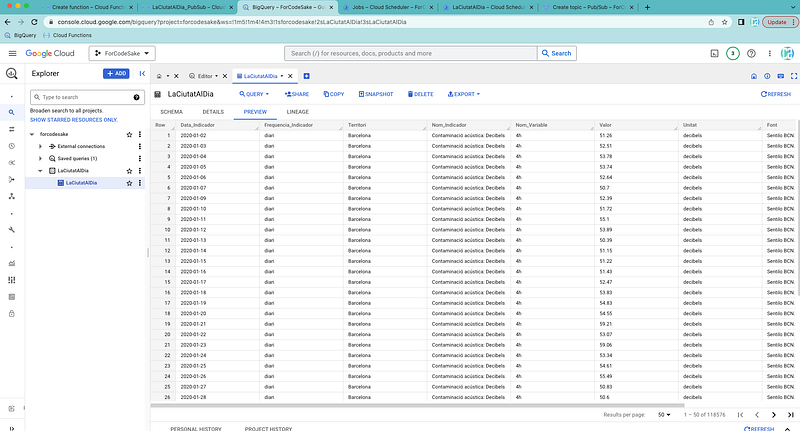
There is no need for any additional work, the BigQuery will be updated every day with no further action.
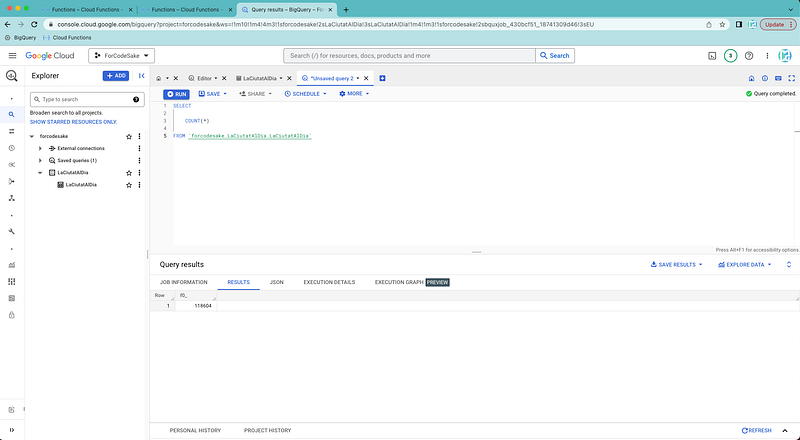
BigQuery allows us to use SQL queries to deal and manipulate this data. This is extemely useful to make some modifications or add some additional columns.
For instance, we can check how many rows have been uploaded.
#5. Google Looker Studio
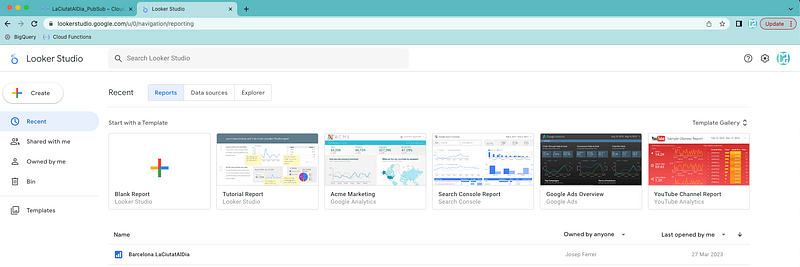
As our final step, we need to define a new Looker Studio dashboard and puplate it with data — as it is our final goal for this article. We can open the Looker Studio main page.
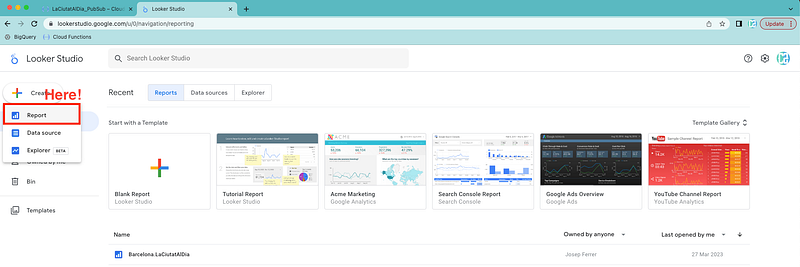
Press the button to create a new report.
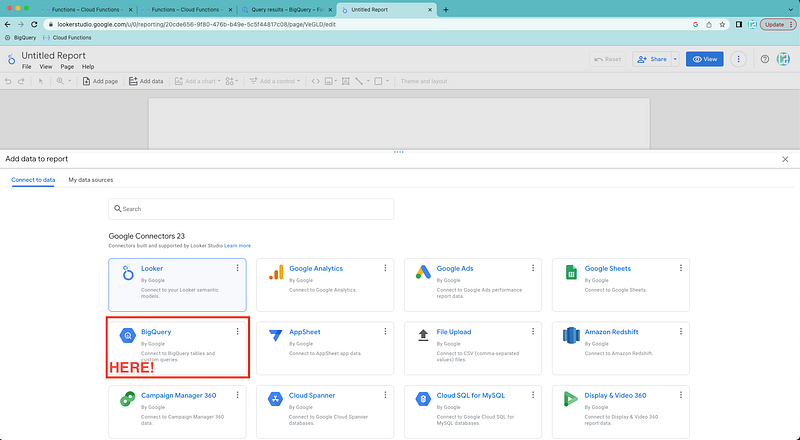
Now we just need to pick the BigQuery data source.
As usual, I tried to identify all required steps.
Do not hesitate to revert to me should there be any missing instructions in my tutorial!
Don’t forget to follow ForCode’Sake to get more articles like this one! ✨

Did you like this article? Then you can subscribe to my DataBites Newsletter to stay tuned and receive my content right to your mail!
I promise it will be unique!

You can also find me on X, Threads and LinkedIn, where I post daily cheatsheets about ML, SQL, Python and DataViz.
Some other nice medium related articles you should go check out! :D


