
What’s Behind Elasticsearch? — Unlocking the Power of Data Visualization
Creating your own dashboard using Elasticsearch
In today’s data-driven world, data is being generated at an unprecedented rate. However, raw data can be difficult to understand and interpret.
Dashboards are popular nowadays since they provide a way to present data effectively, allowing users to see key performance metrics at a glance and drill down into more detailed information when necessary.
But, what is really a dashboard? How can we generate one? Which are the most used platforms?
Let’s dive deep!
Behind the Dashboard Concept
A dashboard is a visual interface that displays important data in an easy-to-understand format. Its purpose is to help users monitor and analyze complex data quickly, identify patterns, and make informed decisions based on insights gained from the data.

Dashboards can be static or dynamic depending if the data is updated or not during the life-time of the dashboard:
- Static Dashboards: They are normally used to provide historical analysis or reporting on a particular set of metrics.
- Dynamic Dashboards: They provide users with up-to-date information about a certain topic, even in real-time.
So it seems it is all about visualizing data, right? I am afraid it is not! There is a critical step in the construction of a Dashboard.
Any guesses?
Right, every dashboard needs its data source!
It is critical to make sure that the data to visualize actually “reaches” the dashboard, and this is where the concept of data ingestion comes in.
Data Ingestion
Data ingestion is the process of collecting, importing, and processing data from the required sources and preparing it for analysis and visualization.
Building a robust pipeline for sending the data to the visualization platform will prevent your dashboard from multiple crashes, making it resilient to changes in data.
There are platforms incorporating both the storage of the data and the tools to generate the dashboard, so that the visualizations quickly build-up from that data in real time. Elasticsearch is one of those platforms, since it serves both as a Data Store and as a Data Visualization Platform.
Selecting the appropriate platform is up to you! But I have to confess that Elasticsearch is one of my recommendation due to its versatility :)

Data Visualization Platforms
The optimal platform for creating a dashboard depends on the type of dashboard and the target data source. Let’s see some examples:
- When the dashboard is static or it is not frequently updated, Tableau, Power BI, or Google Data Studio are good options.
- For a higher update frequency or live data, platforms such as Elasticsearch, Kibana, or Splunk are normally used.
These latest platforms are very popular for live data dashboards, since they also help to collect, analyze, and visualize real-time data from various sources. In addition, these platforms often have built-in features for creating visualizations and alerts based on real-time data.
Knowing how to use those platforms is a must-have in the data world since they allow you to create a data visualization in very few steps!
Let’s explore together the concepts behind Elasticsearch, so that you can also incorporate this platform in your Swiss-knife of data tools.

Get Started to Elasticsearch
Elasticsearch is a distributed, scalable, and highly available analytics engine that enables efficient storage, retrieval, and analysis of large volumes of data. It uses a distributed storage system to store and index data, which allows for fast and efficient data retrieval.
It supports various data types and formats and provides powerful search capabilities such as full-text search and faceted search, among others.
How to use Elasticsearch
There are several options to use Elasticsearch for free:
- Self-Hosting: You can download the Elasticsearch software from the official website and install it on your own machine or server. This is completely free, but you will need to have some technical knowledge to set it up and maintain it.
- Cloud Services: Many cloud providers such as Amazon Web Services (AWS), Google Cloud Platform (GCP), and Microsoft Azure offer Elasticsearch as a managed service. These services offer a free tier with limited resources that you can use to test or develop your applications.
- Elastic Cloud: Elastic, the company behind Elasticsearch, also offers a managed Elasticsearch service called Elastic Cloud. They have a free 14-day trial that you can use to test the service. After that, you will need to choose a pricing plan that suits your needs.
Basic Concepts
Here are some of the basic concepts in Elasticsearch that are useful to get started quickly in the platform:
#1. Index
An index is like a table in SQL. It is a logical namespace that groups a set of entries together.
[ 🤔 ] You can think of it as if the rows for multiple csv files were directly stored in Elasticsearch, and the index is the way to group again all the rows that belong to the same table.
#2. Document
A document is a basic unit of information in Elasticsearch.
[ 💭 ] It is the same concept as the row in a table in a traditional database.
Each document has a unique identifier (ID) so that you can update the information on that row. A document is composed by fields, which are essentially key-value pairs that store the desired information.
#3. Query
A query is a way to search for specific data in Elasticsearch. It allows you to specify search criteria and retrieve the documents that match those criteria.
[ 💪🏼 ] Elasticsearch supports a wide range of queries, including term queries, match queries, range queries, bool queries, and more.
Using the query function, one can group together the set of documents that have a property in common.
#4. Aggregation
Aggregations in Elasticsearch are used to perform calculations on data and summarize the results.
[ ➕ ] You can use aggregations in a very straight forward and intuitive way to generate statistical summaries, compute histograms, group data by terms, among others.
Aggregations are specially useful when building the visualizations of the dashboard.
Concepts are fine, but where can we use them?
Elasticsearch Interface
Finally, it is also useful to know the more important tabs in the Elasticsearch web interface:
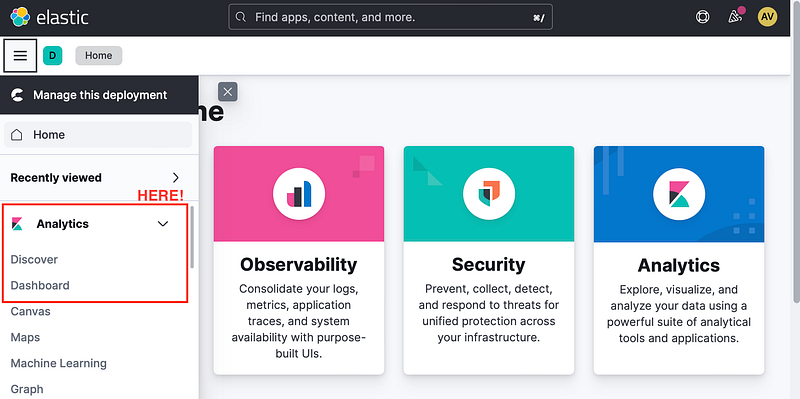
- The Discover tab, for visualizing the raw ingested data.
- The Dashboard tab, for its further representation in visualizations.
Both tabs can be found under the Analytics section in the left-hand navigation panel:
Discover
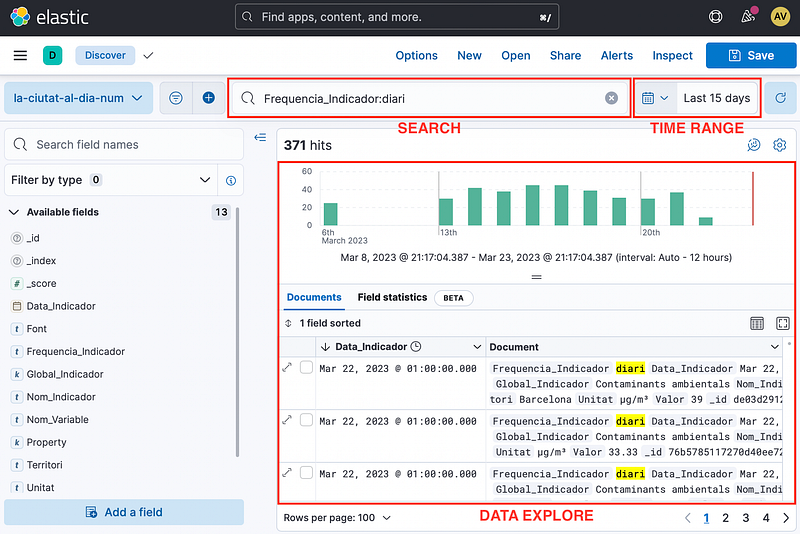
The discover tab consists on a user interface that simplifies data exploration and search within Elasticsearch. It allows users to effortlessly visualize and query their data. Some of the key features and functions of the Discover tab are:
#1. Data Explore: You can explore your data by browsing through the available fields and documents in your indices. It provides a table view of your data that you can sort and filter to find the information you are interested in.
#2. Search: You can use the search bar to query for specific data using the query syntax.
#3. Time Range: It also supports selecting a specific time range for your search, which is especially useful for time-series data. You can select a range of time using a slider, or by specifying a start and end time.
Overall, the Discover tab in Elasticsearch is a powerful tool for exploring and analyzing your data stored in Elasticsearch indices. It provides a user-friendly interface that allows you to quickly search and explore your data, making it easier to find insights and make informed decisions.
Dashboard
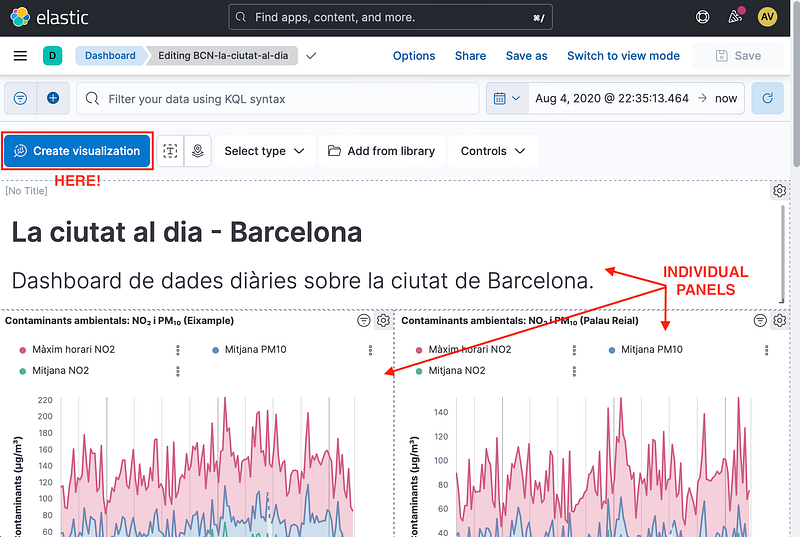
The Dashboard tab in Elasticsearch Cloud allows you to create and manage visual dashboards that help you monitor and analyze your data in real-time. Here are the basic steps to navigate in this tab:
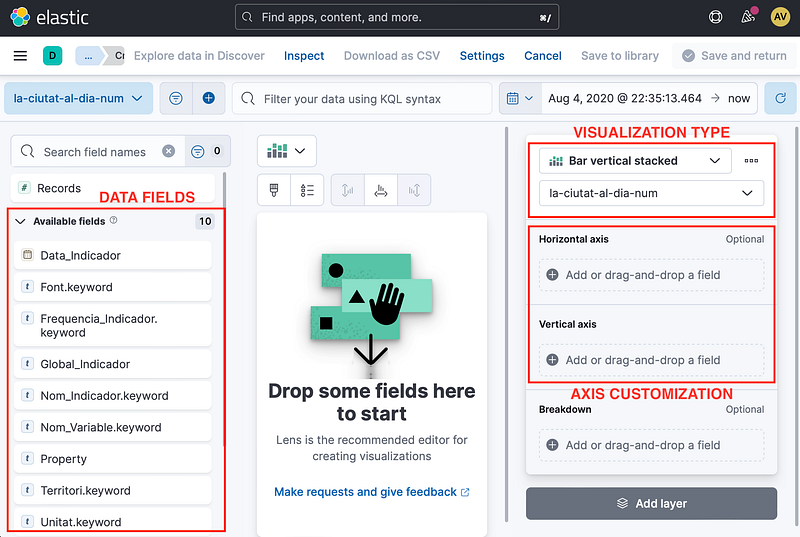
#1. Create a New Dashboard: Click on the Create New Dashboard button to start creating a new dashboard.
#2. Create Visualizations: Once you have created a new dashboard, you can add multiple visualizations to it. There are a wide range of visualization types, such as bar charts, line charts, tables, among others.
#3. Customize your Visualizations: It is possible to do so by selecting the data source, applying filters, and specifying the type of chart or graph. And the best part… it supports drag-and-drop!
#4. Organize and customize your Dashboard: You can also customize the layout of your dashboard by rearranging the visualizations, changing their size and orientation, and adding custom text.
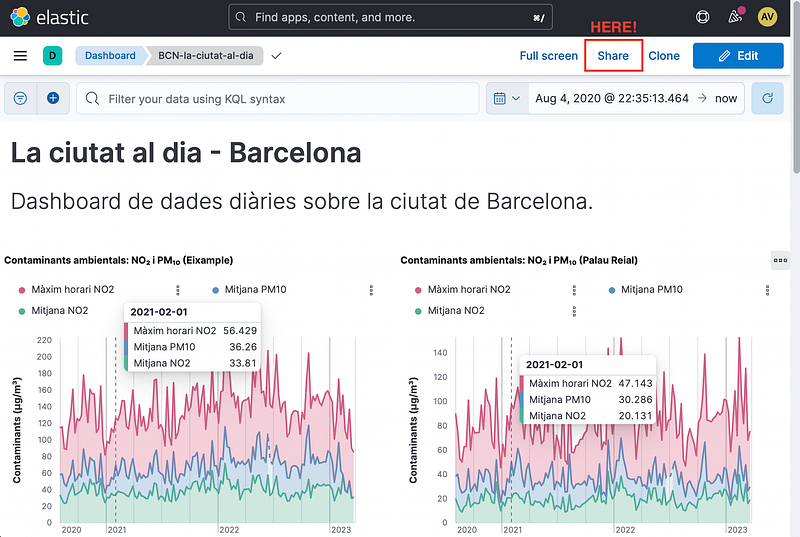
#5. Save and share your Dashboard: Once the dashboard is finished, you can save it and share it with other users. Elasticsearch Dashboards also allow users to explore their data using a point-and-click interface.
#6. Advanced options: You can also set up alerts and notifications to receive notifications when certain conditions are met. We will have time to explore this in a follow-up article!
That’s it! With Elasticsearch Cloud’s Dashboard tab, you can create custom visualizations and interactive dashboards that enable you to monitor and analyze your data in real-time.
With the vast amount of information generated nowadays, it’s essential to have tools that help us finding a needle in a haystack. In other words, turning raw data into meaningful insights.
Elasticsearch is a complete tool that can help you setting all the necessary steps for bringing you Dashboard to life! And remember, it is a suitable platform for all kinds of Dashboards, but it can really make the difference when working with time-series data or life data!
I hope at this point you are conviced enough to give a try to Elasticsearch! :)
Let’s put this into action! and remember …
Don’t forget to follow ForCode’Sake to get more articles like this one! ✨

Feel free to forward any questions you may have to [email protected] :)
You can also subscribe to my Newsletter to stay tuned for new content. Thank you!


