
Find similarity of ranked lists with RBO
Story overview
- Introduction
- Implementing RBO
- Tuning RBO hyperparameters

Introduction
Comparing ranked lists could be useful in several scenarios, most notably for search engines, which return a list of ranked elements. If you for example want to compare two search engines to each other, using a ranked list similarity score could be useful, to see how similar the search engines perform. The best part about RBO is that it does not require a ground truth for what would be the optimal list order, which could be helpful for many smaller-scale developers. Larger corporations will have the resources to hire people to rank the lists so that you can have a ground truth for what is the optimal list, but this is not available for everyone.
RBO (rank biased overlap) is one way to compare ranked lists. It takes into ranked lists, for example from two different search engines, and then returns a similarity score between these two lists. RBO uses 2 tunable parameters:
- p -> a value between 0 and 1, the lower the p, the more weighted the first elements of the list are (so the 3 first elements matter more if p is lower, compared to if p is higher for example)
- d -> number of elements to compare, so you only compare the d first elements of the ranked lists
Implementing RBO in Python
Implementing RBO in Python is easy to do using the RBO Python package. Just install it using:
pip install rbo
in the terminal, and it is ready to go.
You now need two ranked lists to compare, which I am assuming you already have, call them arr1 and arr2. You then have to choose the d first elements of both lists (also assuming the length of arr1 and arr2 is > d). Also, remember to import the RBO package. Here I have chosen a p of 0.5, and the 5 first elements (d = 5):
import rbo
p = 0.5
d = 5
arr1 = ...
arr2 = ...
arr1, arr2 = arr1[:d], arr2[:d] #only choose d first elements

score = rbo.RankingSimilarity(arr1, arr2).rbo(p = p)
This will now return a score that measures the similarity between 2 ranked lists.
Tuning parameters:
The parameters p and d can be tuned to whatever value fits your need best, and there is no correct value for the parameters that fit in all scenarios. What could be interesting to see, however, is the weight from different parameters. For a given d elements, with a given p, you can get the weights using the following script:
import numpy as np

def getWeight(p, d):
    series = 0
    for i in range(1, d):
        series += (p**i)/i
    return 1 - p**(d-1) + (((1-p)/p) * d *(np.log(1/(1-p)) - series))
The weight, in this case, refers to how much the d first elements are weighted for the similarity score. For example, for p = 0.5, the 3 first elements (d = 3) are weighted around 0.954 (so the 3 first elements make up 95.4 percent of the final similarity score that is calculated).
Note the script above is made from equation 21 in the RBO paper.
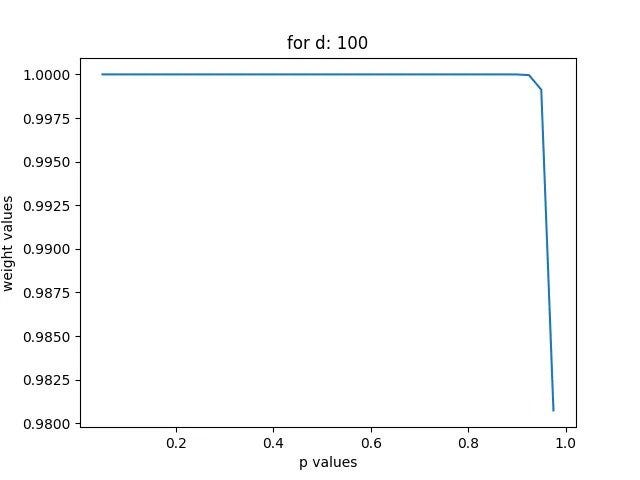
You can also plot the weights you get for different parameters, under I am showing for d = 3 and d = 100, and p ranging from: [0.025, 0.050, …, 0.975]:
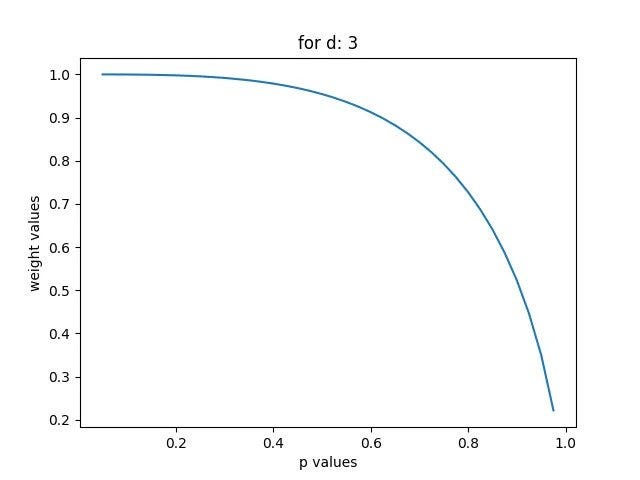
The weighting for d = 3, and different p values, you can see the 3 first elements are weighted lower the higher the p-value is, starting with weight approximately = 1 for p = 0.1, ending approximately at weight = 0.22
For d = 100, the curve looks vastly different since the 100 first elements will consist of most of the weight for any p (since it is a ranked list, and higher ranks are in general more important)
Nonetheless, you can try different values, but if you are working with a search engine, I would consider making d ≤ 10, since few people look at search engine results that are ranked above 10 (think of it as going on the second page of Google, which is probably are a rare occurrence for most). Then you can test for different p values, choosing the one where the weighting fits best for you.
Using this metric might be useful if you are creating search engines, which you can start doing by implementing TF-IDF, a common retrieval technique. To learn how to, check out this article on TF-IDF.
You can check out the academic paper for the RBO measure here (note that you might need to be on an academic network to view it).
If you want to check some other related articles I have written, please check out: